Ethereum "Cooling Off" to Build Momentum? ETF Funds Quietly Flow Back, Is the Historic Rally Script About to Play Out Again?

marsbitPubblicato 2025-12-12Pubblicato ultima volta 2025-12-12

Introduzione

Ethereum's price has been consolidating near $3,200 after facing resistance between $3,350 and $3,650, a zone reinforced by the 200-day EMA. Despite this, signs of recovery are emerging in spot ETF flows. Since November 21, ETH ETF assets under management have increased by 28%, from $16.8 billion to $21.5 billion, indicating a gradual return of buyer interest. Although net flows remain negative at -$138 million, this marks a significant improvement from October’s -$500 million, suggesting weakening selling pressure. The 30-day moving average of net active buying is also rising, resembling a pattern seen in early 2025 that preceded a major price surge. On the 4-hour chart, ETH is testing a key demand zone between $3,100 and $3,180. A hold above this level could lead to a retest of the 200-day EMA and a breakout toward $3,900. However, a breakdown may trigger a drop toward $3,000. Derivatives data shows neutral sentiment with mild funding rates and open interest, indicating cautious optimism. The key for Ethereum’s next major move depends on sustained defense at current support levels, coupled with growing ETF inflows and active buying momentum.

Ethereum's price action has flattened this week, encountering significant resistance in the supply zone between $3,650 and $3,350. The token is currently consolidating near $3,200. This resistance level roughly coincides with the 200-day Exponential Moving Average (EMA), further reinforcing the overhead pressure in this area. Notably, just as this is happening, spot Exchange Traded Fund (ETF) flows are beginning to show initial signs of recovery.

Key Points:

  • Since November 21st, the Assets Under Management (AUM) for spot Ethereum ETFs have increased from $16.8 billion to $21.5 billion, a gain of 28%.
  • Net active buying volume is showing an upward trend, indicating that the previously strong selling pressure is weakening, while buying power is gradually returning.
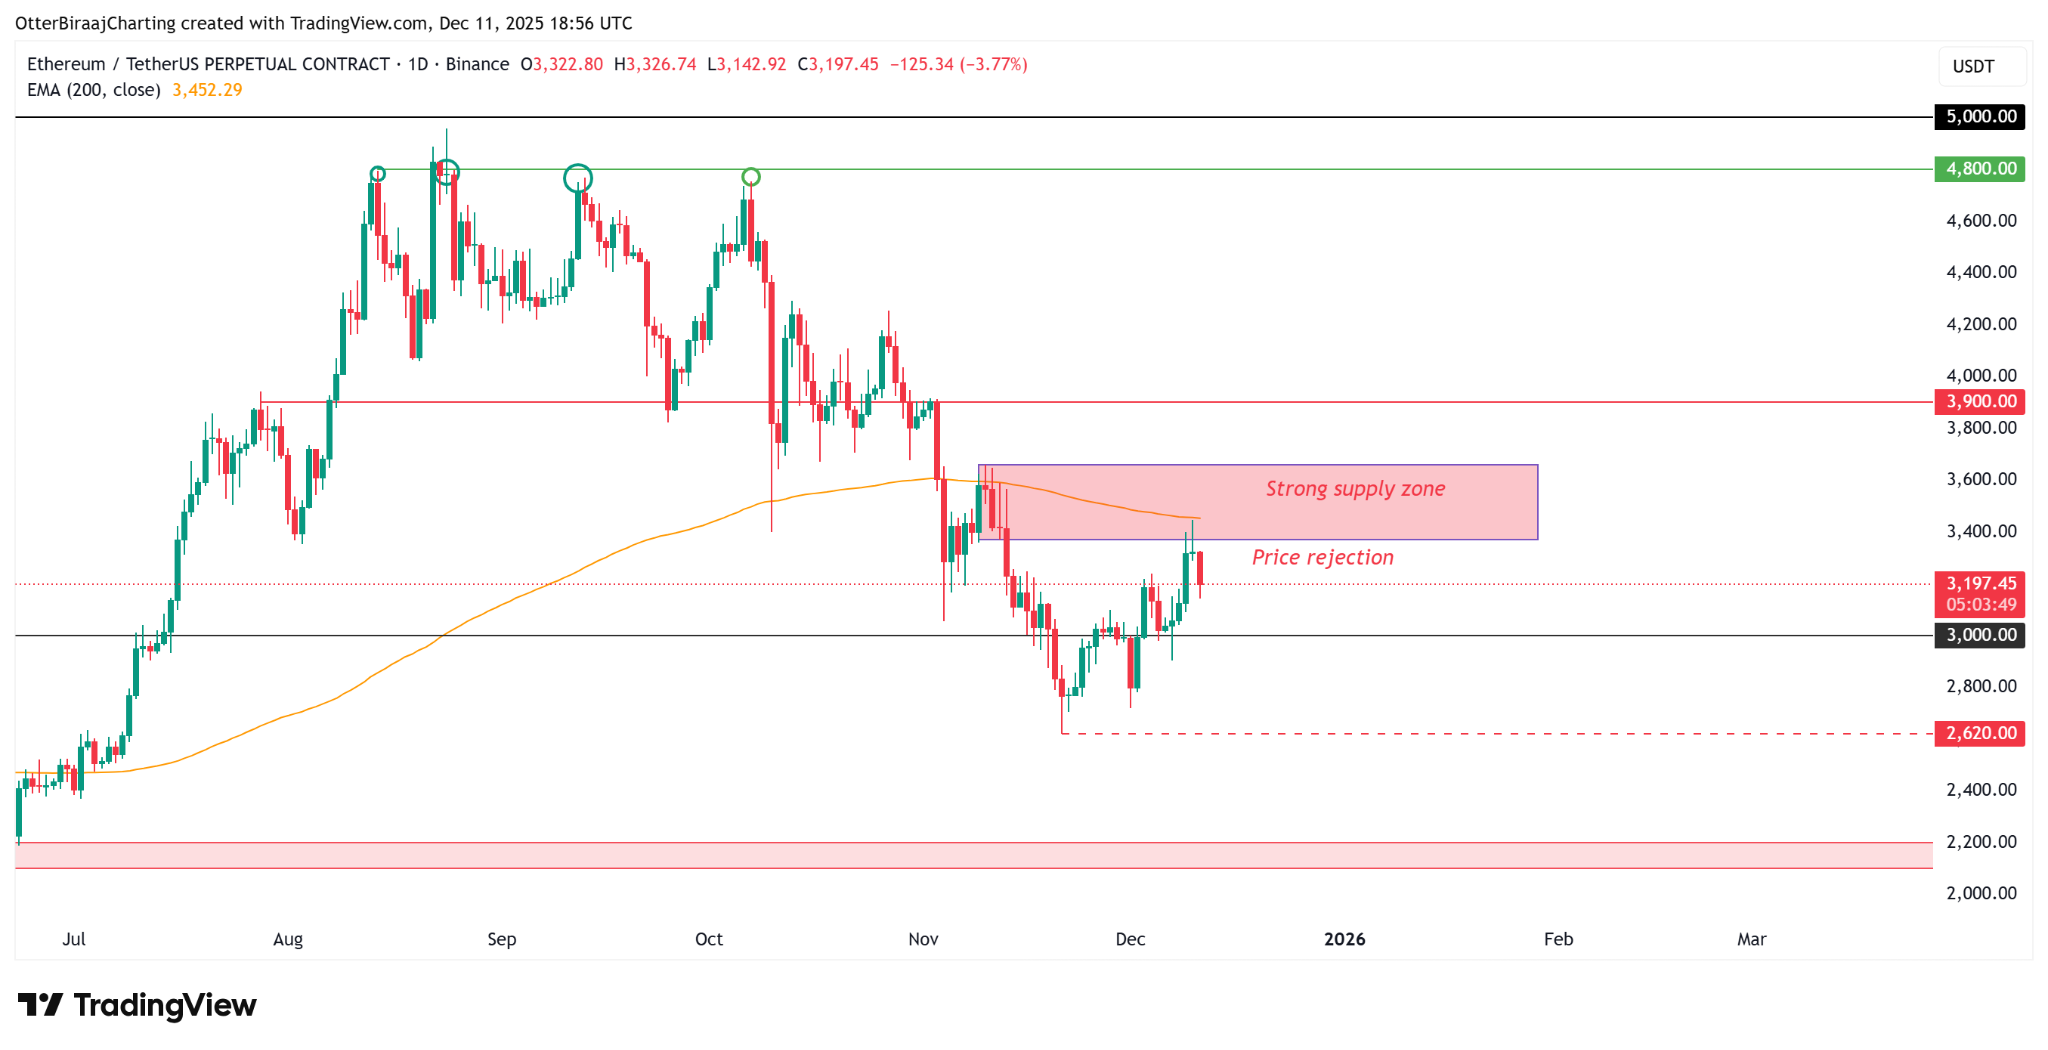
Ethereum Daily Chart. Source: TradingView


ETF Inflows Resume, But Charts Reflect Lingering Investor Caution

According to data from Glassnode, after weeks of consecutive outflows, spot ETH ETFs are finally showing initial "signs of recovery." Since November 21st, ETF net asset values have rebounded by 28%, suggesting potential improvement in market demand before year-end. However, compared to the peak of $32 billion in early October, the magnitude of this rebound remains modest, indicating that institutional confidence has not yet fully recovered.
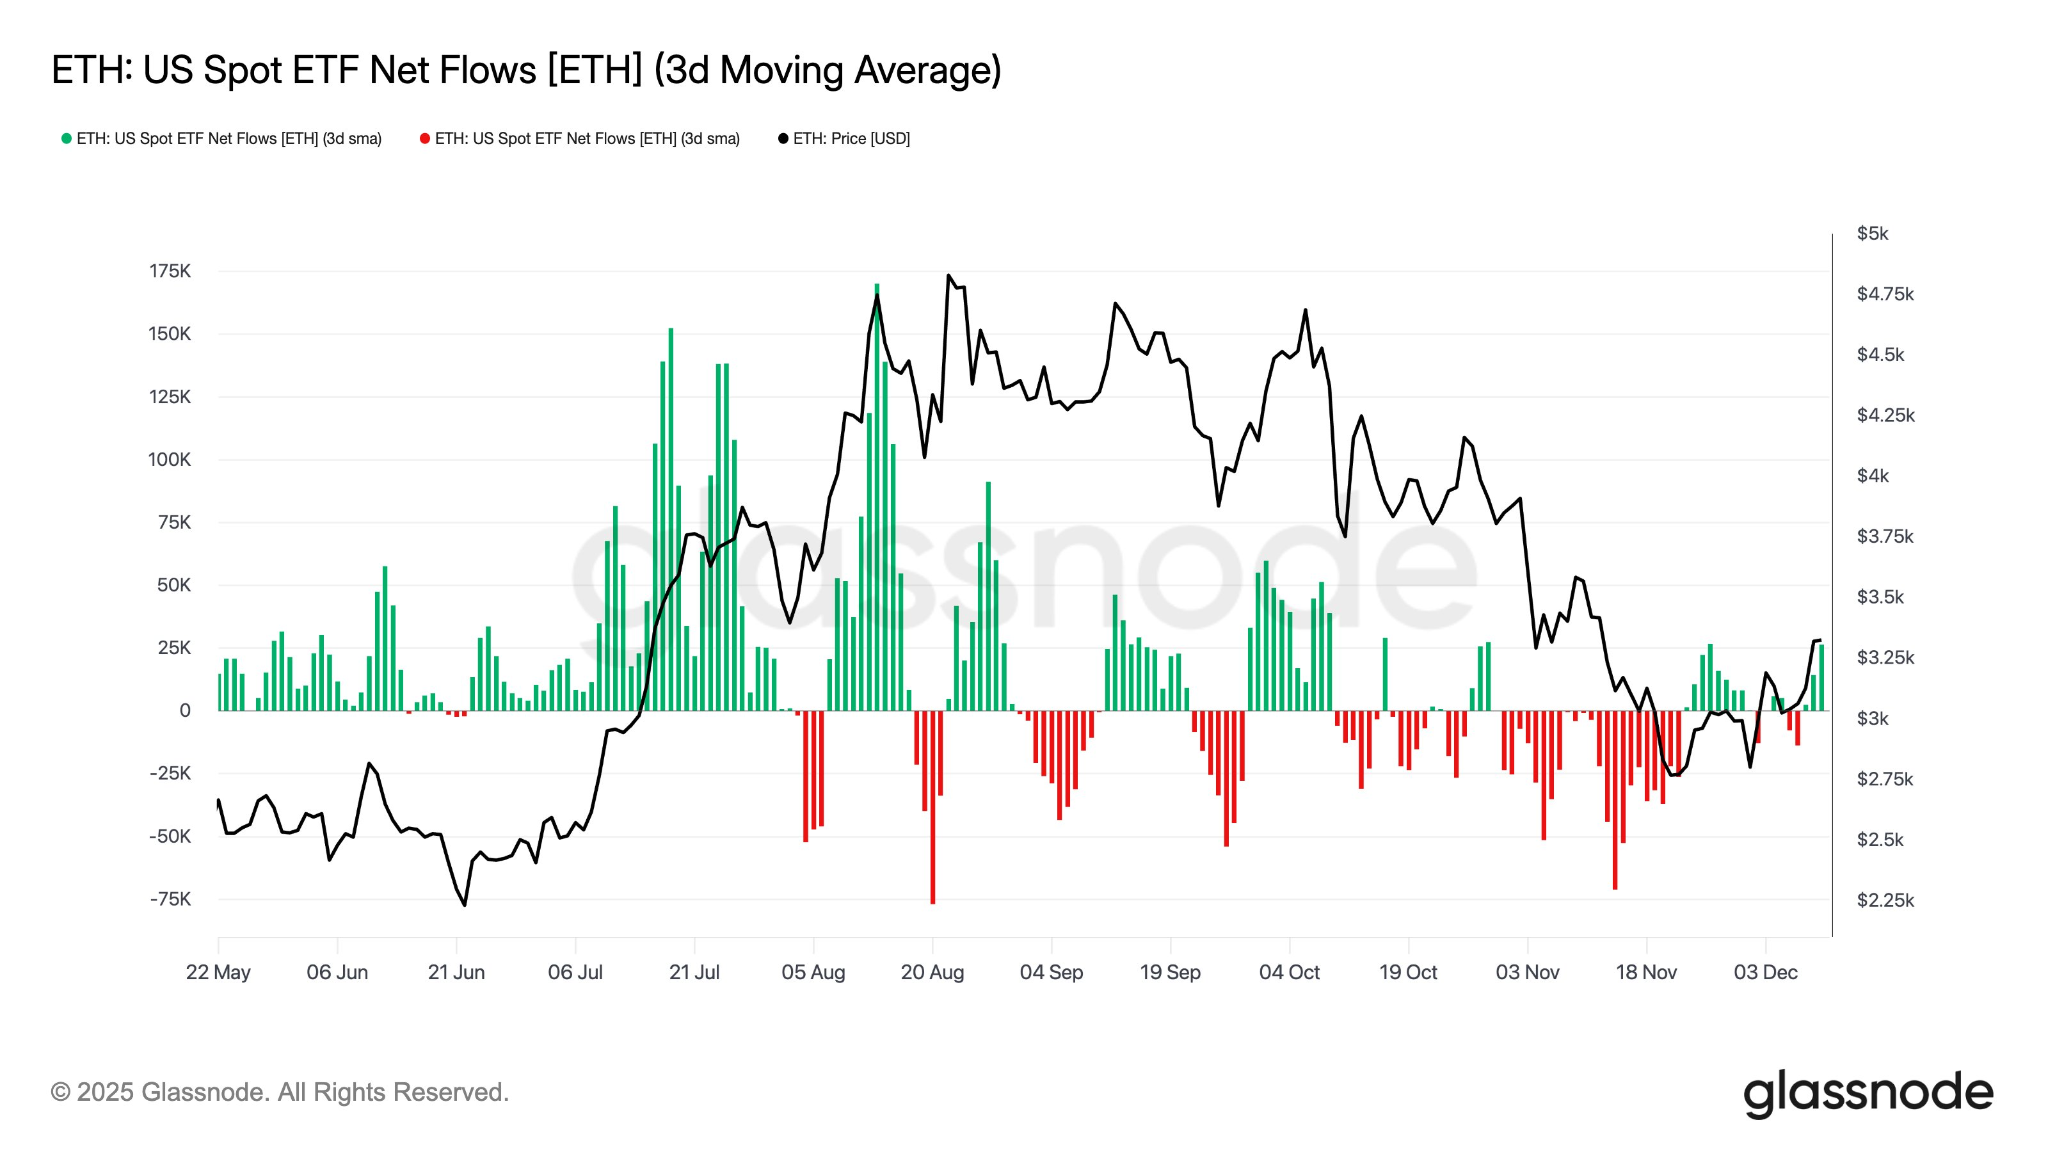
Spot ETH ETF Net Flow. Source: Glassnode

Data from CryptoQuant further supports this assessment. Although the net flow remains negative (-$138 million), it has improved significantly from the -$500 million seen in October, marking a structural shift. During the correction phase from September to October, the market was dominated by active selling, but this trend is gradually subsiding.

The 30-day moving average of net active buying volume is also showing a pattern of rising lows. A similar structure appeared in early 2025, after which the Ethereum price achieved a nearly 3-fold increase and reached a new all-time high.

If the current trend continues, this positive shift in active buying activity could become a key catalyst driving Ethereum to break out upward again in the coming weeks.
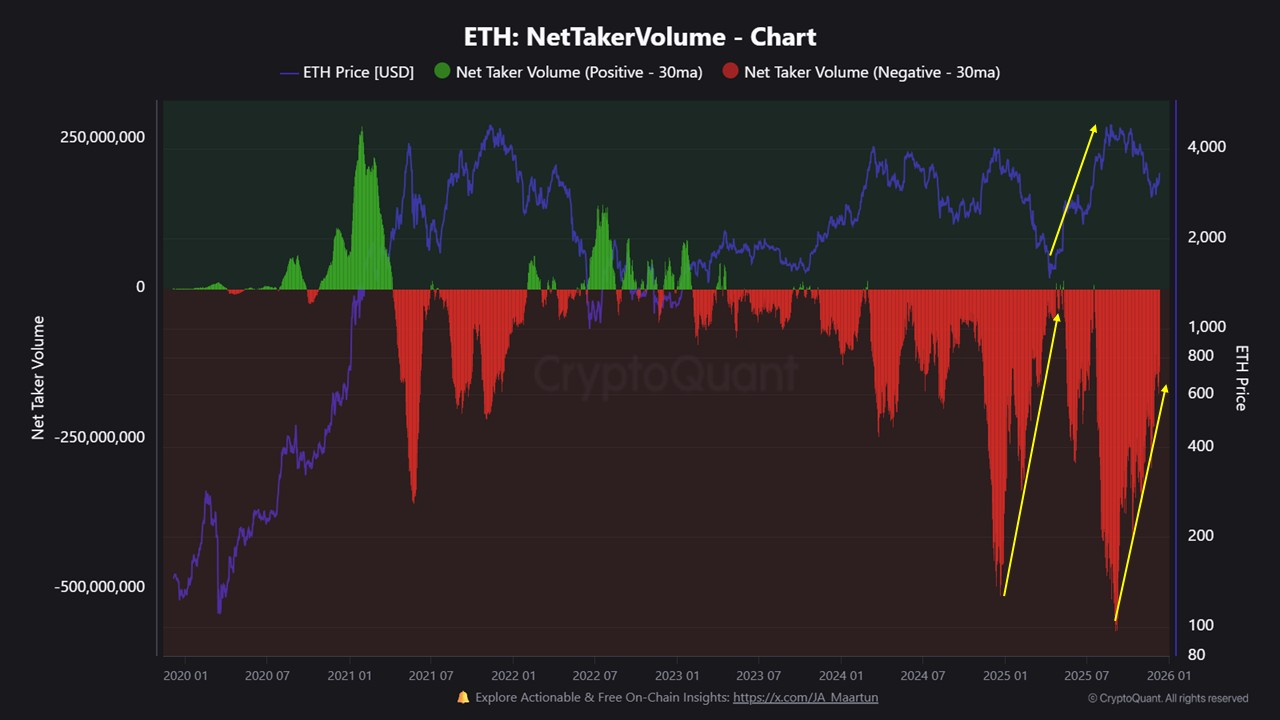

Ethereum On-Chain Flow Data. Source: CryptoQuant


ETH Price Consolidates in Support Zone, Derivatives Market Cools Off

The current Ethereum price is testing the order block density zone between $3,100 and $3,180 on the 4-hour chart, an area that could transform into near-term demand support. Although the ETH price remains within an ascending channel, the upward momentum has noticeably weakened. The market is in a structural decision-making phase regarding its direction.
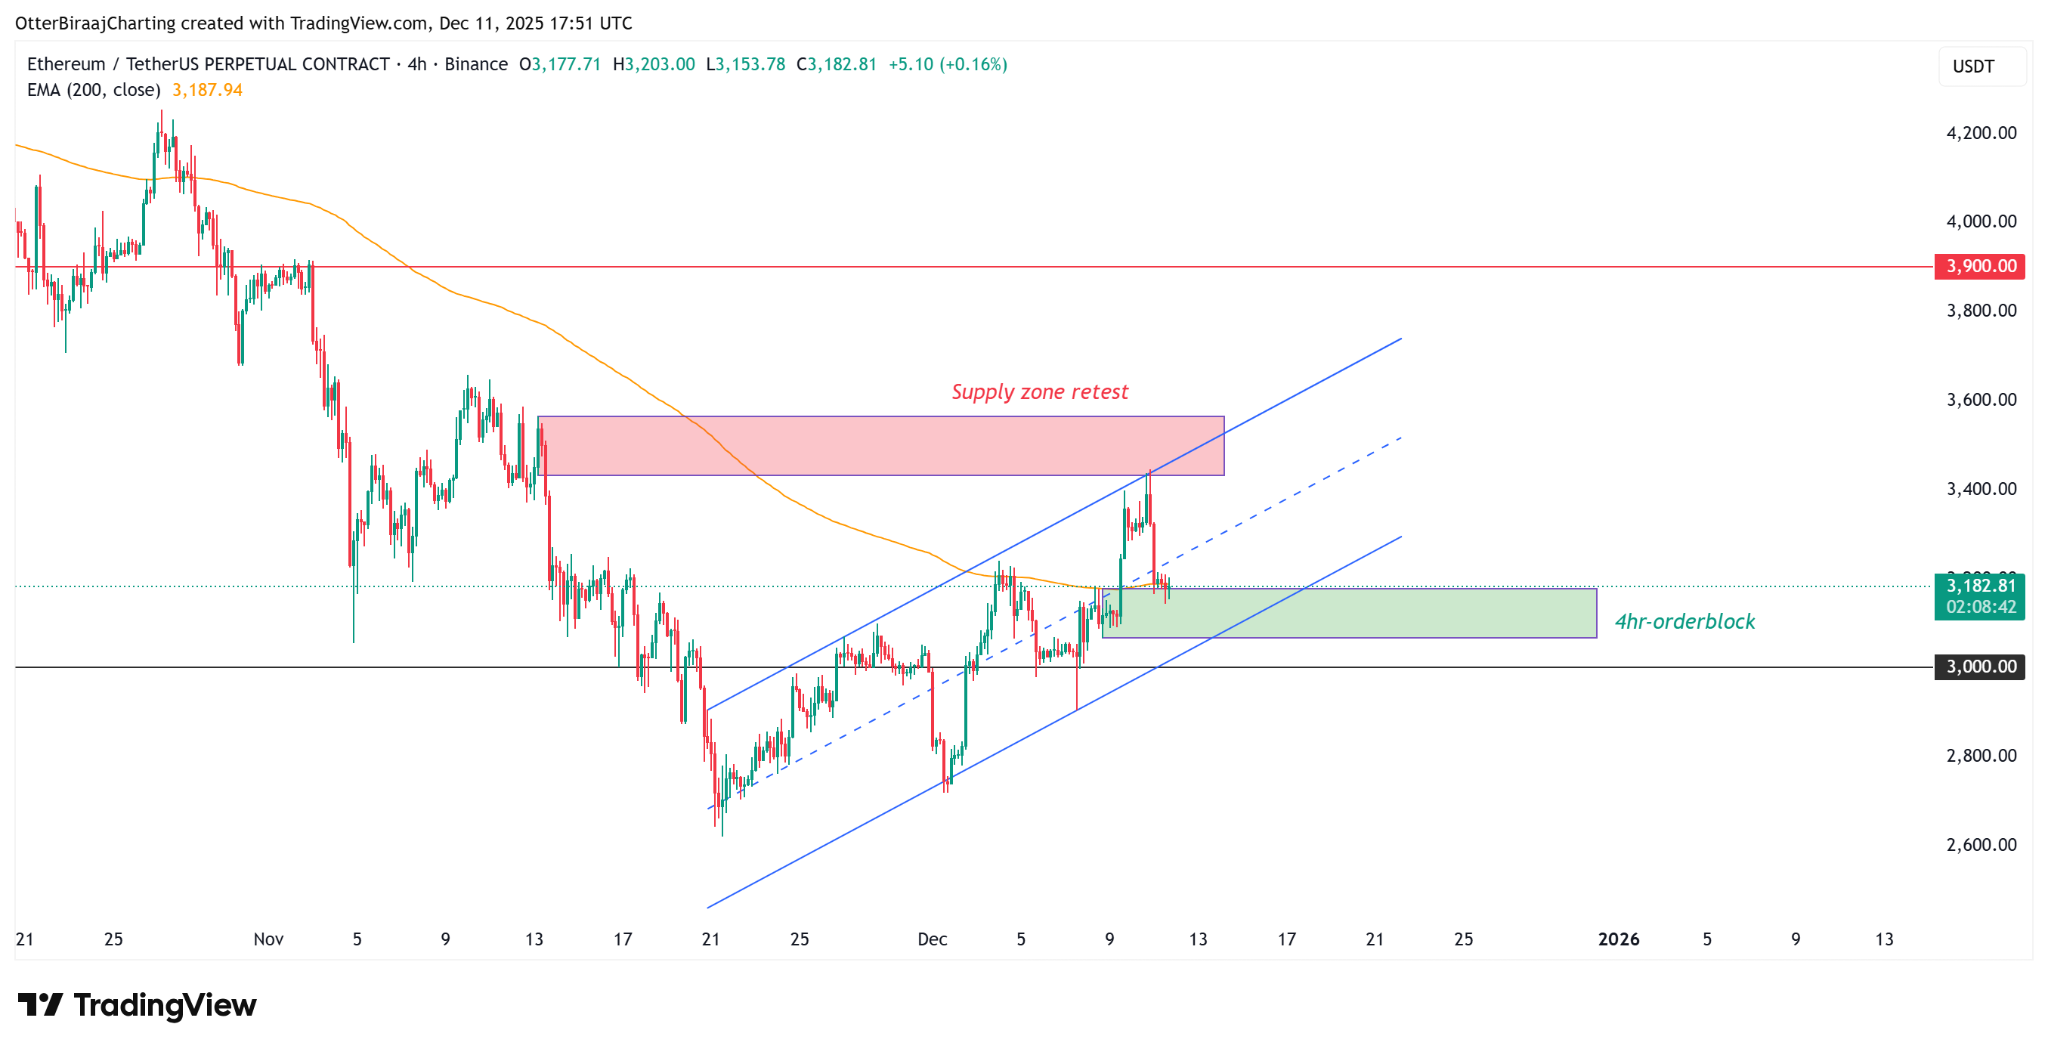

4-Hour Price Chart. Source: TradingView

From a bullish perspective, if the price can hold above this demand zone and the channel support, ETH could potentially attack the daily 200-day EMA again. A clear break above $3,450 would invalidate the previously formed resistance and open the path for the price to test the $3,900 resistance level.

From a bearish viewpoint, a break below the lower trendline of the current ascending channel would constitute a bearish signal, potentially leading the price to test the key $3,000 support level.

Data from Hyblock shows the Ethereum derivatives market presents a neutral yet fragile landscape. After the price met resistance, the Total Open Interest (OI) slightly declined. Funding rates are positive but not significantly high, and the buy-sell ratio is also near neutral, indicating that spot investors have not yet formed a consensus bullish expectation.
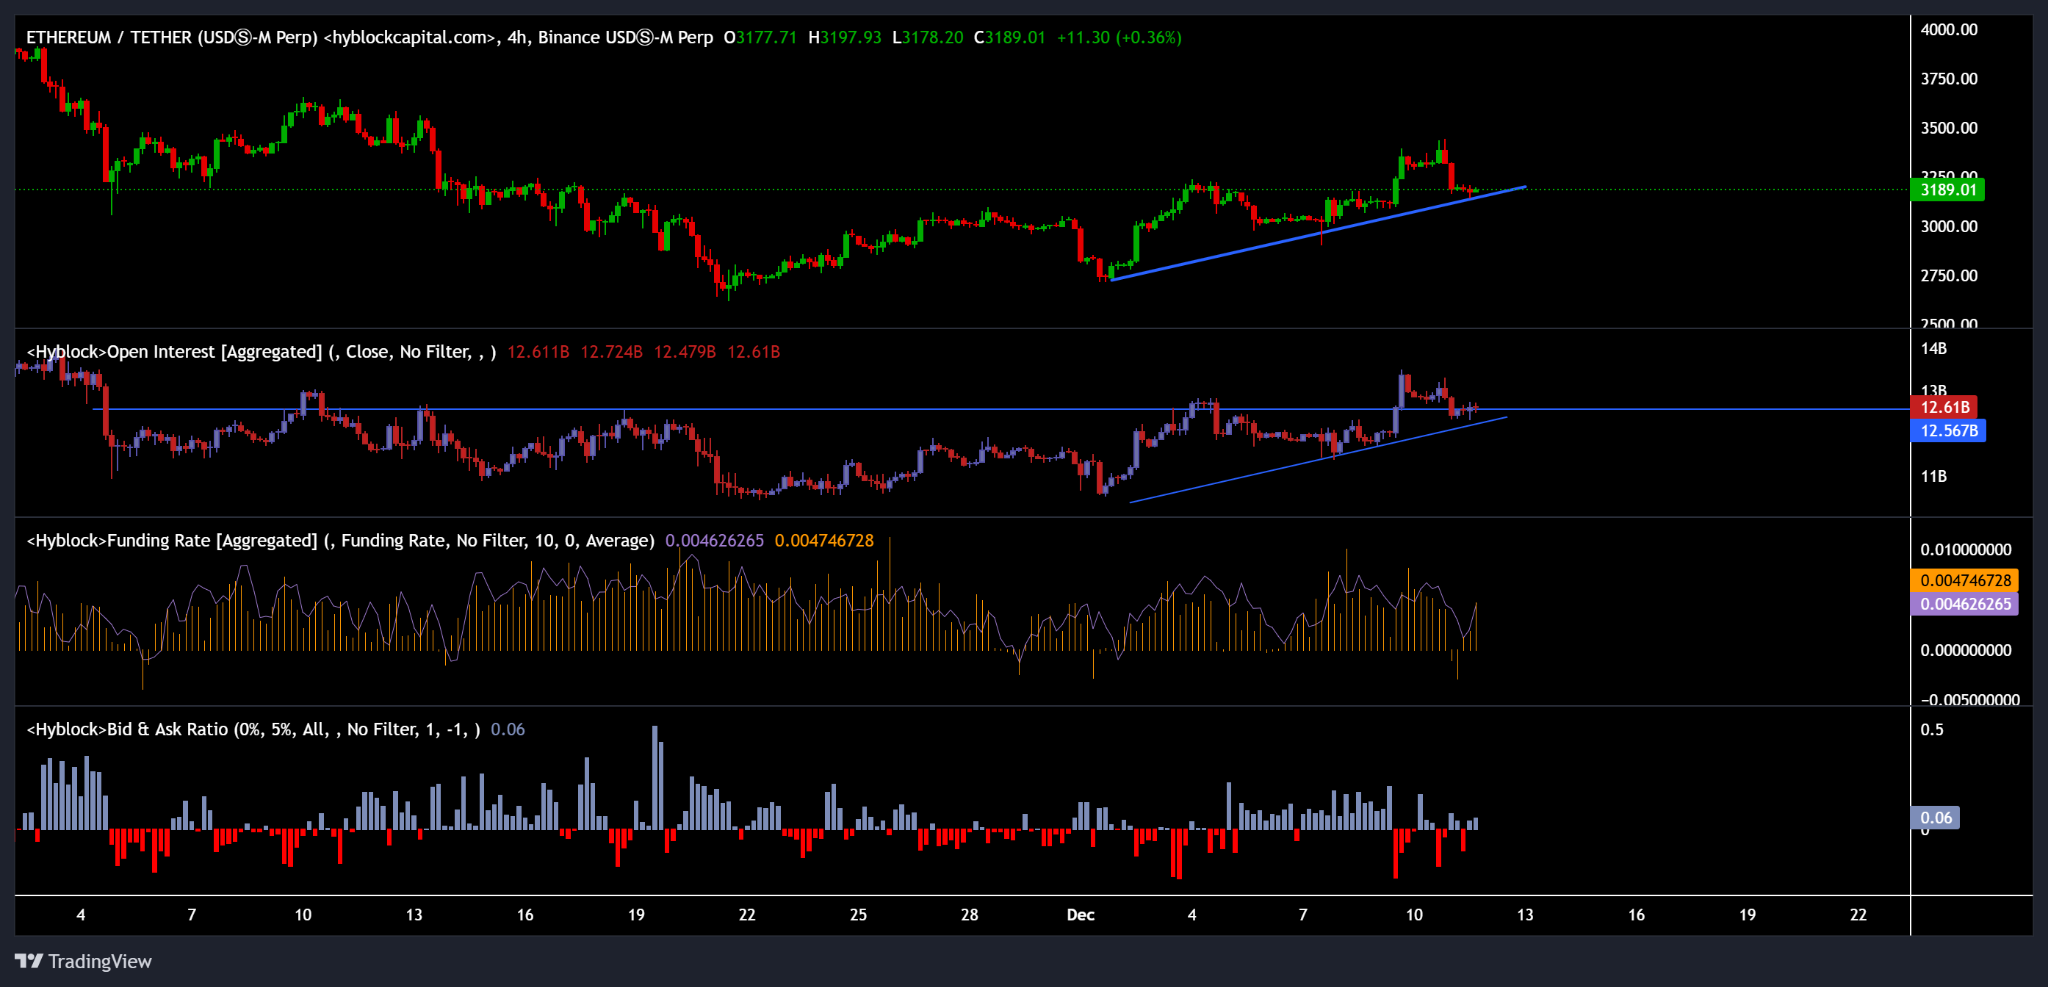
Ethereum Futures Market Data. Source: Hyblock Capital

Summary: The key to Ethereum's subsequent price action lies in whether the bulls can sustain their defense in the demand support area, thereby catalyzing a virtuous cycle between active buying flows and ETF demand, ultimately translating into sustained upward momentum.


Crypto di tendenza

Domande pertinenti

QWhat is the current price range where Ethereum is consolidating, and what key resistance level is it facing?

AEthereum is currently consolidating around $3200, facing significant resistance in the $3650 to $3350 supply zone, which aligns with the 200-day Exponential Moving Average (EMA).

QHow much has the assets under management (AUM) for spot Ethereum ETFs increased since November 21, and what does this indicate?

ASince November 21, the AUM for spot Ethereum ETFs has increased by 28%, from $16.8 billion to $21.5 billion, indicating a potential recovery in market demand and a shift from strong selling pressure to returning buyer interest.

QWhat key on-chain metric from CryptoQuant shows a structural shift in market dynamics, and how has it improved?

AThe net flow metric, while still negative at -$138 million, has improved significantly from -$500 million in October, indicating a structural shift where the previously dominant active selling pressure is diminishing.

QWhat is the critical support zone on the 4-hour chart that Ethereum is testing, and what are the potential price targets for a bullish breakout?

AEthereum is testing the order block support zone between $3100 and $3180 on the 4-hour chart. A bullish breakout above the 200-day EMA and a clear break above $3450 could open the path for a move towards the $3900 resistance level.

QWhat does the data from Hyblock Capital indicate about the current sentiment in the Ethereum derivatives market?

AHyblock Capital data shows a neutral but fragile sentiment in the derivatives market. Open Interest (OI) has slightly decreased, funding rates are positive but not excessively high, and the buy-sell ratio is near neutral, indicating that spot investors have not yet formed a strong, unified bullish consensus.

Letture associate

Unlocking $100 Million in Liquidity? Pump.fun's New Policy Tests the 5-Minute Pump Technique

Pump.fun, a popular meme coin launchpad, has introduced a new standard mechanism called BOOST. It aims to address a significant capital efficiency issue: when a newly launched token graduates from its initial bonding curve to a liquidity pool (LP), roughly 20% of its liquidity becomes permanently locked as "dead liquidity," estimated to waste over $100 million annually. Instead of locking these funds permanently, BOOST repurposes them. Upon a token's migration, approximately 20% of the settlement funds (e.g., 17.6 SOL or ~$2516 USDC) are used to buy back the token on the open market over a 5-minute period via a Time-Weighted Average Price (TWAP) mechanism. All purchased tokens are immediately burned. This creates a brief, systematic buy pressure immediately after migration, potentially generating a short-term price surge ("pump") while permanently reducing the token's circulating supply. The goal is to enhance the immediate post-launch trading experience, potentially increasing trader retention and sustainable protocol revenue, which funds ongoing token buybacks. However, concerns exist that this artificial 5-minute boost could lower the barrier for launching low-quality tokens and lead to steeper price crashes once the buy pressure stops, if followed by large sell-offs. The feature automatically applies to tokens migrating after July 21, 2024, but not to previously migrated tokens or those launched via the Mayhem AI Agent lab.

marsbit5 min fa

Unlocking $100 Million in Liquidity? Pump.fun's New Policy Tests the 5-Minute Pump Technique

marsbit5 min fa

Podcast Notes | Conversation with GSR Asset Management Head: To Determine if This Crypto Rally is Real, Just Watch the Lending Rates on Aave

Podcast Summary: Dialogue with GSR's Head of Asset Management: To Determine if This Crypto Rally is Real, Just Check Lending Rates on Aave Andy Baehr, Managing Director of Asset Management at GSR, discusses the current crypto market, characterizing it as stuck in a state of "ambivalence" with short-lived, unsustainable rallies. He outlines a simple framework: the market moves between "ambivalence" and "conviction" (sustained upward momentum). Currently, every rally resembles a single-stage rocket booster that quickly fizzles out. Baehr identifies three key signals to watch: 1) DeFi lending rates, 2) the potential passage of the CLARITY Act, and 3) the market forming a consensus on the "Fed hawkish peak." He emphasizes that the most immediate indicator for the sustainability of the recent CPI-triggered rally is the USDC borrowing rate on Aave, currently around 3.75%—close to U.S. Treasury yields. The absence of a credit spread indicates low leverage demand and a lack of market energy. He explains that a healthy, sustained rally requires layered buying pressure. Last year's rally progressed from an ETH short squeeze to crypto-native trader influx and finally to ETF inflows. Currently, this structure is missing. Other potential structural buyers like Digital Asset Treasury (DAT) companies are absent, and ETF flows have proven transient. Baehr notes that while small-cap crypto tokens outperformed large caps in Q2—a potential sign of capitation in major assets—capital is also flowing to more exciting opportunities like AI stocks and tech IPOs, leaving crypto sidelined. Regarding DeFi, he highlights that platforms like Aave provide a clear, real-time signal of leverage demand through their supply/demand-driven interest rates. A significant, sustained rate increase would signal genuine market conviction. He also observes the quiet emergence of fixed-income-like products and vaults in DeFi. On regulation, the probability of the CLARITY Act passing before the August 7th deadline has dropped linearly from 75% to below 40% on Polymarket. Baehr suggests its passage would be treated as a bullish surprise, a potent driver for price movement. However, political hurdles, including ethical clause debates and disclosures about the First Family's crypto profits, remain significant obstacles. Ultimately, the market awaits clarity on the Fed's terminal rate under Chair Warsh. Until the "Fed Solstice"—the point where the market collectively understands the peak of hawkish policy—sustained conviction will be difficult to achieve.

marsbit36 min fa

Podcast Notes | Conversation with GSR Asset Management Head: To Determine if This Crypto Rally is Real, Just Watch the Lending Rates on Aave

marsbit36 min fa

Trading

Spot

Articoli Popolari

Come comprare FLOW

Benvenuto in HTX.com! Abbiamo reso l'acquisto di Flow (FLOW) semplice e conveniente. Segui la nostra guida passo passo per intraprendere il tuo viaggio nel mondo delle criptovalute.Step 1: Crea il tuo Account HTXUsa la tua email o numero di telefono per registrarti il tuo account gratuito su HTX. Vivi un'esperienza facile e sblocca tutte le funzionalità,Crea il mio accountStep 2: Vai in Acquista crypto e seleziona il tuo metodo di pagamentoCarta di credito/debito: utilizza la tua Visa o Mastercard per acquistare immediatamente FlowFLOW.Bilancio: Usa i fondi dal bilancio del tuo account HTX per fare trading senza problemi.Terze parti: abbiamo aggiunto metodi di pagamento molto utilizzati come Google Pay e Apple Pay per maggiore comodità.P2P: Fai trading direttamente con altri utenti HTX.Over-the-Counter (OTC): Offriamo servizi su misura e tassi di cambio competitivi per i trader.Step 3: Conserva Flow (FLOW)Dopo aver acquistato Flow (FLOW), conserva nel tuo account HTX. In alternativa, puoi inviare tramite trasferimento blockchain o scambiare per altre criptovalute.Step 4: Scambia Flow (FLOW)Scambia facilmente Flow (FLOW) nel mercato spot di HTX. Accedi al tuo account, seleziona la tua coppia di trading, esegui le tue operazioni e monitora in tempo reale. Offriamo un'esperienza user-friendly sia per chi ha appena iniziato che per i trader più esperti.

207 Totale visualizzazioniPubblicato il 2024.12.10Aggiornato il 2026.06.02

Come comprare FLOW

Discussioni

Benvenuto nella Community HTX. Qui puoi rimanere informato sugli ultimi sviluppi della piattaforma e accedere ad approfondimenti esperti sul mercato. Le opinioni degli utenti sul prezzo di FLOW FLOW sono presentate come di seguito.

活动图片