Ethena sees $4 mln whale move as supply tightens – Is ENA’s rebound forming?

ambcryptoPubblicato 2026-03-24Pubblicato ultima volta 2026-03-24

Introduzione

A significant $4.07 million ENA withdrawal from Binance aligns with ongoing exchange outflows and rising buyer activity, indicating a tightening supply structure. Despite this, ENA’s price remains subdued, trading within the $0.089–$0.10 demand zone, which has absorbed selling pressure. The broader structure remains bearish below the $0.262 resistance level. However, Spot Taker data shows increasing buyer dominance, suggesting accumulation is occurring. A liquidation cluster between $0.095–$0.101 presents a near-term liquidity target that could trigger upward momentum if breached. For a sustained rebound, ENA must reclaim $0.262 to shift market structure and target higher resistances.

A $4.07M ENA withdrawal from Binance coincides with persistent exchange outflows and rising buyer activity, reinforcing a tightening supply structure.

This withdrawal aligns with continued negative netflows, showing that tokens are leaving exchanges instead of preparing for sell pressure.

As a result, available supply on trading platforms keeps shrinking. However, Ethena’s [ENA] price has not yet reacted strongly, which suggests that accumulation continues beneath the surface.

This behavior often reflects positioning rather than immediate speculation. As liquidity tightens, even moderate demand could trigger sharper price reactions.

ENA compresses on demand

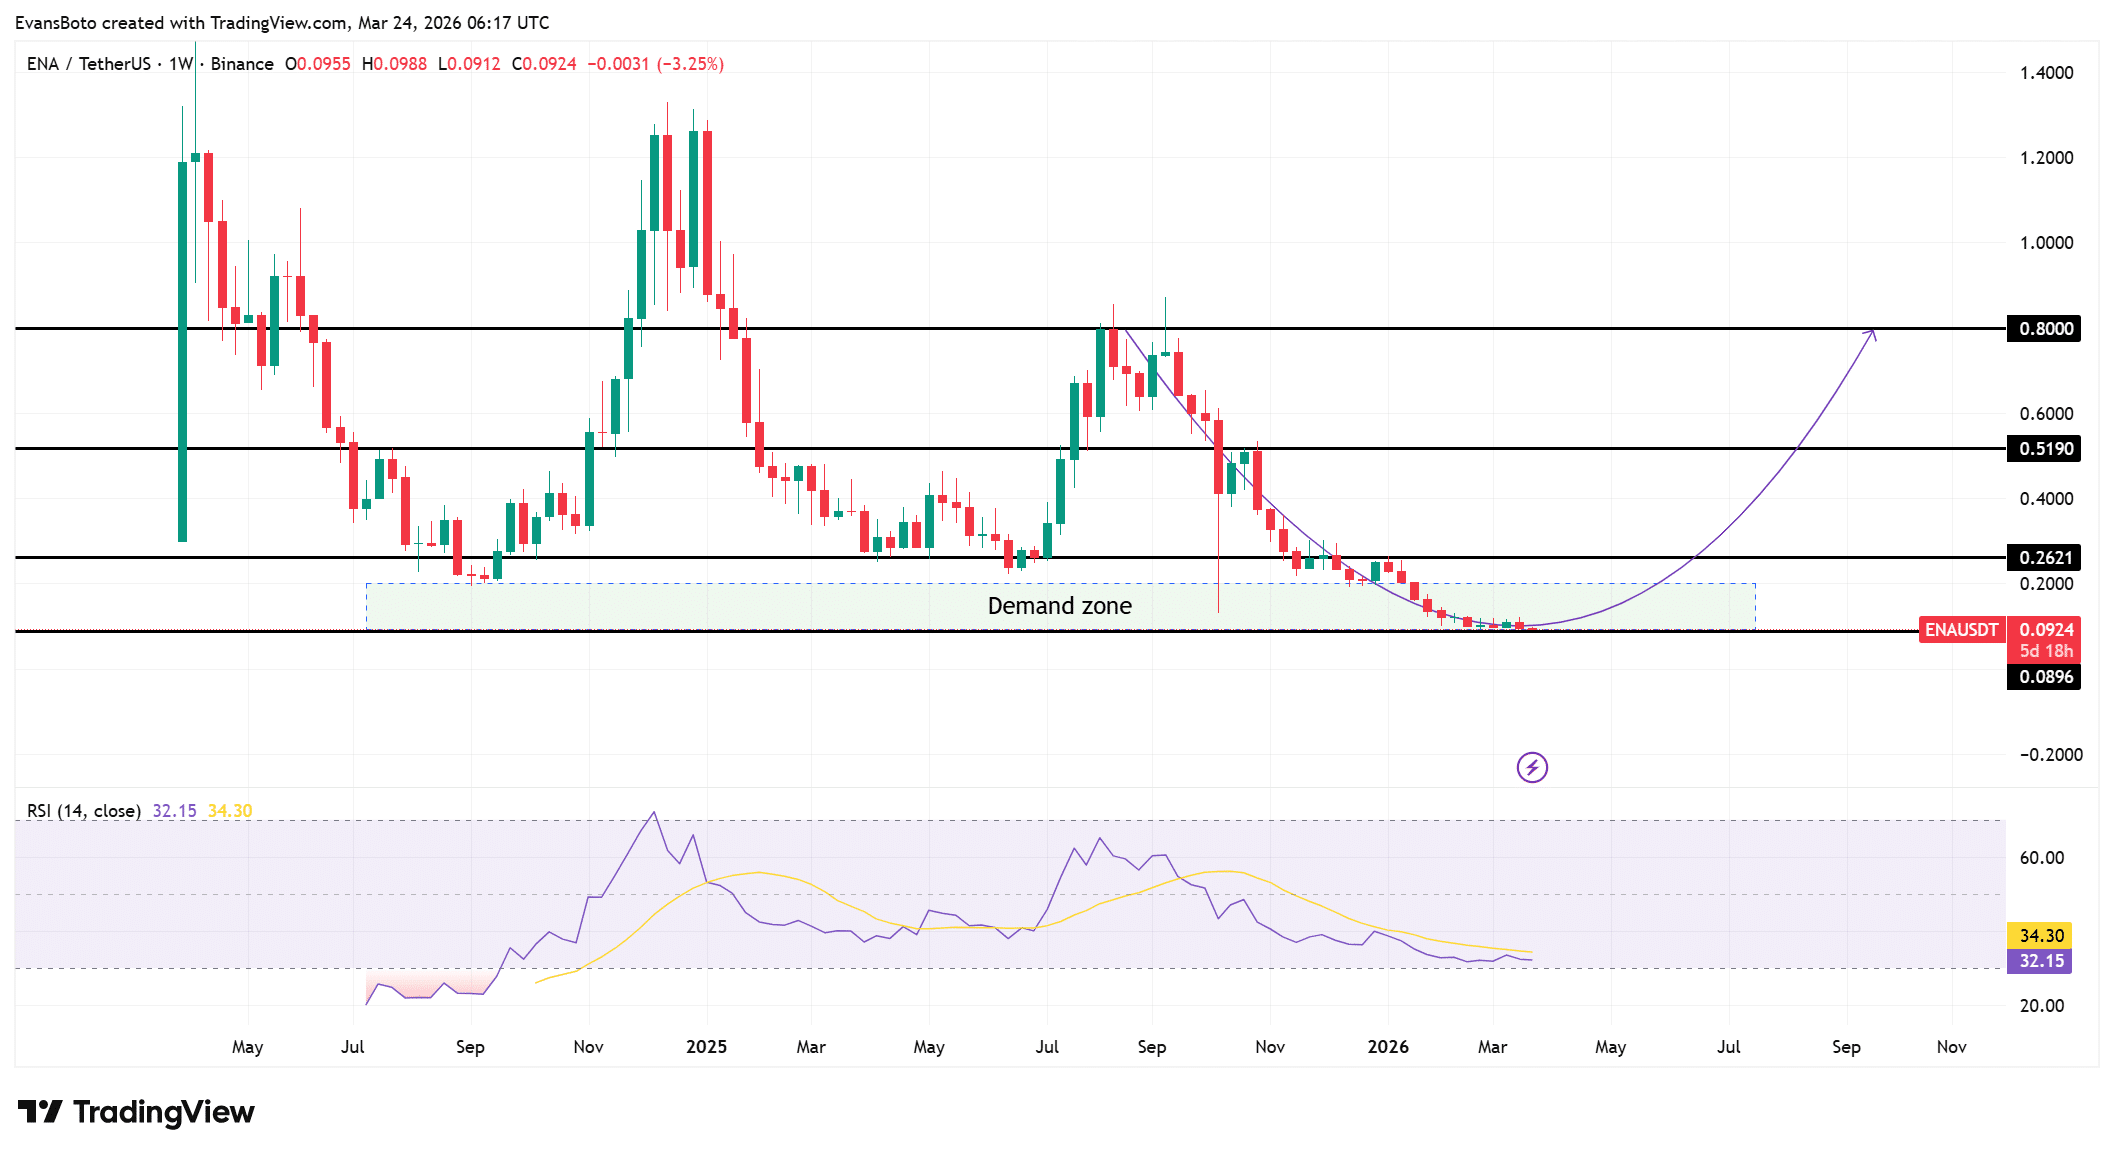
Price has declined steadily and now sits inside the $0.089–$0.10 demand zone, which marks a critical base on the weekly chart.

This level has absorbed selling pressure, as price no longer extends lower aggressively. However, ENA remains below the $0.262 resistance, which previously acted as support before the breakdown.

This shift confirms that the broader structure still leaned bearish. Above that, the $0.519 level stood as a major mid-range resistance, while $0.800 represented a higher timeframe barrier aligned with prior rejection zones.

Meanwhile, RSI hovered around 32, reflecting sustained weakness, yet it has started flattening. This behavior suggests that selling pressure is no longer intensifying.

As price compresses near demand while RSI stabilizes, the structure begins forming a base, though confirmation still depends on reclaiming higher levels.

Source: TradingView

Buyer aggression rises as demand absorbs supply

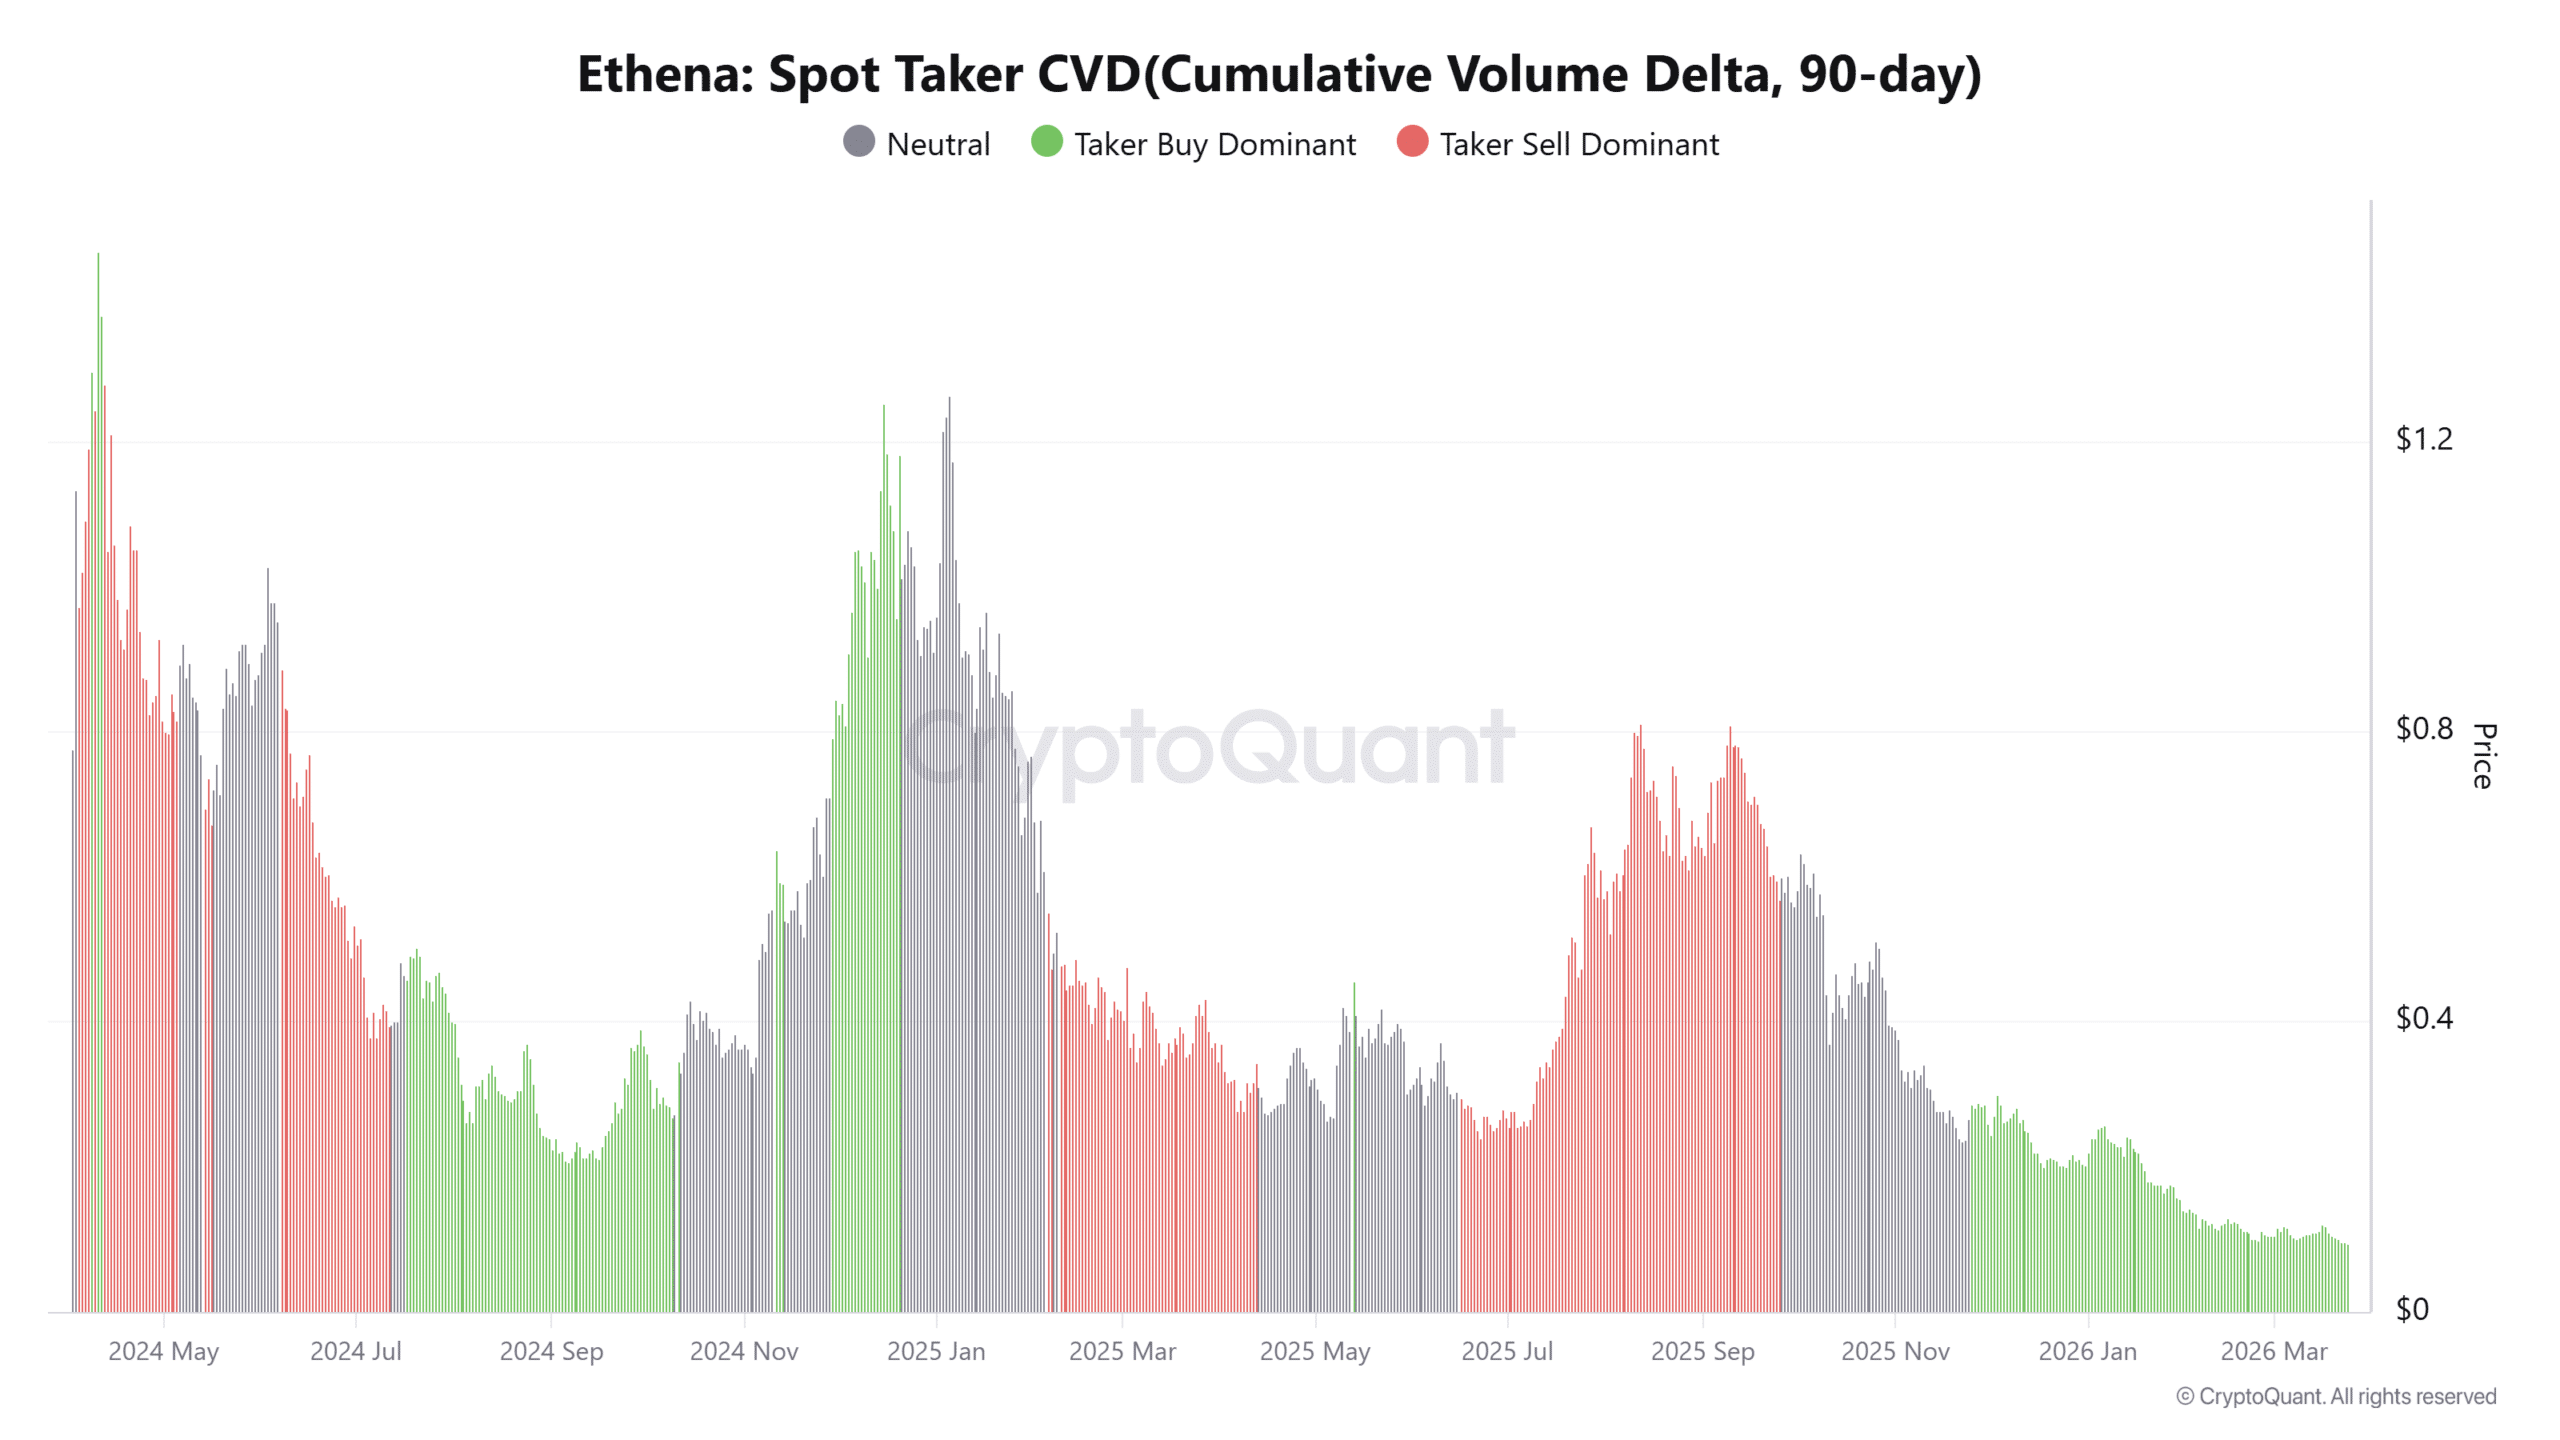
Spot Taker CVD has shifted into buyer dominance, showing that market participants were actively executing buy orders rather than waiting passively.

This behavior becomes more meaningful because it occurs while price trades near lows. Buyers were stepping in despite the weak structure, which signals confidence rather than reaction.

However, price has not yet expanded upward, indicating that sell pressure still absorbs part of this demand.

This creates a clear absorption phase where buyers gradually counterbalance supply. If this trend continues, prices could start responding more visibly.

For now, buyer dominance reflects accumulation behavior, as demand steadily interacts with reduced exchange supply without triggering immediate expansion.

Source: CryptoQuant

Liquidity builds above as shorts face pressure

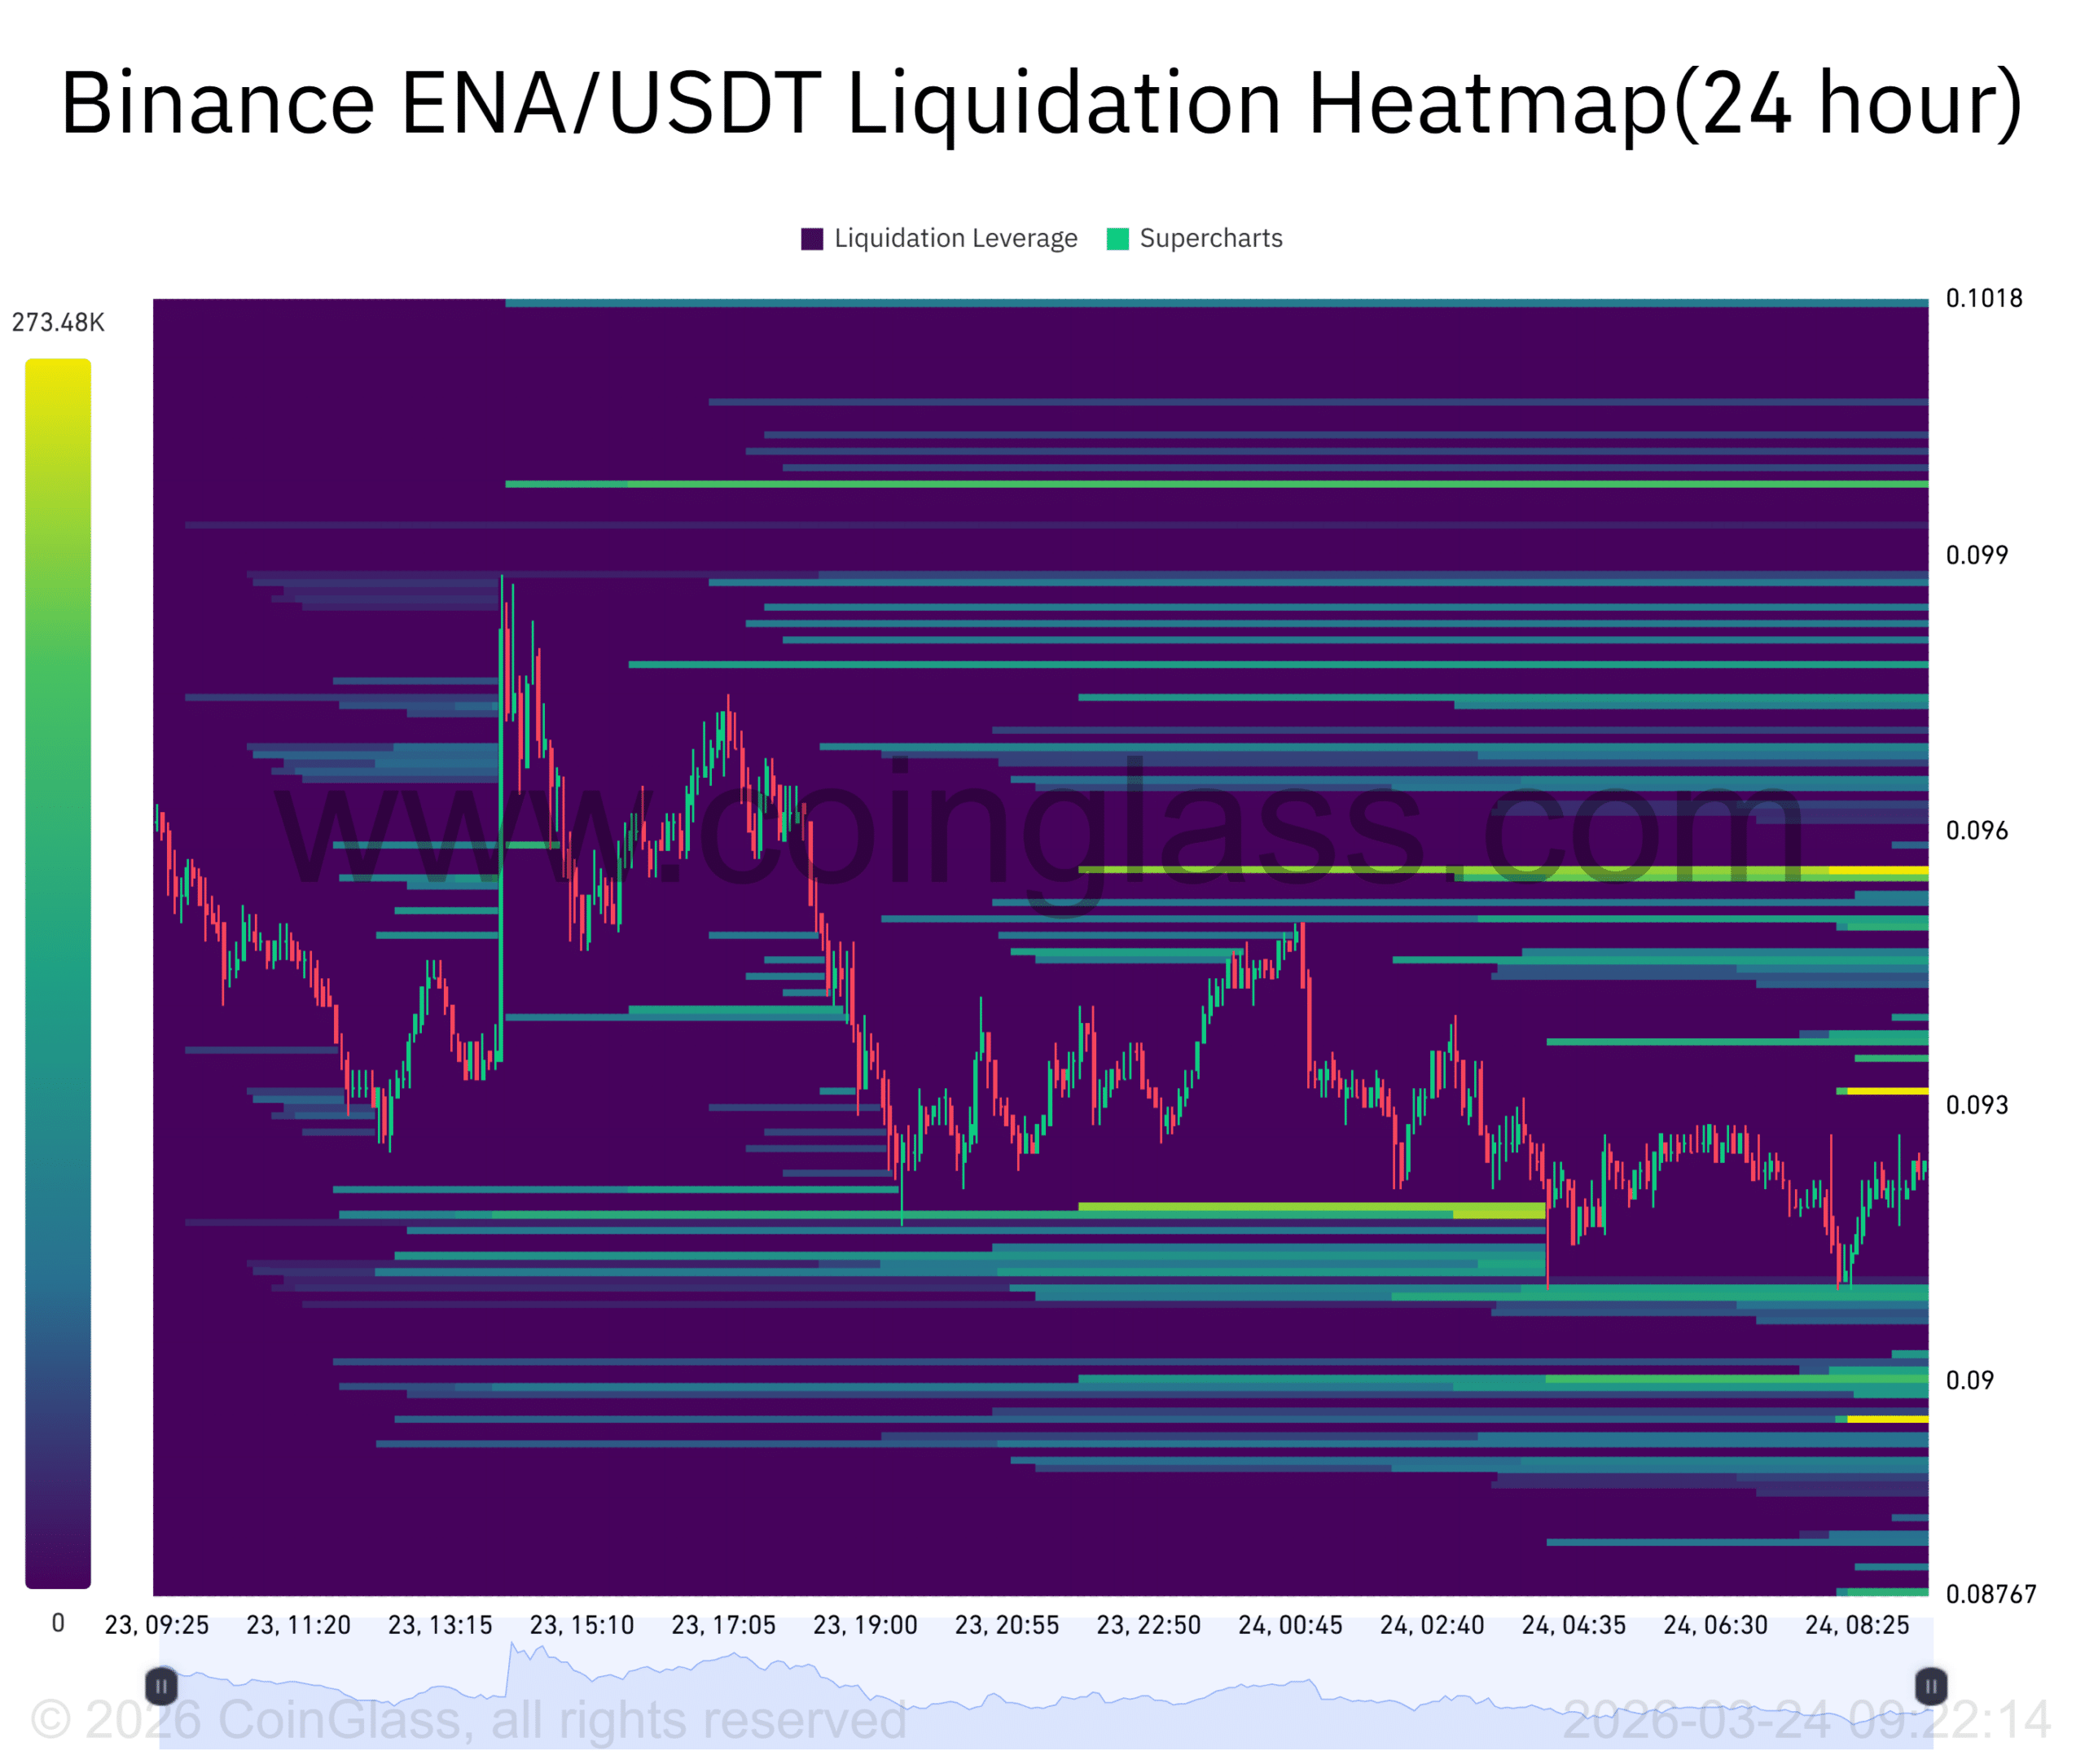
The liquidation heatmap shows dense clusters forming between $0.095 and $0.101, directly above the current price.

These levels contain significant short exposure, which could trigger forced buybacks if the price pushes upward.

As a result, they act as immediate liquidity targets. Meanwhile, ENA continues trading just below this zone, creating tension between price and overhead liquidity.

This setup aligns with rising buyer activity and reduced exchange supply. However, price must first break into this region to activate the cascade effect.

Until then, liquidity remains potential rather than realized. Still, the presence of concentrated short positions above price introduces a clear pathway for upward acceleration if demand sustains pressure.

Source: CoinGlass

To sum up, ENA continues to compress within the $0.089–$0.10 demand zone as exchange outflows and buyer-dominant CVD reflect ongoing accumulation.

This structure suggests supply continues to tighten while demand absorbs available liquidity.

However, a confirmed shift requires reclaiming $0.262, which would begin altering the broader bearish structure.

Until then, ENA remains in a base formation phase, where upside potential builds but depends entirely on sustained demand strength.


Final Summary

  • ENA holds critical demand as supply tightens, positioning price for potential structural recovery if buyers sustain pressure above resistance
  • Reclaiming $0.262 would shift sentiment, allowing price to target higher liquidity zones while weakening the prevailing bearish structure.

Domande pertinenti

QWhat was the significance of the $4.07M ENA withdrawal from Binance mentioned in the article?

AThe $4.07M ENA withdrawal from Binance coincided with persistent exchange outflows and rising buyer activity, reinforcing a tightening supply structure. It showed that tokens were leaving exchanges instead of preparing for sell pressure, which reduces the available supply on trading platforms.

QAccording to the article, what is the critical demand zone for ENA's price on the weekly chart?

AThe critical demand zone for ENA's price on the weekly chart is between $0.089 and $0.10. This level has absorbed selling pressure and marks a critical base where the price is compressing.

QWhat does the shift in Spot Taker CVD indicate about market participants?

AThe shift in Spot Taker CVD into buyer dominance indicates that market participants were actively executing buy orders rather than waiting passively. This shows buyer confidence and accumulation behavior, despite the price trading near lows.

QWhat potential effect could the dense liquidation clusters between $0.095 and $0.101 have on ENA's price?

AThe dense liquidation clusters between $0.095 and $0.101 contain significant short exposure, which could trigger forced buybacks if the price pushes upward. This could act as immediate liquidity targets and potentially cause an upward acceleration if demand sustains pressure.

QWhat key resistance level does ENA need to reclaim to begin altering its broader bearish structure?

AENA needs to reclaim the $0.262 resistance level to begin altering its broader bearish structure. This would shift sentiment and allow the price to target higher liquidity zones.

Letture associate

The Essence of AI Layoffs: Why More AI Adoption Leads to More Corporate Anxiety?

The author, awaiting potential inclusion on an 8000-person layoff list, analyzes the true nature of recent "AI-driven" layoffs. They argue that while AI use, particularly tools like Claude for code generation, has skyrocketed and boosted developer output (e.g., 2-5x more code commits), this has not translated into proportional business growth or revenue. The core issue is a misalignment between increased "Input" (code) and tangible "Outcomes" (user value, revenue). AI acts as a costly B2B SaaS, inflating operational expenses without guaranteed returns. Two key problems emerge: 1) The friction that once filtered out bad ideas is gone, as AI allows cheap pursuit of even weak concepts. 2) Organizational "alignment tax"—the difficulty of coordinating across teams—becomes crippling when development velocity outpaces consensus-building. Thus, layoffs serve two immediate purposes: 1) To offset ballooning AI costs (Token consumption) and maintain cash flow, as rising input costs without outcome growth destroys unit economics. 2) To reduce organizational bloat and alignment friction by simply removing teams, thereby speeding up execution in the short term. Therefore, these layoffs are fundamentally caused by AI, even if AI doesn't directly replace roles. They represent a painful correction until companies learn to convert AI-driven productivity into real business outcomes and streamline organizational coordination to match the new pace of work. The cycle will continue until this learning curve is mastered.

marsbit30 min fa

The Essence of AI Layoffs: Why More AI Adoption Leads to More Corporate Anxiety?

marsbit30 min fa

Can the Solana Foundation and Google's Collaboration on Pay.sh Bridge the Payment Link Between Web2 and Web3 in the Agent Economy?

Solana Foundation, in collaboration with Google Cloud, has launched Pay.sh, a payment gateway designed to bridge the gap between AI agents and enterprise-grade service infrastructure. The initiative aims to solve a key bottleneck in the "agent economy": existing payment systems are ill-suited for autonomous AI agents. Traditional methods like credit cards require human verification, while newer on-chain protocols like x402 and MPP create a separate, Web3-native system that raises barriers for service providers. Pay.sh functions as a universal payment layer. It allows users to fund a Solana wallet via credit card or stablecoin, which then acts as an identity and payment proxy for AI agents. When an agent needs to access a paid API service (e.g., Google Cloud, Alibaba Cloud), Pay.sh handles the transaction seamlessly. It leverages the HTTP 402 status code ("Payment Required") to initiate payments, intelligently choosing between one-time transfers (x402-style) or session-based authorizations (MPC-style) based on the service's billing model. This spares agents from manual account registration and API key management. A key feature for service providers is low integration effort. They can adopt Pay.sh by providing a declarative configuration file, enabling features like tiered pricing, free tiers, and automatic revenue splitting to multiple addresses (e.g., for royalties, cloud costs). Providers can also list their APIs in a central Pay Skill Registry for agent discovery. The collaboration with Google Cloud provides crucial infrastructure for API proxying, traffic routing, and compliance logging, aiming to keep agent activities within regulated boundaries. By connecting Web2 services with Web3 payment rails, Pay.sh positions the Solana wallet as a foundational identity and payment tool for AI agents, potentially driving more transaction volume to the Solana ecosystem. However, the report notes challenges. The service registry currently lacks robust vetting, risking exposure to unauthorized or malicious third-party APIs. Pay.sh also inherits security and compatibility risks from its underlying payment protocols (x402, MPC). Furthermore, adoption may be hindered by varying regional data privacy and payment compliance regulations among API providers. Despite these hurdles, Pay.sh represents a significant step towards integrating Web2 and Web3 for autonomous agent commerce.

marsbit37 min fa

Can the Solana Foundation and Google's Collaboration on Pay.sh Bridge the Payment Link Between Web2 and Web3 in the Agent Economy?

marsbit37 min fa

Bitcoin's Bull-Bear Cycle Indicator Turns Positive for the First Time in 7 Months: End of Bear Market or False Breakout?

Bitcoin's "Bull-Bear Market Cycle Indicator" from CryptoQuant has turned positive for the first time since October 2025. This gauge, based on the P&L Index relative to its 365-day moving average, suggests a potential shift from a bear market phase. Concurrently, the Bull Score Index rose to a neutral reading of 50 in late April. The indicator's move into positive territory follows a roughly 35% price rebound from a low near $60,000 in February to above $81,000. The recovery over approximately three months was faster than the 12-month period observed during the 2022 bear market. However, analysts caution against premature optimism, citing a historical precedent from March 2022. Back then, the Bull Score Index briefly hit 50, but it proved to be a false signal as Bitcoin's price subsequently plunged further. Structural differences exist in the current cycle, including consistent inflows into spot Bitcoin ETFs and an increase in large holder addresses. Yet, some models, referencing the four-year halving cycle, suggest a potential deeper bottom near $50,000 might still be possible around late 2026. In summary, while on-chain data shows marked improvement and the worst panic may be over, market participants remain cautious. A convincing trend reversal confirmation likely requires Bitcoin to sustainably break above key resistance, such as the 200-day moving average near $82,000.

marsbit44 min fa

Bitcoin's Bull-Bear Cycle Indicator Turns Positive for the First Time in 7 Months: End of Bear Market or False Breakout?

marsbit44 min fa

How to Automate Any Workflow with Claude Skills (Complete Tutorial)

This is a comprehensive guide to mastering Claude Skills, a feature for creating permanent, reusable instruction sets that automate specific workflows. Unlike simple saved prompts, Skills function like trained employees, delivering consistent, high-quality outputs by defining the entire task process, standards, error handling, and output format. The guide is structured in four phases: **Phase 1: Installation (5 minutes).** Skills are folders containing a `SKILL.md` file. The user is instructed to find a relevant Skill online, install it, test it on a real task, and compare its performance to one-off prompts. **Phase 2: Building Your First Custom Skill.** Start by rigorously defining the Skill's purpose, trigger phrases, and providing a concrete example of perfect output. The `SKILL.md` file has two parts: a YAML frontmatter with a specific name/description/triggers, and a detailed, step-by-step workflow written in natural language with examples and quality standards. **Phase 3: Testing & Optimization for Production.** Test the Skill in three scenarios: 1) a standard, common task; 2) edge cases with missing or conflicting data; and 3) a pressure test with maximum complexity. Any failure indicates a needed instruction. Implement a weekly optimization cycle to continuously refine the Skill based on real usage. **Phase 4: Building a Complete Skill Library.** The goal is to create a team of Skills for all repetitive tasks. Examples are given for industries like real estate, marketing, finance, consulting, and e-commerce. The user should list their tasks, prioritize them, and build one new Skill per week, maintaining a master document to track their library. The conclusion emphasizes the compounding time savings: ten Skills saving 30 minutes each per week reclaims over 260 hours (6.5 work weeks) per year, fundamentally transforming one's work system.

marsbit1 h fa

How to Automate Any Workflow with Claude Skills (Complete Tutorial)

marsbit1 h fa

Trading

Spot
Futures

Articoli Popolari

Come comprare 4

Benvenuto in HTX.com! Abbiamo reso l'acquisto di 4 (4) semplice e conveniente. Segui la nostra guida passo passo per intraprendere il tuo viaggio nel mondo delle criptovalute.Step 1: Crea il tuo Account HTXUsa la tua email o numero di telefono per registrarti il tuo account gratuito su HTX. Vivi un'esperienza facile e sblocca tutte le funzionalità,Crea il mio accountStep 2: Vai in Acquista crypto e seleziona il tuo metodo di pagamentoCarta di credito/debito: utilizza la tua Visa o Mastercard per acquistare immediatamente 44.Bilancio: Usa i fondi dal bilancio del tuo account HTX per fare trading senza problemi.Terze parti: abbiamo aggiunto metodi di pagamento molto utilizzati come Google Pay e Apple Pay per maggiore comodità.P2P: Fai trading direttamente con altri utenti HTX.Over-the-Counter (OTC): Offriamo servizi su misura e tassi di cambio competitivi per i trader.Step 3: Conserva 4 (4)Dopo aver acquistato 4 (4), conserva nel tuo account HTX. In alternativa, puoi inviare tramite trasferimento blockchain o scambiare per altre criptovalute.Step 4: Scambia 4 (4)Scambia facilmente 4 (4) nel mercato spot di HTX. Accedi al tuo account, seleziona la tua coppia di trading, esegui le tue operazioni e monitora in tempo reale. Offriamo un'esperienza user-friendly sia per chi ha appena iniziato che per i trader più esperti.

326 Totale visualizzazioniPubblicato il 2025.10.20Aggiornato il 2025.10.20

Come comprare 4

Discussioni

Benvenuto nella Community HTX. Qui puoi rimanere informato sugli ultimi sviluppi della piattaforma e accedere ad approfondimenti esperti sul mercato. Le opinioni degli utenti sul prezzo di 4 4 sono presentate come di seguito.

活动图片