ETH Down to $1.8K – Will It Keep Crashing and Will LiquidChain Explode in 2026?

bitcoinistPubblicato 2026-02-06Pubblicato ultima volta 2026-02-06

Introduzione

Ethereum's price has declined to around $1,800, sparking concerns of a further crash. However, the article argues this is more likely a bear trap and a consolidation phase rather than a true capitulation event. Technical analysis suggests a descending wedge pattern on the weekly chart, which historically breaks upward 68% of the time. A weekly close above $1,850 could signal a trend reversal, potentially targeting $2,500 by late 2026. The bearish narrative is countered by on-chain data showing institutional accumulation via ETFs, indicating smart money is accumulating at these levels. Concurrently, the article highlights LiquidChain ($LIQUID) as a high-beta investment opportunity poised to benefit from Ethereum's potential recovery. Positioned as a "Cross-Chain Liquidity Layer," LiquidChain aims to solve liquidity fragmentation between ecosystems like Ethereum, Bitcoin, and Solana. Its ongoing presale has raised over $529K, and it is presented as a leveraged bet on the future of multi-chain interoperability. The piece concludes that while a drop to $1,500 is possible, it would likely be a brief liquidity grab, making the current ETH price a potential generational entry point.

Trusted Editorial content, reviewed by leading industry experts and seasoned editors. Ad Disclosure

Quick Facts:

  • ➡️ Ethereum’s crash to a sub-$1,800 zone is a low-probability bear scenario; support at $1,800 is historically robust.
  • ➡️ A weekly close above $1,850 would confirm a trend reversal, targeting $2,500 by late 2026.
  • ➡️ LiquidChain solves critical liquidity fragmentation issues, offering a high-beta opportunity for investors betting on a cross-chain future.
  • ➡️ Institutional accumulation via ETFs suggests the current price action is a consolidation phase, not a distribution event.

Ethereum is currently stuck in one of its trickiest market structures since the 2022 lows.

While Bitcoin flirts with all-time highs and Solana captures the ‘retail casino’ narrative, ETH has languished in a choppy range between $1,800 and $1,900.

This stagnation has emboldened bears to call for a capitulation event down to $1,200, a level unseen since the FTX collapse. But focusing solely on price action while ignoring on-chain accumulation? That’s a classic retail trap.

The bearish thesis relies on a ‘death by a thousand cuts’ scenario: Layer 2s cannibalizing mainnet revenue, underwhelming ETF inflows, and regulatory hostility.

Yet, this pessimism ignores the massive institutional bid slowly building below $1,800. The charts aren’t signaling a crash; they’re showing high-time-frame consolidation before a violent expansion.

Smart money (who rarely buy tops) views the $1,850–$1,900 zone as a generational entry, with models pointing toward a $2,500 reclamation by mid-2026.

Why does this matter? Because volatility in the base layer often triggers explosive repricing in associated infrastructure plays. While conservative capital waits for Ethereum to confirm a trend reversal, risk-tolerant traders are already front-running the recovery.

They’re positioning in high-beta infrastructure protocols. This rotation is driving serious interest toward LiquidChain ($LIQUID), a Layer 3 solution designed to fix the liquidity fragmentation currently plaguing the ecosystem.

Check out the LiquidChain presale.

Technical Outlook: Why the Crash Narrative May Be a Bear Trap

Calls for Ethereum to revisit $1,800 are possible, sure, but structurally unlikely without a macro-black swan event.

Technically, ETH is compressing within a descending wedge pattern on the weekly timeframe. Historically? That structure breaks to the upside 68% of the time. The critical level to watch is the 50-week moving average, hovering near $1,900. A weekly close above that invalidates the bearish thesis entirely.

Fundamentally, the ‘$ETH is dying’ narrative misses the forest for the trees. While L2s have reduced mainnet burn, the upcoming Pectra upgrade (expected early 2025) should optimize the execution layer significantly.

Plus, ETH ETF flows are finally stabilizing after a tepid start.

Institutional allocators don’t buy tops; they buy peak fear. The current RSI divergence on the 3-day chart suggests seller exhaustion is near.

If the market pushes ETH down toward $1,500, expect a ‘V-shaped’ recovery as limit orders from major funds absorb the liquidity.

The Outlook:

  • Bull Case: ETH reclaims $2,000 on high volume, triggering a short squeeze to $2,500 by Q3 2026.
  • Base Case: Continued consolidation between $1,900 and $2,250 through year-end, flushing out leverage before the next leg up.
  • Bear Case (Invalidation): A weekly close below $1,700 opens the door to the dreaded $1,500 wick. However, this would likely be a ‘max pain’ liquidity grab rather than a sustained trend.

(The data points to a market that’s overly hedged to the downside, creating a powder keg for a bullish reversal.)

$LIQUID is available here.

LiquidChain Targets High Beta Upside as Smart Money Rotates

As Ethereum prepares for its next expansion phase, the biggest gains in the 2026 cycle will likely come from infrastructure layers solving ETH’s interoperability bottleneck. That’s where LiquidChain ($LIQUID) comes in. While Ethereum settles value, it remains fragmented from other liquidity hubs like Bitcoin and Solana.

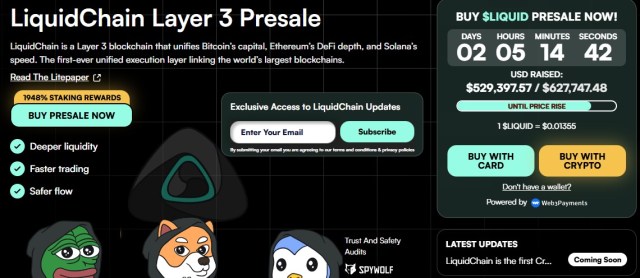
LiquidChain acts as the “Cross-Chain Liquidity Layer,” a Layer 3 infrastructure fusing these ecosystems into a single execution environment.

Investors hunting for asymmetric upside are tracking LiquidChain because it tackles the “user friction” problem hampering mass adoption.

Instead of complex bridging and wrapped assets, LiquidChain offers a unified liquidity layer where developers deploy once to access users across chains. The project is moving fast, with the official presale already raising $529K.

Don’t miss out on the ongoing presale, join the LiquidChain token sale here.

Currently priced at $0.01355, the LiquidChain token represents a high-risk, high-reward bet on the future of chain abstraction. If the ‘multichain’ thesis holds true for 2026, protocols effectively merging BTC and ETH liquidity will command a premium. Of course, early-stage infrastructure is inherently volatile.

Risks include technical execution delays and intense competition in the L3 sector. But for those betting on an ETH resurgence, LiquidChain offers a leveraged play on the ecosystem’s growth, without the diminishing returns of a mature large-cap asset.

Disclaimer: This article is for informational purposes only and does not constitute financial advice. Cryptocurrencies, especially presales and new L3 protocols, are highly volatile and carry significant risk. Always conduct your own independent research before investing.

Editorial Process for bitcoinist is centered on delivering thoroughly researched, accurate, and unbiased content. We uphold strict sourcing standards, and each page undergoes diligent review by our team of top technology experts and seasoned editors. This process ensures the integrity, relevance, and value of our content for our readers.

patrubogdan

Follow

Full Profile

Related Posts

Bitcoin’s Crash Triggered IBIT’s Biggest Trading Day, as $HYPER Keeps Pumping

Winklevoss‑Backed Gemini Cuts Up To 25% Of Staff, Exits UK, EU, And Australia

New Virginia Bill Allows the State to Invest in Bitcoin, Signaling Institutional Shift for Bitcoin Hyper

Tether Pours $150M in Gold.com as $LIQUID’s Presale Turns Heads

XRP Retests $1.29 Support: Is $2 Still in Play or Will LiquidChain Capture the Momentum?

Bitcoin Teeters on Edge: Will $60K Hold or Is a V-Shape Recovery Imminent? $HYPER Keeps Pumping

Domande pertinenti

QWhat is the current technical outlook for Ethereum's price according to the article?

AThe article states that Ethereum is compressing within a descending wedge pattern on the weekly timeframe, which historically breaks to the upside 68% of the time. A weekly close above the 50-week moving average near $1,900 would invalidate the bearish thesis. The base case is continued consolidation, with a bull case targeting $2,500 by Q3 2026.

QWhat is LiquidChain ($LIQUID) and what problem does it aim to solve?

ALiquidChain is a Layer 3 infrastructure protocol designed to act as a 'Cross-Chain Liquidity Layer.' It aims to solve the problem of liquidity fragmentation by fusing ecosystems like Ethereum, Bitcoin, and Solana into a single execution environment, eliminating the need for complex bridging and wrapped assets.

QWhat are the key risks mentioned for investing in a project like LiquidChain?

AThe key risks mentioned are that early-stage infrastructure is inherently volatile and includes potential technical execution delays and intense competition in the Layer 3 (L3) sector.

QWhat does the article suggest is the 'institutional bid' building for Ethereum?

AThe article suggests that despite bearish sentiment, a massive institutional bid is slowly building below $1,800. It states that smart money views the $1,850–$1,900 zone as a generational entry point, with major funds expected to absorb liquidity if the price drops further, viewing the current stagnation as consolidation, not distribution.

QWhat is the significance of the Pectra upgrade for Ethereum mentioned in the article?

AThe upcoming Pectra upgrade, expected in early 2025, is cited as a fundamental factor that should significantly optimize Ethereum's execution layer, countering the narrative that reduced mainnet activity from Layer 2s is a long-term negative for ETH.

Letture associate

Bitcoin Monthly Chart Adjustment Structure Established, HYPE Entry Opportunity Emerges | Exclusive Analysis

Bitcoin Monthly Correction Structure Confirmed, HYPE Entry Opportunity Emerges | Guest Analysis Last week's analysis correctly identified that the $60,000 level for Bitcoin was an intermediate point, not the bottom of the current correction. This was validated on June 5th when the price broke below this key support, dropping to around $59,100. The monthly-level a-b-c three-wave corrective structure from the October 2025 high of $126,200 is now fully established, with the market currently in the c-wave decline phase. The cumulative adjustment time is less than 35 days, indicating the structure is far from complete. This week's focus will be tracking the rebound's strength and resistance performance. The two key resistance zones of $65,000 and $69,500~$70,500 will be crucial observation points for determining the subsequent trend. For HYPE, last week's top warning signal was also validated, with the price falling up to 27% from its $75.87 high. The token has now entered a support zone, presenting a potential short-term entry opportunity. From a strategic standpoint, the medium-term outlook remains bearish, awaiting optimal timing to add short positions upon a rebound. **Key Trading Views Summary:** * **BTC:** The analysis maintains a bearish medium-term bias. Strategy involves building short positions on rebounds towards $65,000 or the $69,500~$70,500 resistance area. A break below the $59,000-$60,000 support could trigger additional short entries. Short-term trading (30% capital) focuses on range-bound opportunities. * **HYPE:** Following a confirmed correction from the $75.87 high, the short-term strategy shifts to "buying on dips." Consider light long positions (under 30%仓位) if the price finds support and shows stabilization signals in the $55-$57 or deeper $47-$49 support zones, contingent on confirming technical signals. The key resistance to watch is the $62.5-$64.57 area. **Risk Management Reminder:** Always set an initial stop-loss immediately upon opening a position. Move the stop-loss to breakeven upon achieving 1% profit, and subsequently trail it to lock in gains. Market conditions change rapidly; this analysis is for informational purposes only and not investment advice.

marsbit16 min fa

Bitcoin Monthly Chart Adjustment Structure Established, HYPE Entry Opportunity Emerges | Exclusive Analysis

marsbit16 min fa

Valuation Surpasses 200 Billion, Kimi Reportedly Raises 13.6 Billion More, Speeds Up Hong Kong IPO

Beijing-based AI unicoth MoonDark (Kimi) is reportedly in talks for a new funding round aiming to raise up to $20 billion (approximately RMB 136 billion), targeting a post-money valuation of $300 billion (approximately RMB 2.035 trillion). If successful, this would mark its third round in six months and a six-fold increase from its $43 billion valuation in December last year. Last month, the company completed a $20 billion funding round led by Meituan Longzhu, reaching a valuation exceeding $200 billion. According to reports, MoonDark has raised over RMB 376 billion across six rounds, making it the most funded large language model startup in China. Founded in 2023 by CEO Yang Zhilin, the company's core product is the Kimi AI Assistant. In April, it launched and open-sourced its flagship model, Kimi K2.6, which has demonstrated performance comparable to top models like GPT-5.4 in certain benchmarks. Recently, it began beta testing for Kimi Work, a local AI agent for knowledge workers. Commercially, the company's Annual Recurring Revenue (ARR) reportedly surpassed $2 billion in April. Regarding its IPO plans, Bloomberg reported in March that MoonDark is preparing for a listing in Hong Kong, though the process remains in early stages. The funding and IPO pace for leading Chinese AI firms has accelerated notably in 2026, mirroring global trends where companies like OpenAI and Anthropic are also setting new fundraising and valuation records. Securing substantial capital is becoming a critical factor in the competitive landscape alongside model capabilities.

marsbit19 min fa

Valuation Surpasses 200 Billion, Kimi Reportedly Raises 13.6 Billion More, Speeds Up Hong Kong IPO

marsbit19 min fa

South Korea's KOSPI Plunges 8.37% at Opening, Triggers Circuit Breaker: The 'Two Stocks' That Powered the Bull Market Recoil in a Single Day

On June 8th, South Korea's KOSPI index plunged 8.37% within minutes of market open, triggering a circuit breaker and halting trading. The crash was driven by a massive sell-off in heavyweight stocks Samsung Electronics and SK Hynix, which each fell 10%. These two chip giants alone account for over half of the KOSPI's total market capitalization and had contributed roughly 70% of the index's gains year-to-date, pushing it to become the world's sixth-largest stock market. The sell-off was ignited by negative guidance from U.S. chipmaker Broadcom on June 3rd, which sparked a global semiconductor stock rout. This shockwave hit South Korean markets on June 5th, with foreign investors leading a sustained exodus. The sharp decline on June 8th was exacerbated by high levels of retail margin debt (over 38 trillion KRW), forced liquidations, leveraged ETFs tied to the top stocks, and automated program trading, creating a vicious cycle. The Korean won also weakened significantly, further fueling foreign capital outflow. South Korean authorities issued emergency statements to calm markets, echoing recent warnings from the central bank governor about the risks of debt-driven investing. While some institutions like Goldman Sachs maintain long-term bullish targets for the KOSPI, the crash exposed the extreme market concentration and fragility behind its historic rally.

marsbit21 min fa

South Korea's KOSPI Plunges 8.37% at Opening, Triggers Circuit Breaker: The 'Two Stocks' That Powered the Bull Market Recoil in a Single Day

marsbit21 min fa

The Compounding Crisis in an Era of High Valuations: Is the US Stock Market Facing a New 'Lost Decade'?

This article analyzes the long-term structural risks in US equity markets, challenging the assumption that "time in the market" always ensures positive returns. Drawing on 155 years of historical data, it identifies three prolonged periods—1929-1954, 1966-1982, and 2000-2013—where real buy-and-hold returns were near zero or negative. Collectively, these "lost decades" represent roughly 35% of market history since 1871 and cause not just delayed wealth accumulation but permanent damage to compound growth paths due to the mathematics of recovering from significant drawdowns. Crucially, the authors argue that current conditions mirror historical precursors to such phases. Multiple valuation indicators, including the CAPE ratio (near its 99th percentile), the Buffett Indicator, and Tobin's Q, signal extreme overvaluation, historically associated with lower future 10-year real returns (averaging 3.6%). The paper debunks the common objection to tactical management—fear of missing the "best days" in the market—by showing that the vast majority of these top-performing days occur during bear markets and crises, often adjacent to the worst days. Therefore, avoiding major drawdowns inherently means missing these volatile surges. A key framework proposed involves monitoring market breadth (advance/decline data), which tends to deteriorate before major indices peak, providing an early warning signal. Combined with high valuations, breadth analysis offers a more robust risk-assessment tool. The conclusion for investors and advisors is not a forecast of an inevitable downturn, but a call to move from complacency to preparedness. The empirical evidence suggests that the conditions preceding lost decades are identifiable. A disciplined, adaptive strategy focused on valuation and breadth signals, rather than precise timing, can help protect long-term compounding from permanent impairment.

marsbit39 min fa

The Compounding Crisis in an Era of High Valuations: Is the US Stock Market Facing a New 'Lost Decade'?

marsbit39 min fa

Trading

Spot
Futures
活动图片