Original | Odaily Planet Daily (@OdailyChina)
Author | Golem (@web3_golem)

While the market focuses on OpenClaw's "Crawfish," BTC and the entire crypto market have quietly risen for a week.
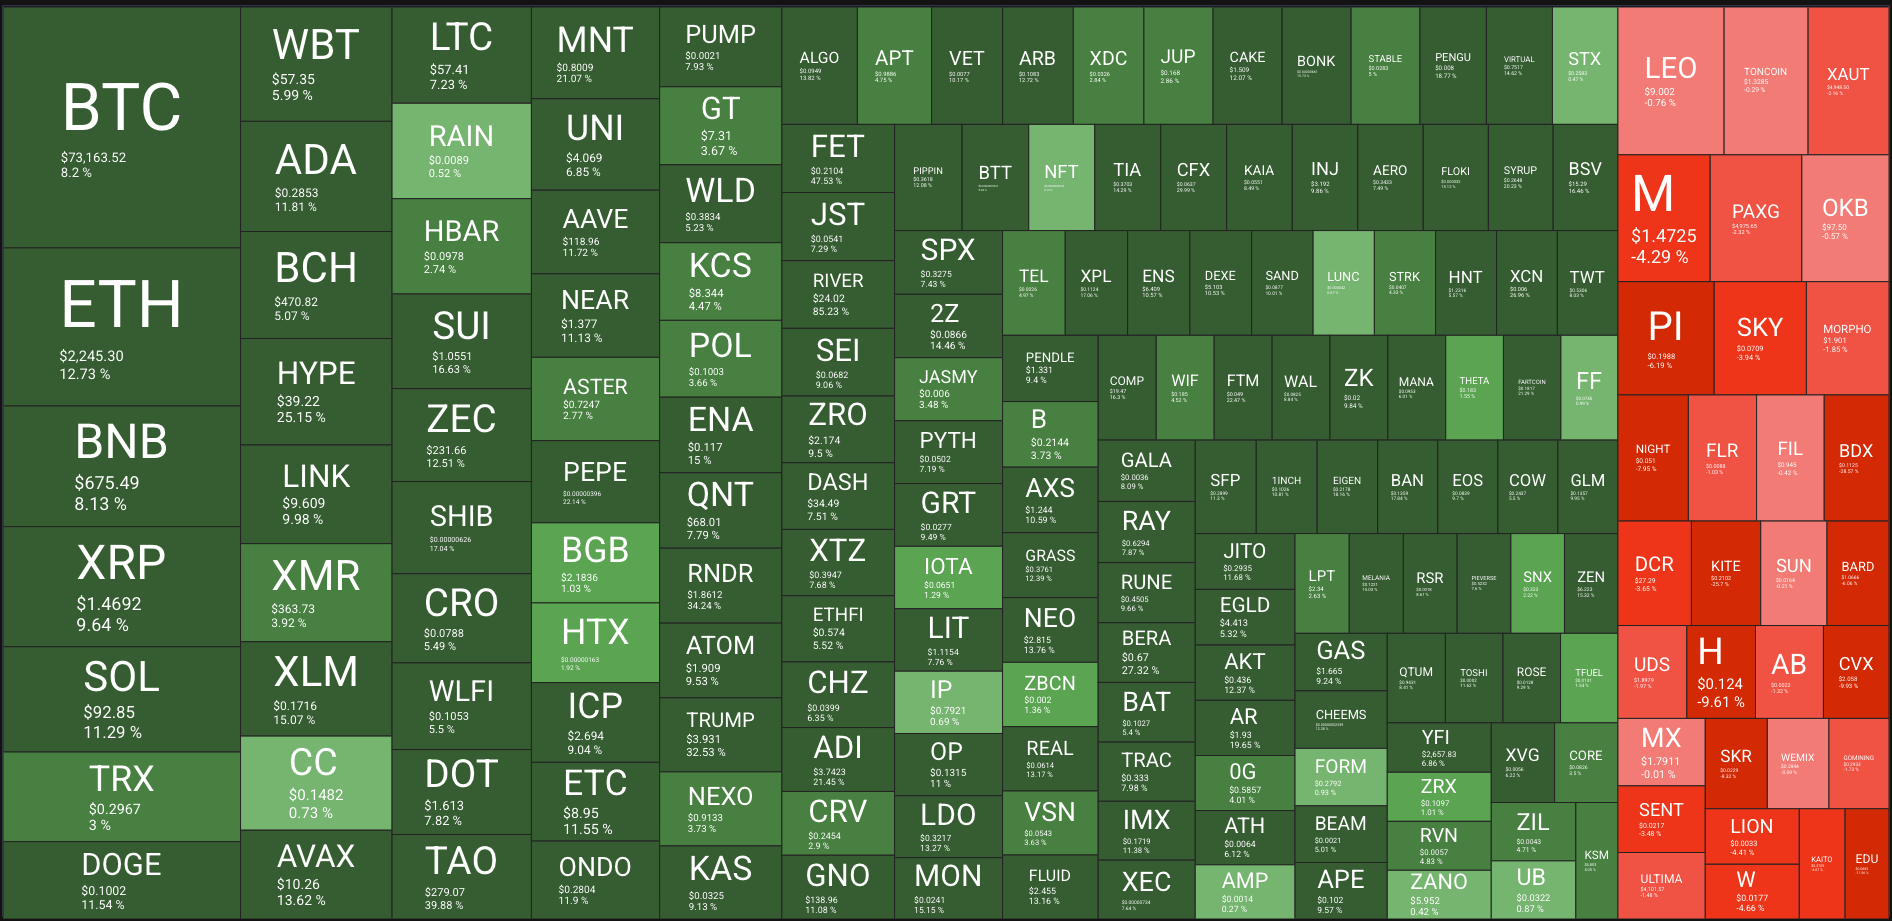
According to OKX market data, BTC has recorded eight consecutive bullish days from March 9 to March 16, successfully breaking through $74,000 and reaching a high of $74,451. The altcoin market has steadily climbed alongside the major trend, with ETH rising over 12.5% in the past 7 days, breaking $2,300; SOL up over 13% in the past 7 days; and BNB gaining over 10% in the past week. Data from Quantify Crypto shows that among the top 200 cryptocurrencies by market cap in the past week, only 31 tokens closed the week in the red, while the remaining 169 closed in the green.
The Crypto Fear and Greed Index shows that last week, the crypto panic index moved out of the extreme fear zone, currently standing at 39, nearly entering the neutral sentiment range. What factors have contributed to the improved market sentiment? What changes have occurred in crypto market liquidity? Is this rally a temporary rebound or a potential bottom confirmation? Odaily Planet Daily will provide a brief analysis in this article.
Strait of Hormuz May Reopen, Fed Expected to Hold Rates Steady This Week
On the macro level, the primary reason for the crypto market rebound was Trump's announcement on March 10 that the war with Iran was largely over, along with several measures to stabilize oil prices, such as considering exemptions for some energy sanctions to offset the Middle East shortfall and initiating a large-scale strategic petroleum reserve release plan with other countries.
As shown in the chart below, international oil prices even fell below $90/barrel on March 10. There is a negative correlation between international oil prices and Bitcoin prices, with the basic logic being that when oil prices fall, the threat of global inflation decreases, and the market anticipates that global central banks, particularly the Fed, are more likely to cut rates, injecting more liquidity into the market. Thus, Bitcoin rebounds in anticipation of this scenario.
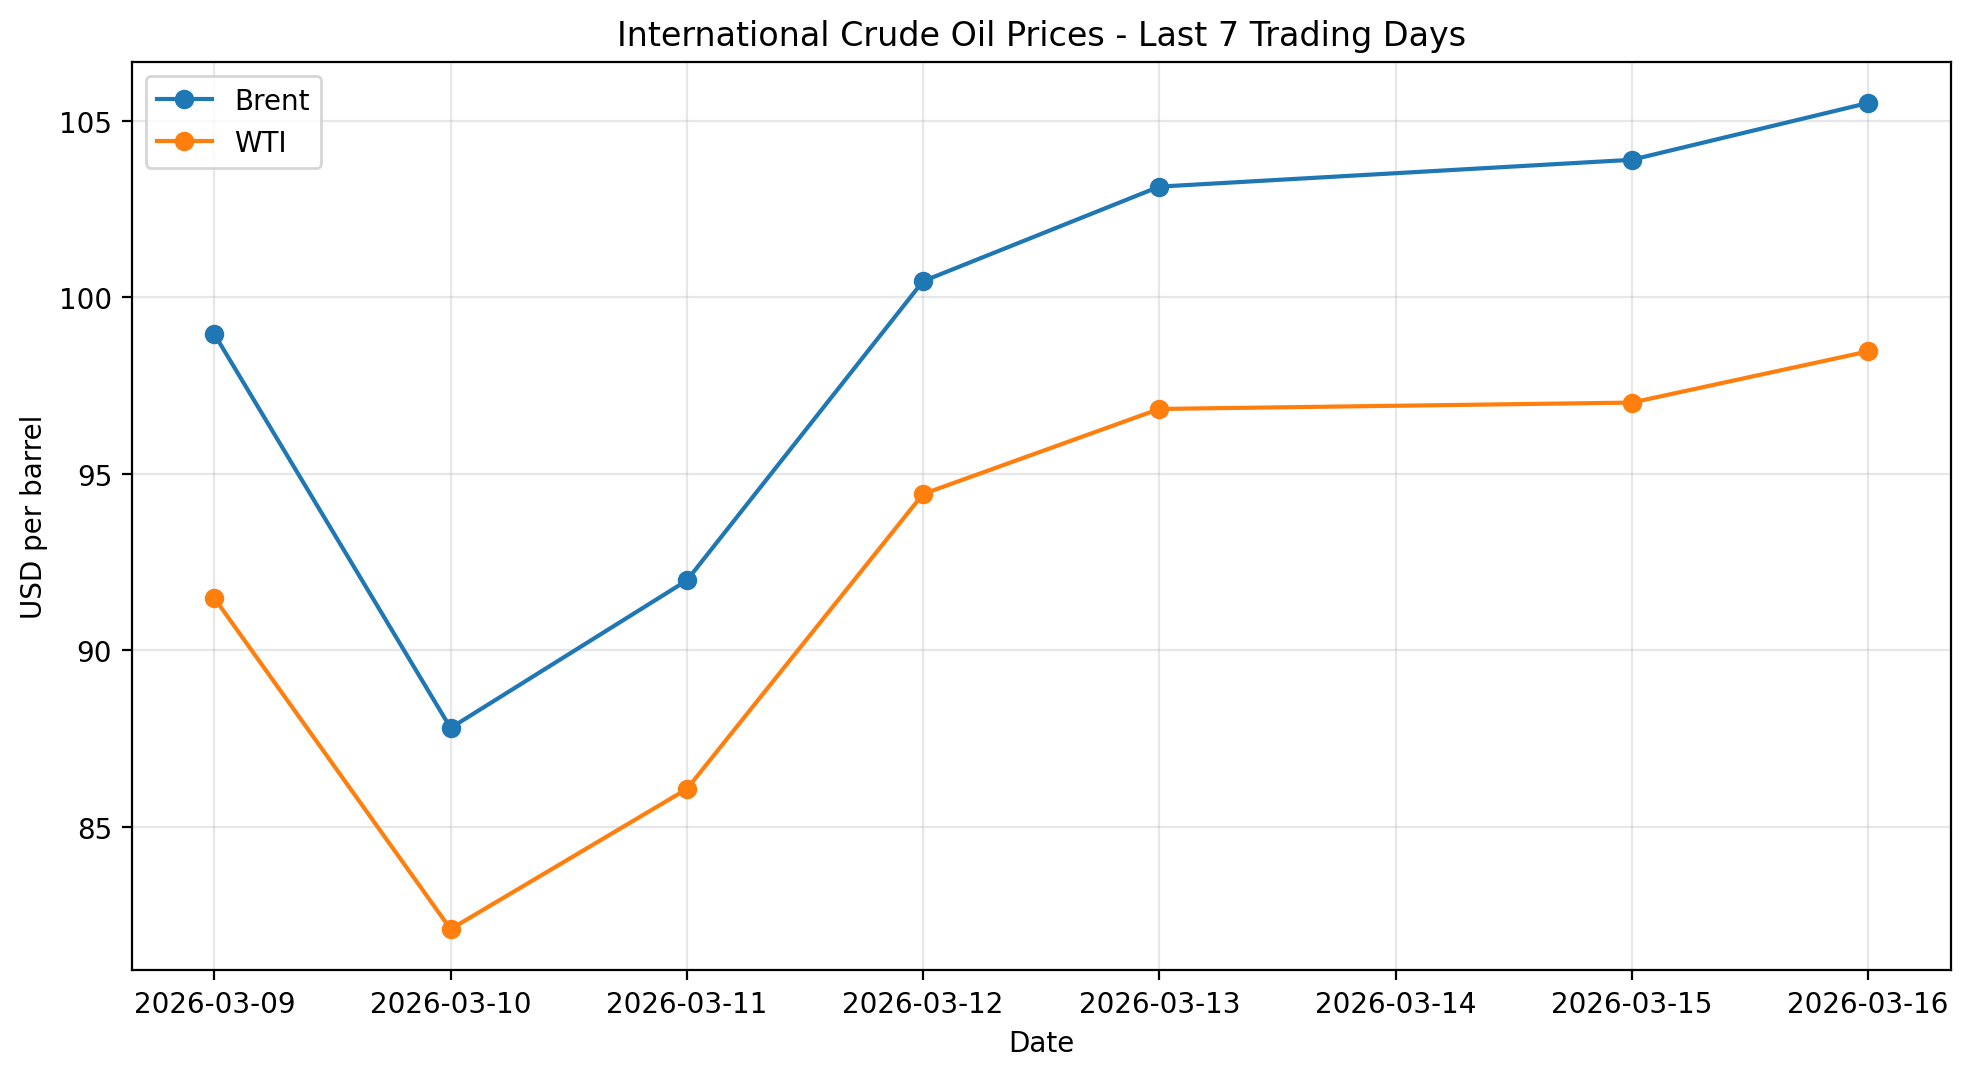
Brent Crude and WTI Crude Price Trends Over the Past Week
However, since March 10, oil prices have started to rise again, mainly due to Trump's反复无常 attitude toward the conflict, sometimes saying it might end "soon," other times vowing to strike Iran hard, even admitting he wasn't sure if he wanted a deal with Iran. Meanwhile, Iran's new Supreme Leader, Mojtaba Khamenei, vowed to close the Strait of Hormuz to enemy countries and their allies' tankers and vessels.
Fortunately, Trump is still working to prevent the closure of the Strait of Hormuz. According to an Axios report on March 16, Trump is seeking to form a multinational coalition to reopen the Strait of Hormuz and plans to announce it later this week. Four sources revealed that if the obstruction of oil tanker traffic in the Persian Gulf persists, Trump is also considering seizing Iran's key oil transit hub, Kharg Island. Located about 15 miles off the coast of Iran, Kharg Island handles about 90% of Iran's crude exports. Last Friday, Trump ordered strikes on military facilities on the island but did not target oil facilities.
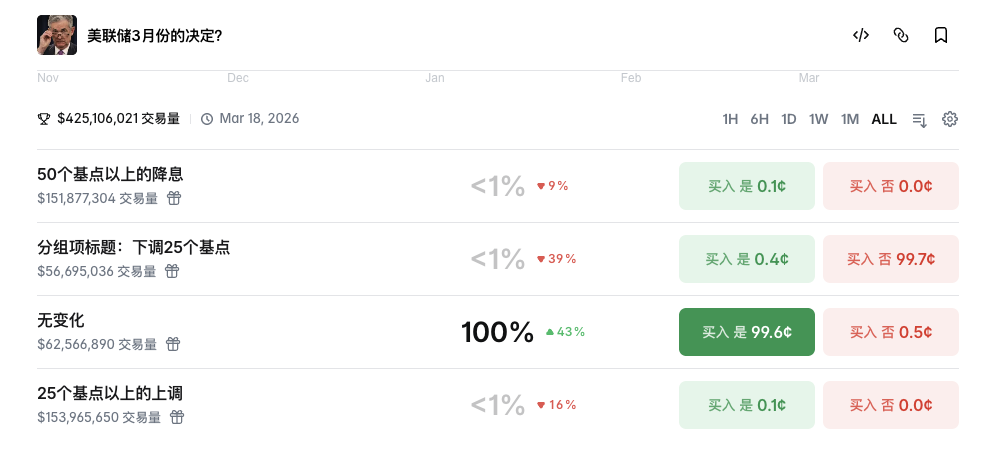
However, last week's rebound in oil prices did not cause Bitcoin to fall; instead, Bitcoin continued to rise, as the market already expected the Fed to likely keep rates unchanged at this week's meeting. According to Polymarket data, the probability of the Fed maintaining rates on March 19 is nearly 100%. CME's "FedWatch Tool" similarly shows traders believe the probability of the Fed holding rates steady is as high as 99.1%.
Although the Iran conflict and rising oil prices pose a new inflation threat to the Fed, they need time to carefully assess how much the surge in energy prices has impacted consumer prices and economic growth, and whether the impact is temporary or persistent. Therefore, amid the fog of war, "standing pat" is the best strategy.
Morgan Stanley economists stick to their forecast that the Fed will cut rates by 25 basis points each in June and September. They believe rate cuts might be delayed, meaning the Fed may have to act more aggressively later.
But investors shouldn't be blindly optimistic about rate cuts this year, as the Fed can set rates, but they can't reopen the Strait of Hormuz. The key policy decision depends on how long this conflict lasts and Trump's next move.
James Eaglehoff, Chief US Economist at BNP Paribas Securities, said he will watch whether Fed officials change their wording during this week's meeting to indicate plans to cut or raise rates in the coming months.
However, some analysts believe that the parabolic rise in Bitcoin prices amid falling oil prices is more of a short-term technical adjustment and "should not be overinterpreted."
Crypto ETFs See Three Consecutive Weeks of Net Inflows, Whales/Institutions Continue Buying
Besides macro easing, Bitcoin and other major cryptocurrencies have also seen structural buying on the capital front. On March 15, BlackRock's Head of Digital Assets stated in a live stream that although BlackRock's Bitcoin ETF was the only one among the top 20 global ETF inflows with negative returns, 90% of investors were buying the dip, indicating that Bitcoin is in a phase of intense turnover and long-term accumulation.
Data supports this claim. According to SoSoValue data, both Bitcoin spot ETFs and Ethereum spot ETFs have seen three consecutive weeks of net inflows. Bitcoin spot ETFs saw a combined net inflow of approximately $2.119 billion, while Ethereum spot ETFs saw a combined net inflow of approximately $265 million.
Moreover, Bitcoin spot ETFs recorded their first five-day streak of inflows in 2026 during last week's trading days (March 9 to March 13 ET), with total inflows of $767 million. The last similar streak was in late November 2025, when spot Bitcoin ETFs saw five consecutive days of net inflows from November 25 to December 2, totaling $284.61 million.
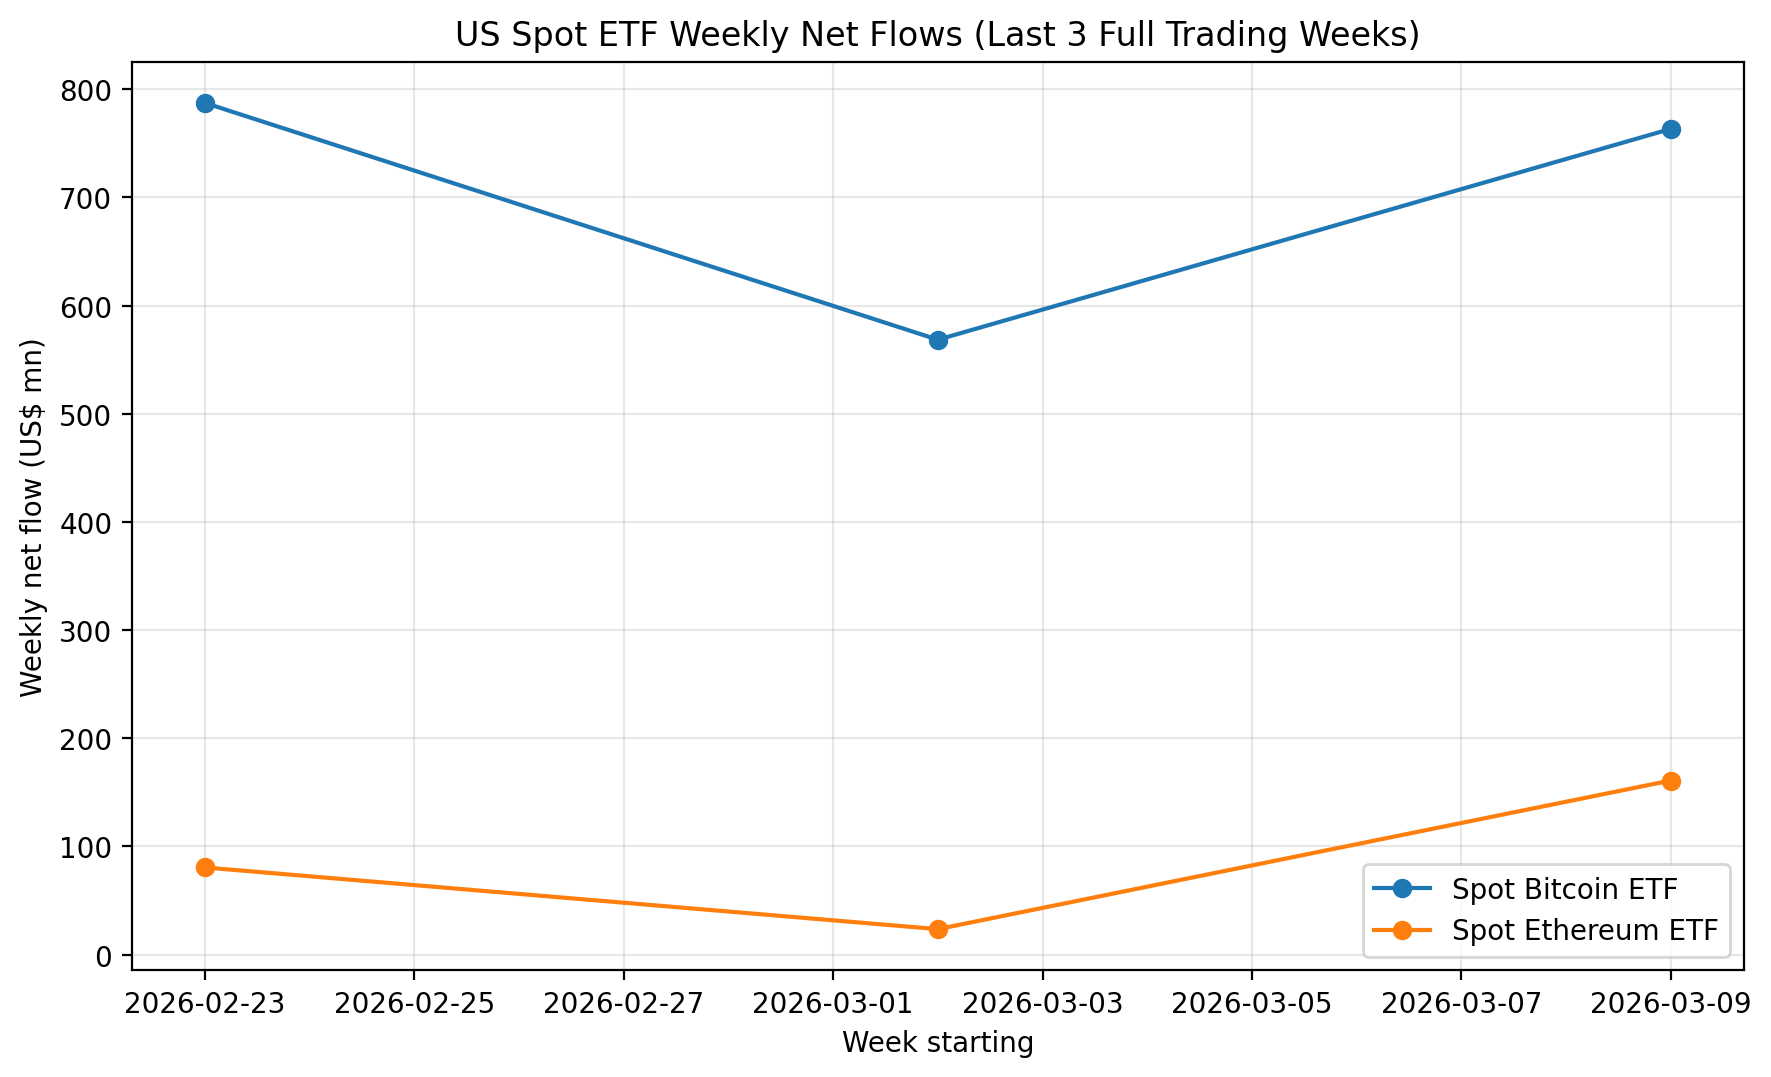
Bitcoin Spot ETFs and Ethereum Spot ETFs See Three Consecutive Weeks of Net Inflows
On-chain whales and institutions also started buying the dip last week, and besides Bitcoin, whales still prefer buying ETH.
According to Arkham monitoring, a whale accumulated $131.3 million worth of ETH last week and distributed it across two wallets; a whale address starting with 0x743d also spent $24.79 million to buy 11,985 ETH at an average price of $2,068; another dormant whale address (0x2d85) that had been inactive for six months bought 5,003 ETH at $2,179, worth $10.9 million. Notably, this address sold ETH at around $4,300 about six months ago near the peak.
Whales are still buying ETH today. Whale billΞ.eth (@0xbilly) bought 7,769 ETH at an average price of $2,248, totaling $17.46 million.
Bitcoin Bottom Confirmed, Uptrend Channel Opened?
Facing this rebound, many analysts believe Bitcoin's bottom has been confirmed.
Matrixport analysts believe that although current crypto market sentiment is weak, with many traders shifting attention to assets like gold and crude oil, Bitcoin has fallen for five consecutive months, which is rare historically, and similar moves often precede阶段性 rebounds. Meanwhile, the total market cap of altcoins has fallen back to levels from which multiple rebounds started historically. As stablecoin funds flow back into the market, liquidity conditions continue to improve. Taken together, these signals indicate that the possibility of a crypto market rebound is gradually increasing.
On-chain analysis models also show that Bitcoin's current network selling pressure has dropped to cycle lows, and the market is in a clear accumulation phase. The Sell-side Risk Ratio measures the活跃度 of profit-taking by market participants relative to the network's cost basis. When the indicator exceeds the adaptive upper threshold, it triggers a distribution signal, indicating seller dominance; when it falls below the lower threshold, it triggers an accumulation signal, meaning extremely low selling pressure.
Data shows that current selling pressure has dropped to about one-sixth of the cycle average. Meanwhile, the 180-day rolling average Sell-side Risk Ratio has dropped from 3,210 to 1,913 over the past 60 days, a decrease of 1,297 points, and continues to fall at about 20 points per day. Historically, the 1,500 to 2,000 range usually corresponds to selling pressure levels during the 2019 bear market (BTC around $3,000–$6,000) and the mid-2022–2023 bear market (BTC around $16,000–$20,000). However, the current BTC price is still in the $67,000 to $72,000 range, showing a clear structural divergence.
This means that early low-cost accumulators have completed large-scale profit-taking in the $64,000 to $107,000 range, and those who did not sell in that range are choosing to hold. Only when Bitcoin price stabilizes above $100,000 to $110,000 accompanied by large-scale profit-taking may a new distribution signal be triggered.
Therefore, many view this rally not as a short-term rebound but as a signal of a new uptrend.
A macro model combining the US 10-year Treasury yield and China's 10-year Treasury yield (US10Y×CN10Y) recently showed an "extremely precise" bullish crossover signal. Historical data shows that this indicator issued similar signals before the 2013, 2017, 2020–2021, and 2023 bull markets, corresponding to Bitcoin gains of approximately 8,700%, 1,900%, 600%, and over 350%, respectively. Analysts believe that if Bitcoin stabilizes and rebounds near the 200-week moving average, the price could test $100,000 around August. However, if it fails to break the key resistance at $78,000, there is still a risk of forming a "bull trap."
Even now, some choose to ignore short-term fluctuations and focus on Bitcoin's long-term value, like Bitwise Asset Management CIO Matt Hougan. He stated that if Bitcoin can capture a larger share of the global store of value market currently dominated by gold and government bonds, Bitcoin could eventually reach $1 million per coin.
But the $1 million target is less a precise prediction and more a shorthand for Bitcoin maturing into a global monetary asset, the outcome depending on long-term institutional adoption and the expansion of the store of value market.