
At the time of writing, Dogecoin (DOGE) is trading at approximately $0.1337, up 1.43% in the past 24 hours. While the current price shows some short-term buying interest, it continues to face selling pressure around $0.137–0.138, and the upward momentum remains limited.
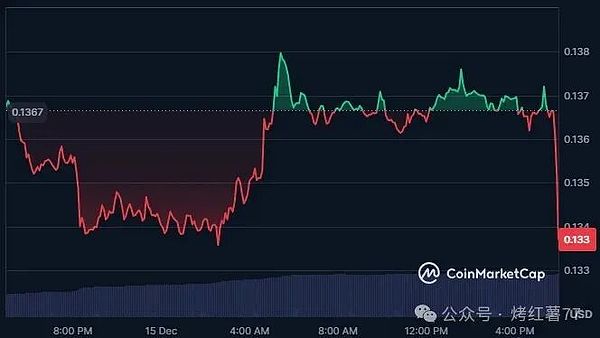
In terms of recent trends, Dogecoin has shown a clear correction pattern over the past month, with the price gradually declining from $0.162 to around $0.13, forming lower highs and lower lows during this period. The cumulative drop is approximately 20%, reflecting sustained selling pressure and weak rebound momentum.
Dogecoin's Monthly Structure Weakens, Price Falls Below $0.16
From a longer-term perspective, the monthly chart shared by renowned analyst Ali Martinez shows that Dogecoin experienced a significant pullback after hitting the key resistance zone of $0.40–0.43, marking the end of a strong upward phase and the beginning of a broader correction cycle. The price is currently consolidating around $0.14, but the monthly structure remains weak, failing to reclaim the $0.16 level, which has now turned into a key resistance.
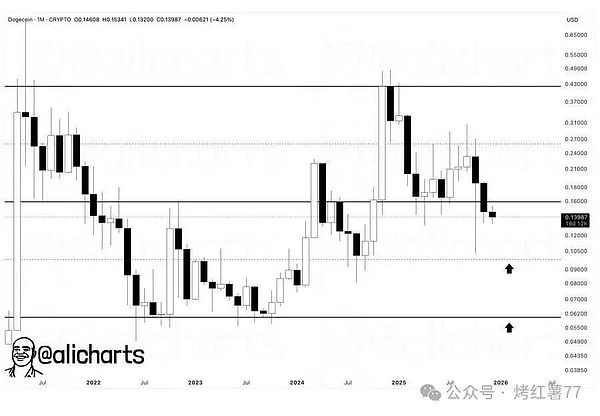
From a technical perspective, Dogecoin is at a critical juncture. To avoid further declines, it must hold the $0.12–0.10 support range. Conversely, if it remains below $0.14, it could trigger deeper selling. On the upside, if the monthly closing price can stabilize and rise above $0.16, it would be a signal of a strengthening trend and the return of buyers.
Dogecoin Holds the $0.13 Support Level, Daily Chart Shows Weak Momentum
On the daily chart, Dogecoin is currently trading around $0.136, with the overall trend still weak or in a sideways consolidation phase. The price is temporarily holding the key support area of $0.13–0.125, which has attracted buying interest multiple times in the past. The resistance above is at $0.145–0.15, a level that has consistently capped price rebounds and dominated recent trading ranges.
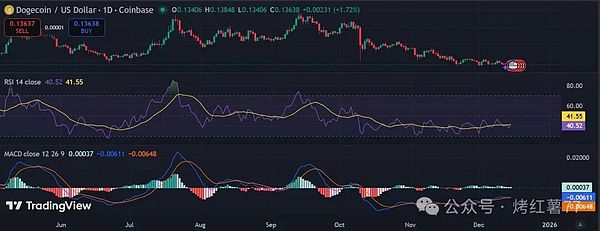
Looking at momentum indicators, the RSI (14-day) is around 40.60, indicating that the market is not severely oversold but buying momentum remains insufficient. The MACD indicator is still in negative territory, with both the signal line and the MACD line below the zero axis, reflecting that the downtrend has not yet reversed. However, the histogram is gradually flattening, suggesting that downward momentum may be weakening.