Dogecoin Price Just Entered A Critical Level, But Analyst Says It’s Not Time To Buy

bitcoinistPubblicato 2026-06-04Pubblicato ultima volta 2026-06-04

Introduzione

Dogecoin has returned to a major long-term level on its monthly chart, entering what analyst Trader Tardigrade identifies as a critical resistance zone. Historically, this zone within a massive descending broadening channel has seen only two visits in the past decade—in 2017 and 2020—each followed by a strong rejection and deep correction. The coin has already dropped 8% after testing this area. Crucially, the analyst's chart is inverted; the "resistance" line is actually a bullish support line on a normal price chart. Past rejections from this line preceded major rallies. Therefore, the current price action near $0.0937 is viewed as a return to support, with potential for an upward bounce. A move above $0.10 could signal improving sentiment, while a break above $0.25 would confirm a bounce from support. The inverted chart structure even suggests room for significant upside toward double-digit targets.

Dogecoin has returned to a major long-term level on the monthly chart, setting up another important test for the meme coin after months of weak price action.

The setup was initially noted by crypto analyst Trader Tardigrade on X, who argued that DOGE is now sitting at a critical resistance zone where previous rallies have failed. Dogecoin has visited this price zone only twice in the past decade, and each visit ended the same way.

The Pattern That Has Defined DOGE Since 2015

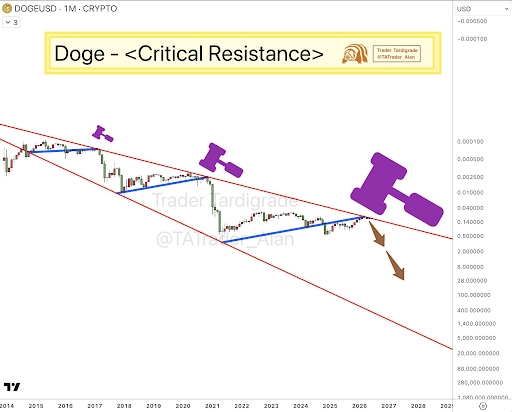
Trader Tardigrade’s long-term Dogecoin chart shows DOGE trading inside a massive descending broadening channel that has shaped price action for years. This channel has shaped Dogecoin’s price action for over a decade now, with two clearly defined red trendlines that widen progressively as time passes.

As shown in the chart below, Dogecoin previously rallied into the upper resistance of this channel in 2017 and in 2020, and both moves ended with strong rejections followed by deep corrections. Now, in 2026, Dogecoin has returned to that same overhead structure for a third time and looks like it is about to reject again. As noted by Trader Tardigrade, this is where we dump Dogecoin.
Source: Chart from Trader Tardigrade on X

Dogecoin has already dropped by 8% over the last three days, a decline that came shortly after DOGE tested that major resistance area, making the pattern a strong warning.

Real Message Behind The Inverted Chart

Trader Tardigrade’s chart presents DOGE/USD on the monthly timeframe, but the price scale is flipped. This means the lower the chart moves, the higher Dogecoin is actually moving in normal market price. Therefore, the red descending line labeled as critical resistance is not a bearish ceiling in the conventional sense, but a bullish line on an inverted chart, and a rejection from it sends the price directly into an upward movement in real terms.

In each of the two previous cases, the 2017 cycle and the 2021 cycle, a rejection from that inverted resistance was followed by a large move downward on the inverted chart, meaning a large rally upward on the normal DOGE chart.

Therefore, the current price action should be looked at as a return to support instead, and the analyst is expecting a bounce to higher price levels. Dogecoin is currently trading at $0.0937, which places it squarely within a support range between $0.09 and $0.10.

A move above $0.10 and into the $0.15 to $0.18 range would be the first indication that sentiment around DOGE is beginning to improve. However, the stronger signal would come from a break above $0.25, as that would make it clearer that DOGE is bouncing from the support structure.

Interestingly, the inverted chart’s structure leaves room for a move into double-digit price targets before Dogecoin reaches the next major trendline.

DOGE trading at $0.09 on the 1D chart | Source: DOGEUSDT on Tradingview.com

Domande pertinenti

QWhat is the critical level that Dogecoin price has just entered, and how significant is it according to the article?

ADogecoin has returned to a major long-term resistance level on the monthly chart, which is a critical price zone it has only visited twice in the past decade. Both previous visits resulted in strong rejections followed by deep corrections, making this level highly significant and a crucial test for DOGE's current price action.

QWho is the analyst mentioned in the article, and what is their key observation about Dogecoin's current chart pattern?

AThe analyst mentioned is Trader Tardigrade on X. Their key observation is that Dogecoin is trading inside a massive descending broadening channel that has shaped its price action for years. DOGE is now testing the upper resistance of this channel for the third time, a zone where previous rallies in 2017 and 2021 failed.

QWhat is unusual about the chart presented by Trader Tardigrade, and how does it change the interpretation of the 'resistance' level?

AThe chart presents DOGE/USD on a monthly timeframe with an inverted price scale. This means the 'descending resistance' line is actually a bullish line on the inverted chart. A rejection from this line on the inverted chart signals a large upward movement for DOGE's actual price. Therefore, the critical level should be viewed as a support zone for a potential price bounce.

QBased on the inverted chart analysis, what price movement is expected for Dogecoin from its current level?

ABased on the inverted chart analysis, a rejection from the 'resistance' (which acts as support on the inverted chart) is expected to lead to a bounce to higher price levels. The analyst anticipates a move upward, with key levels to watch being a break above $0.10, then the $0.15 to $0.18 range, and a stronger signal coming from a break above $0.25.

QWhat is Dogecoin's current price and the key support range mentioned in the article?

ADogecoin is currently trading at $0.0937. The key support range mentioned is between $0.09 and $0.10.

Letture associate

human.tech Launches Clean SDK for Privacy-First Web3 Apps

human.tech has launched the Clean SDK, a toolkit enabling developers to build privacy-first Web3 applications with transparent accountability. Released alongside Aztec's version 5, the SDK provides components for integrating zero-knowledge identity verification, sanctions screening, and private transactions, without developers handling sensitive user data or building compliance infrastructure from scratch. It uses zero-knowledge proofs and programmable verification to allow apps to confirm user legitimacy and sanctions compliance while keeping identities confidential. The first application built on the SDK, Shield, a privacy bridge to Aztec, also launched. It allows users to transfer assets privately while proving a unique human is behind each transfer and that funds have passed sanctions checks, as verified by a May 2026 audit. The SDK offers three core verification techniques: Proof of Innocence (sanctions screening against 23 sources), Proof of Personhood (simpler verification via Human Passport), and Proof of Clean Hands (higher-assurance zero-knowledge government ID checks). This allows apps to authenticate users and transactions without exposing personal data. Designed for Aztec builders, the SDK lets developers add programmable privacy to decentralized apps, eliminating the need to create their own verification and ZK infrastructure. Shield demonstrates its practical use for private bridges, but the SDK aims to enable a wider ecosystem of private, accountable financial apps and services. The launch addresses growing demand for infrastructure that balances privacy and accountability. The SDK avoids traditional identity databases, storing encrypted data off-chain, screening at both entry and exit points, and including a gated disclosure mechanism for legal requests. human.tech's products, including the Clean SDK, focus on using zero-knowledge technology to enable verifiable personhood and privacy in digital systems.

TheNewsCrypto11 min fa

human.tech Launches Clean SDK for Privacy-First Web3 Apps

TheNewsCrypto11 min fa

Unlocking $100 Million in Liquidity? Pump.fun's New Policy Tests the 5-Minute Pump Technique

Pump.fun, a popular meme coin launchpad, has introduced a new standard mechanism called BOOST. It aims to address a significant capital efficiency issue: when a newly launched token graduates from its initial bonding curve to a liquidity pool (LP), roughly 20% of its liquidity becomes permanently locked as "dead liquidity," estimated to waste over $100 million annually. Instead of locking these funds permanently, BOOST repurposes them. Upon a token's migration, approximately 20% of the settlement funds (e.g., 17.6 SOL or ~$2516 USDC) are used to buy back the token on the open market over a 5-minute period via a Time-Weighted Average Price (TWAP) mechanism. All purchased tokens are immediately burned. This creates a brief, systematic buy pressure immediately after migration, potentially generating a short-term price surge ("pump") while permanently reducing the token's circulating supply. The goal is to enhance the immediate post-launch trading experience, potentially increasing trader retention and sustainable protocol revenue, which funds ongoing token buybacks. However, concerns exist that this artificial 5-minute boost could lower the barrier for launching low-quality tokens and lead to steeper price crashes once the buy pressure stops, if followed by large sell-offs. The feature automatically applies to tokens migrating after July 21, 2024, but not to previously migrated tokens or those launched via the Mayhem AI Agent lab.

marsbit18 min fa

Unlocking $100 Million in Liquidity? Pump.fun's New Policy Tests the 5-Minute Pump Technique

marsbit18 min fa

Podcast Notes | Conversation with GSR Asset Management Head: To Determine if This Crypto Rally is Real, Just Watch the Lending Rates on Aave

Podcast Summary: Dialogue with GSR's Head of Asset Management: To Determine if This Crypto Rally is Real, Just Check Lending Rates on Aave Andy Baehr, Managing Director of Asset Management at GSR, discusses the current crypto market, characterizing it as stuck in a state of "ambivalence" with short-lived, unsustainable rallies. He outlines a simple framework: the market moves between "ambivalence" and "conviction" (sustained upward momentum). Currently, every rally resembles a single-stage rocket booster that quickly fizzles out. Baehr identifies three key signals to watch: 1) DeFi lending rates, 2) the potential passage of the CLARITY Act, and 3) the market forming a consensus on the "Fed hawkish peak." He emphasizes that the most immediate indicator for the sustainability of the recent CPI-triggered rally is the USDC borrowing rate on Aave, currently around 3.75%—close to U.S. Treasury yields. The absence of a credit spread indicates low leverage demand and a lack of market energy. He explains that a healthy, sustained rally requires layered buying pressure. Last year's rally progressed from an ETH short squeeze to crypto-native trader influx and finally to ETF inflows. Currently, this structure is missing. Other potential structural buyers like Digital Asset Treasury (DAT) companies are absent, and ETF flows have proven transient. Baehr notes that while small-cap crypto tokens outperformed large caps in Q2—a potential sign of capitation in major assets—capital is also flowing to more exciting opportunities like AI stocks and tech IPOs, leaving crypto sidelined. Regarding DeFi, he highlights that platforms like Aave provide a clear, real-time signal of leverage demand through their supply/demand-driven interest rates. A significant, sustained rate increase would signal genuine market conviction. He also observes the quiet emergence of fixed-income-like products and vaults in DeFi. On regulation, the probability of the CLARITY Act passing before the August 7th deadline has dropped linearly from 75% to below 40% on Polymarket. Baehr suggests its passage would be treated as a bullish surprise, a potent driver for price movement. However, political hurdles, including ethical clause debates and disclosures about the First Family's crypto profits, remain significant obstacles. Ultimately, the market awaits clarity on the Fed's terminal rate under Chair Warsh. Until the "Fed Solstice"—the point where the market collectively understands the peak of hawkish policy—sustained conviction will be difficult to achieve.

marsbit49 min fa

Podcast Notes | Conversation with GSR Asset Management Head: To Determine if This Crypto Rally is Real, Just Watch the Lending Rates on Aave

marsbit49 min fa

Trading

Spot
活动图片