Dogecoin: Assessing if DOGE’s $0.088 bounce can hold as whales sell

ambcryptoPubblicato 2026-03-05Pubblicato ultima volta 2026-03-05

Introduzione

Dogecoin (DOGE) recently fell below the $0.09 support level, hitting a low of $0.088 before rebounding slightly to $0.092. The broader crypto market shows reduced capital flow, with retail investors largely inactive and staying on the sidelines. Meanwhile, whale activity has increased, with significant sell orders executed around $0.089–$0.093. Despite a short-term rise in buy volume, the market structure remains bearish. The RSI, though improving, is still in bearish territory, and DOGE trades below its Parabolic SAR. To avoid further decline, DOGE must reclaim $0.103; otherwise, it risks falling toward $0.079 support.

Dogecoin has been under extreme bearish pressure since it fell below the $0.1 level. Amid this downward spiral, DOGE broke below the $0.09 support level and fell to a low of $0.088 before rebounding slightly.

At press time, the memecoin traded at $0.092, up 2.56% on the daily charts, indicating the memecoins’ heightened volatility.

Dogecoin retail activity dries up

The broader crypto market saw reduced capital flows, and memecoin tokens, especially Dogecoin [DOGE], suffered the most.

With investors taking a step back, amid dominating risk-off sentiment, small-scale investors have almost abandoned the market entirely.

Spot Retail Activity metrics from CryptoQuant showed no notable retail trading activity. The metric currently sits at neutral levels, indicating that retail traders have shown little excitement or panic.

The cohort sat on the sidelines as of press time, potentially waiting for suitable market conditions either to dump or purchase.

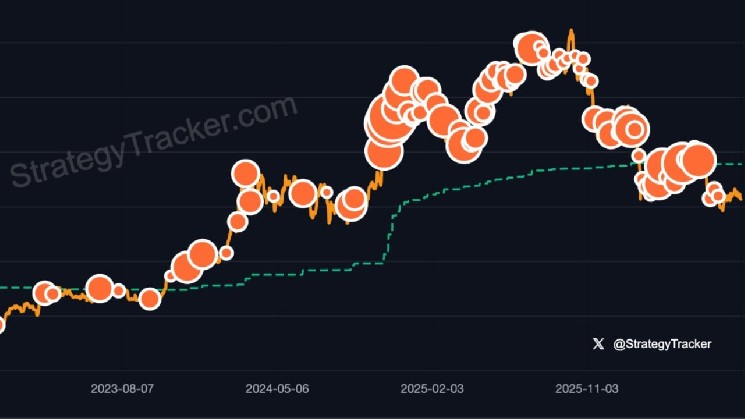
The same market sentiment is evident in the Spot Volume Bubble Map. The metrics remain within the neutral zone, suggesting the market lacks significant upside or downside momentum.

These conditions leave the market prone to high volatility, depending on any significant moves made by market participants.

On top of that, while retail activity has dried up in the market, whales are left to roam freely, and long-term whales have increased spending significantly. Since DOGE fell below $0.1, whales have remained relatively active.

Spot Average Order Size data showed an increase in whale orders executed at $0.089. $0.093 and $0.091, and most of these orders have been the sell side.

With whales active on the sell side and retail investors silent, the market remains weak, increasing the chances of a further price drop.

Is all lost for DOGE?

Dogecoin rebounded from a $0.088 slip as buyers stepped in and bought the dip, lifting the memecoin to $0.092. In fact, the Buy Volume rose to 304 million, compared with 263 million in the Sell Volume.

The demand boosted the price performance of memecoins. Despite this short-term pump, the market remained structurally bearish.

The Relative Strength Index (RSI) made a bullish move, rising to 34, but it still remained deeply within the bearish zone, almost oversold. Likewise, DOGE held below its Parabolic SAR, further validating this weakened market structure.

Such market conditions suggested that Dogecoins are most likely to see a prolonged period of weakness. To avoid this fate, the memecoin needs to reclaim and flip its SAR at $0.103.

However, if the buy pressure on daily timeframes slows, DOGE could attempt to slip below $0.08, with $0.079 acting as key support.


Final Summary

  • Dogecoin breached $0.09 support and fell to a low of $0.88 before rebounding to $0.092.
  • DOGE retail investors have taken a step back from the market, amid a prolonged stay below $0.1.

Domande pertinenti

QWhat was the key support level that Dogecoin broke below before falling to $0.088?

ADogecoin broke below the $0.09 support level before falling to a low of $0.088.

QAccording to the article, what does the neutral level of Spot Retail Activity metrics indicate about retail traders?

AThe neutral level indicates that retail traders have shown little excitement or panic and are sitting on the sidelines.

QWhat is the primary activity of Dogecoin whales as the price fell below $0.1, according to the Spot Average Order Size data?

AThe Spot Average Order Size data showed that whales have been active on the sell side, with increased spending and most orders being sell orders.

QWhat two key technical indicators are mentioned that suggest DOGE's market structure remains bearish despite the recent bounce?

AThe Relative Strength Index (RSI) remains deeply within the bearish zone, and the price is held below the Parabolic SAR, both indicating a weakened market structure.

QWhat price level does the article state that Dogecoin needs to reclaim to potentially avoid a prolonged period of weakness?

AThe article states that Dogecoin needs to reclaim and flip its Parabolic SAR at $0.103 to avoid a prolonged period of weakness.

Letture associate

The Essence of AI Layoffs: Why More AI Adoption Leads to More Corporate Anxiety?

The author, awaiting potential inclusion on an 8000-person layoff list, analyzes the true nature of recent "AI-driven" layoffs. They argue that while AI use, particularly tools like Claude for code generation, has skyrocketed and boosted developer output (e.g., 2-5x more code commits), this has not translated into proportional business growth or revenue. The core issue is a misalignment between increased "Input" (code) and tangible "Outcomes" (user value, revenue). AI acts as a costly B2B SaaS, inflating operational expenses without guaranteed returns. Two key problems emerge: 1) The friction that once filtered out bad ideas is gone, as AI allows cheap pursuit of even weak concepts. 2) Organizational "alignment tax"—the difficulty of coordinating across teams—becomes crippling when development velocity outpaces consensus-building. Thus, layoffs serve two immediate purposes: 1) To offset ballooning AI costs (Token consumption) and maintain cash flow, as rising input costs without outcome growth destroys unit economics. 2) To reduce organizational bloat and alignment friction by simply removing teams, thereby speeding up execution in the short term. Therefore, these layoffs are fundamentally caused by AI, even if AI doesn't directly replace roles. They represent a painful correction until companies learn to convert AI-driven productivity into real business outcomes and streamline organizational coordination to match the new pace of work. The cycle will continue until this learning curve is mastered.

marsbit31 min fa

The Essence of AI Layoffs: Why More AI Adoption Leads to More Corporate Anxiety?

marsbit31 min fa

Can the Solana Foundation and Google's Collaboration on Pay.sh Bridge the Payment Link Between Web2 and Web3 in the Agent Economy?

Solana Foundation, in collaboration with Google Cloud, has launched Pay.sh, a payment gateway designed to bridge the gap between AI agents and enterprise-grade service infrastructure. The initiative aims to solve a key bottleneck in the "agent economy": existing payment systems are ill-suited for autonomous AI agents. Traditional methods like credit cards require human verification, while newer on-chain protocols like x402 and MPP create a separate, Web3-native system that raises barriers for service providers. Pay.sh functions as a universal payment layer. It allows users to fund a Solana wallet via credit card or stablecoin, which then acts as an identity and payment proxy for AI agents. When an agent needs to access a paid API service (e.g., Google Cloud, Alibaba Cloud), Pay.sh handles the transaction seamlessly. It leverages the HTTP 402 status code ("Payment Required") to initiate payments, intelligently choosing between one-time transfers (x402-style) or session-based authorizations (MPC-style) based on the service's billing model. This spares agents from manual account registration and API key management. A key feature for service providers is low integration effort. They can adopt Pay.sh by providing a declarative configuration file, enabling features like tiered pricing, free tiers, and automatic revenue splitting to multiple addresses (e.g., for royalties, cloud costs). Providers can also list their APIs in a central Pay Skill Registry for agent discovery. The collaboration with Google Cloud provides crucial infrastructure for API proxying, traffic routing, and compliance logging, aiming to keep agent activities within regulated boundaries. By connecting Web2 services with Web3 payment rails, Pay.sh positions the Solana wallet as a foundational identity and payment tool for AI agents, potentially driving more transaction volume to the Solana ecosystem. However, the report notes challenges. The service registry currently lacks robust vetting, risking exposure to unauthorized or malicious third-party APIs. Pay.sh also inherits security and compatibility risks from its underlying payment protocols (x402, MPC). Furthermore, adoption may be hindered by varying regional data privacy and payment compliance regulations among API providers. Despite these hurdles, Pay.sh represents a significant step towards integrating Web2 and Web3 for autonomous agent commerce.

marsbit38 min fa

Can the Solana Foundation and Google's Collaboration on Pay.sh Bridge the Payment Link Between Web2 and Web3 in the Agent Economy?

marsbit38 min fa

Bitcoin's Bull-Bear Cycle Indicator Turns Positive for the First Time in 7 Months: End of Bear Market or False Breakout?

Bitcoin's "Bull-Bear Market Cycle Indicator" from CryptoQuant has turned positive for the first time since October 2025. This gauge, based on the P&L Index relative to its 365-day moving average, suggests a potential shift from a bear market phase. Concurrently, the Bull Score Index rose to a neutral reading of 50 in late April. The indicator's move into positive territory follows a roughly 35% price rebound from a low near $60,000 in February to above $81,000. The recovery over approximately three months was faster than the 12-month period observed during the 2022 bear market. However, analysts caution against premature optimism, citing a historical precedent from March 2022. Back then, the Bull Score Index briefly hit 50, but it proved to be a false signal as Bitcoin's price subsequently plunged further. Structural differences exist in the current cycle, including consistent inflows into spot Bitcoin ETFs and an increase in large holder addresses. Yet, some models, referencing the four-year halving cycle, suggest a potential deeper bottom near $50,000 might still be possible around late 2026. In summary, while on-chain data shows marked improvement and the worst panic may be over, market participants remain cautious. A convincing trend reversal confirmation likely requires Bitcoin to sustainably break above key resistance, such as the 200-day moving average near $82,000.

marsbit45 min fa

Bitcoin's Bull-Bear Cycle Indicator Turns Positive for the First Time in 7 Months: End of Bear Market or False Breakout?

marsbit45 min fa

How to Automate Any Workflow with Claude Skills (Complete Tutorial)

This is a comprehensive guide to mastering Claude Skills, a feature for creating permanent, reusable instruction sets that automate specific workflows. Unlike simple saved prompts, Skills function like trained employees, delivering consistent, high-quality outputs by defining the entire task process, standards, error handling, and output format. The guide is structured in four phases: **Phase 1: Installation (5 minutes).** Skills are folders containing a `SKILL.md` file. The user is instructed to find a relevant Skill online, install it, test it on a real task, and compare its performance to one-off prompts. **Phase 2: Building Your First Custom Skill.** Start by rigorously defining the Skill's purpose, trigger phrases, and providing a concrete example of perfect output. The `SKILL.md` file has two parts: a YAML frontmatter with a specific name/description/triggers, and a detailed, step-by-step workflow written in natural language with examples and quality standards. **Phase 3: Testing & Optimization for Production.** Test the Skill in three scenarios: 1) a standard, common task; 2) edge cases with missing or conflicting data; and 3) a pressure test with maximum complexity. Any failure indicates a needed instruction. Implement a weekly optimization cycle to continuously refine the Skill based on real usage. **Phase 4: Building a Complete Skill Library.** The goal is to create a team of Skills for all repetitive tasks. Examples are given for industries like real estate, marketing, finance, consulting, and e-commerce. The user should list their tasks, prioritize them, and build one new Skill per week, maintaining a master document to track their library. The conclusion emphasizes the compounding time savings: ten Skills saving 30 minutes each per week reclaims over 260 hours (6.5 work weeks) per year, fundamentally transforming one's work system.

marsbit1 h fa

How to Automate Any Workflow with Claude Skills (Complete Tutorial)

marsbit1 h fa

Trading

Spot
Futures
活动图片