Author: Dolphin Research
On May 11th Eastern Time before the market opened, Circle, the top stablecoin stock, released its first-quarter 2026 earnings.
It is important to clarify that since the scale of USDC and the interest rates on reserve assets are publicly known, about 95% of interest income is essentially predetermined. Therefore, most of the time, Circle's stock price fluctuations follow changes in USDC market capitalization, which are fundamentally tied to factors like expectations for interest rate cuts and changes in crypto asset policies.
The unexpected information that can be interpreted from the earnings report lies in other non-interest income, the company's internal operational efficiency, and the medium to long-term strategic goals reflected in the guidance.
Overall, the highlight of the first quarter remains on "Other Revenue," which the market primarily focuses on in the earnings report, reflecting the steady expansion trend of the USDC ecosystem beyond cryptocurrency scenarios. However, the rigid investments required for this ecosystem expansion will also bring significant volatility and pressure to Circle's short-term profitability.
Details are as follows:
1. Ecosystem Layout: Same Old Script, Crypto Investments Under Pressure, New Scenarios Continue to Expand
(1) Average USDC circulation in Q1 was $75.2 billion. After hitting a bottom in February, it slowly climbed to nearly $77 billion by the end of the quarter despite unfavorable geopolitical frictions, up 2% quarter-over-quarter, similar to last quarter. Newly minted USDC in the quarter was $73 billion, down sequentially, affected by the dismal crypto asset market performance in Q1. However, excluding this impact, minting volume remained at a high level, reflecting the expansion of demand scenarios beyond crypto asset investments.
Meanwhile, redemptions were $72 billion, with faster year-over-year growth, reflecting some users cashing out profits or shifting to other interest-bearing products amid pressure in the crypto asset market.
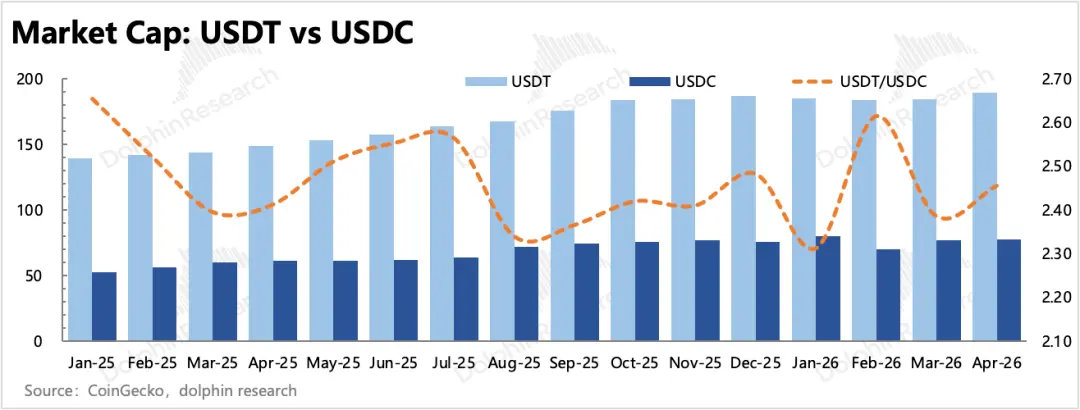
The ratio of competitor USDT's scale to USDC fell in January but quickly recovered in the following two months. Therefore, from a competitive perspective, USDT still poses a significant competitive threat. After the Drift hacking incident in April, public sentiment turned against Circle, while Tether actively provided real financial assistance to Drift, causing Circle to lose some customers.
We are still in the early stages of growing the overall stablecoin pie, so competition is not yet a major factor affecting USDC's growth.
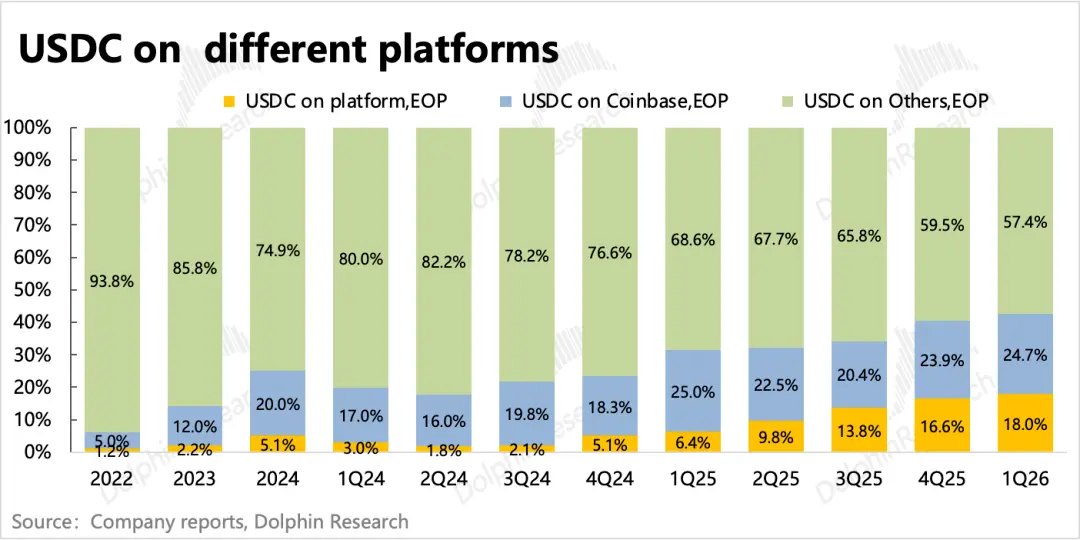
(2) Distribution within the USDC ecosystem: The share held within Circle increased further to 18%, with the average daily retention ratio also at 17.2%. Over the past year, this has increased quarter by quarter from 6% to the current level. At the same time, the external sharing ratio of reserve interest income decreased slightly by 1 percentage point, with potential for further optimization to enhance profitability.Coinbase accounted for nearly 25%, showing a trend of active retention compared to last quarter.
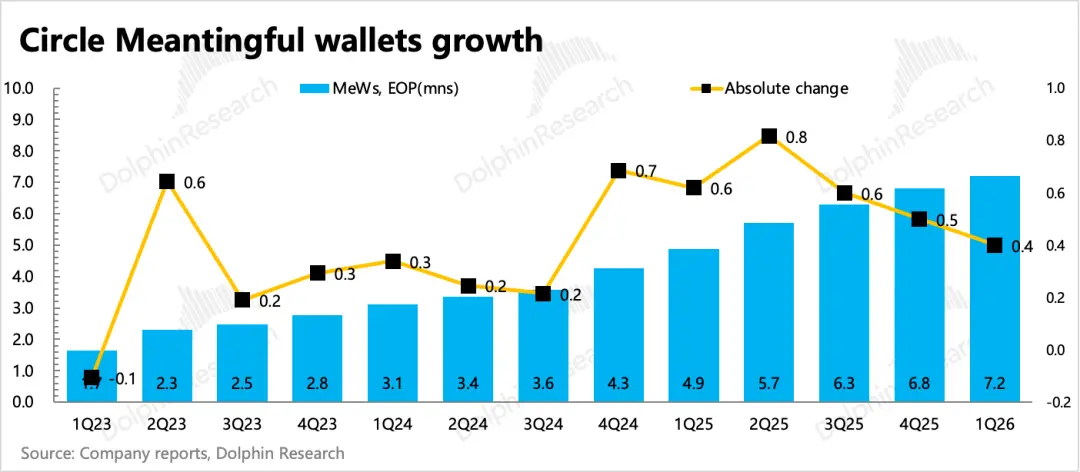
(3) As of the end of Q1, the number of digital wallets (MeWs, crypto wallets holding more than $10 on-chain) reached 7.2 million, with a net increase of 400,000 sequentially in the quarter, exceeding market expectations and reflecting growth in the platform's direct user base.
(4) In terms of ecosystem expansion news, Q1 mainly involved partnerships with Cash App, Polymarket, and Kyriba (platforms supporting native USDC transactions), while also advancing the Arc blockchain and the scale of CPN transactions.
Total on-chain USDC transactions in Q1 reached $21.5 trillion, up 263% year-over-year. CPN annualized transaction volume based on March was $8.3 billion. In April, the new product Managed Payments was launched, allowing financial institutions to enable stablecoin payments without managing digital assets.
2. Revenue Has Highlights But Less Impressive Than Last Quarter: Non-Interest Revenue Performance Exceeds Expectations, But Sequential Growth Slows.
The aforementioned B2B ecosystem expansion also brings Circle revenue beyond reserve interest – recorded under "Other Revenue." Therefore, in addition to helping expand the USDC market, this is also a second growth curve Circle is developing to counter pressure from reserve interest growth during a potential rate-cutting cycle.
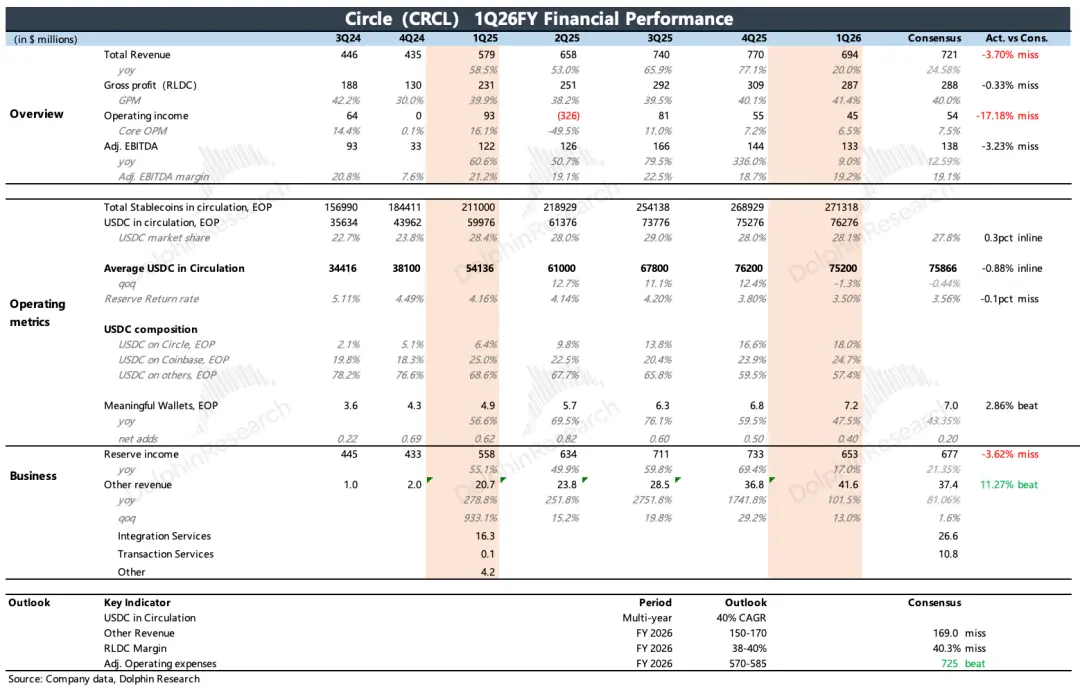
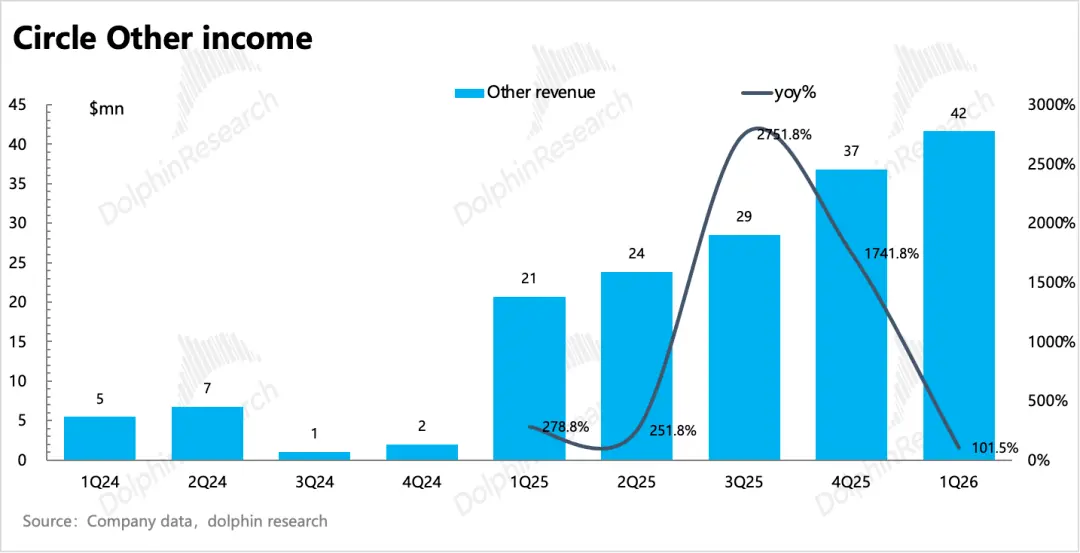
Other revenue in Q1 reached $42 million. Although still a small proportion (6%), it still achieved double-digit year-over-year growth despite a higher base. However, looking at the trend, the sequential growth rate of 13% slowed compared to last quarter's 29%, making it less impressive than last quarter.
3. Gross Margin: Increased Retention Share Buffers Cost-Sharing Pressure
The market previously worried that while expanding its ecosystem, Circle would need to share reserve interest income with partners. Additionally, Coinbase's earnings report revealed its rising share of USDC, which could increase Circle's channel distribution costs and pressure gross margins.
The reality is that Circle continues to alleviate cost growth pressure by increasing its own share of USDC holdings. Among these, the cost paid to Coinbase as a share of the total cost-sharing expense is decreasing (from 97% to 75%). It's worth noting that Coinbase, having the most leverage in its partnership with Circle, also has the highest revenue-sharing ratio at 50%.
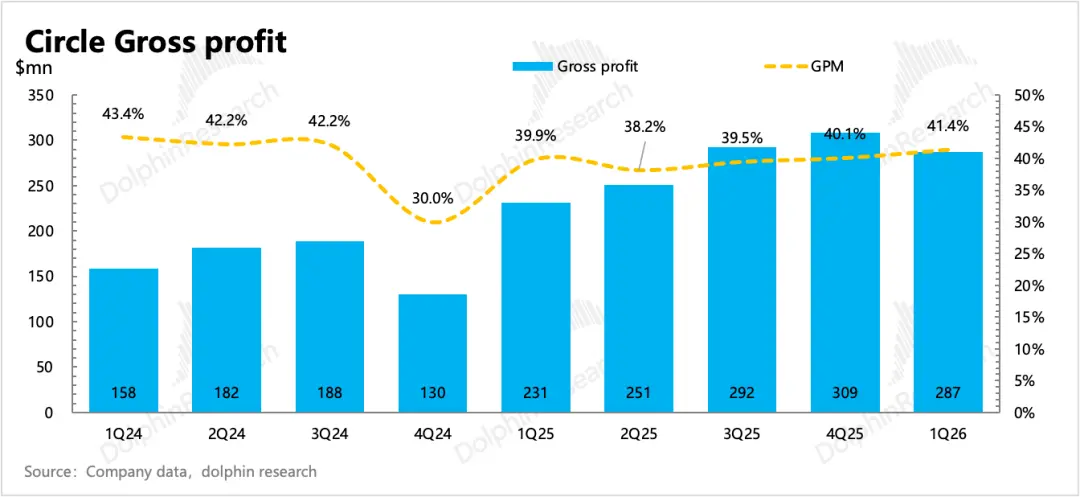
Furthermore, software, payments, and other infrastructure service revenues within Other Revenue are mostly high-margin businesses. This quarter, growth in other businesses was faster, and their contribution to revenue also increased. The final gross margin was 41.4%, improving by 130 basis points sequentially.
4. Under Rigid Investment Cycle, Profit Under Pressure: Operating Profit Declined Significantly Year-over-Year, Also Due to the Sensitivity of Profit to Changes in the Large-Share Interest Income Under Rigid Investment Cycles.
However, in the Q1 earnings report, management maintained its guidance for the 2026 fiscal year, keeping the full-year adjusted operating expense range unchanged at $570-585 million, better than the market's higher investment expectation ($725 million).
5. Future Growth: Guidance Unchanged, Short-Term Volatility Warrants Caution
(1) Regarding the outlook for USDC scale growth over multiple years, Q1 management maintained its expectation of a 40% CAGR over multiple years. However, similar to last quarter, Dolphin Research believes caution should be exercised and immediate pricing in is not necessary: Given significant market changes, this can be temporarily overlooked. Based on last year's situation, this medium-to-long-term qualitative guidance does not guarantee short-term achievement.
(2) Other revenue also maintains a target of $150-170 million, representing 46% year-over-year growth. If simply annualizing Q1, it's $167 million, right within the target range. However, Dolphin Research believes that with the effective advancement of the CLARITY Act, there is still great potential for this guidance to be beaten.
6. Key Financial Metrics Overview
Dolphin Research's View
Q1 performance is similar to a "strengthened" version of last year's Q4 – sentiment for crypto asset trading cooled further, but Circle did not stop expanding into other scenarios, resulting in even greater short-term profit pressure.
Although Coinbase and Circle belong to different parts of the industry chain, and the impact during unfavorable crypto asset market conditions differs for both (Circle is less affected), and there is also the issue of profit-sharing between them, in the short term, their trading rhythms largely move in tandem in terms of the broader direction.
Therefore, last quarter, we focused on a safety-first price given crypto asset pressure and unclear policy timelines. This quarter, we are more inclined to assess how much upside recovery space remains. The current valuation of $28 billion corresponds to Dolphin Research's neutral expectation from its initial coverage last year (refer to《Coinbase vs Circle: Who Dominates in the Symbiotic Yet Cutthroat Stablecoin Arena?》).
However, given significant short-term volatility, we estimate based on this year's performance outlook:
Assuming for the remaining three quarters of this year, crypto asset market conditions stabilize but last year's bull run may not be replicated due to inflation and interest rate expectations. Therefore, we project stablecoin scale to grow 5% sequentially (QoQ growth from Q2 to Q3 last year was 12%), reaching $870 billion by year-end. Assuming an unchanged federal funds rate of 3.5%, total annual interest income would be $2.8 billion. Other revenue is expected to exceed the upper guidance limit of $170 million, resulting in total revenue of $3 billion, a 9% year-over-year increase.
With a gross margin of 42% and guided adjusted operating expenses midpoint of $580 million, adjusted operating profit would be $680 million. Yesterday's closing price**** (***Locked content and detailed valuation analysis have been published in the article of the same name in the "Dynamics - In-Depth" section of the Longbridge App).
In summary, Circle's current valuation has largely completed a reasonable recovery process. The opening of further upside depends on the expansion progress of stablecoins and USDC specifically. In the short term, the effective advancement of the CLARITY Act, barring more systemic macro risks, could provide some positive sentiment, supporting the current valuation.
Detailed Analysis Below
I. Circle's Basic Business Framework
Circle is the issuer of the stablecoin USDC. Its primary revenue comes from: (1) Interest on reserve assets, which is tied to the circulating supply of USDC and Treasury interest rates. (2) Other revenue, including fees from providing Web3 software (SaaS subscriptions), CPN payments (fees based on transaction amount/number), and service or gas fees from the Arc blockchain (charged per transaction).
To mitigate the impact of potential interest rate cuts, Circle is actively developing its other revenue streams. In 2025, it primarily advanced CPN payments and the Arc blockchain business. Currently, other revenue accounts for nearly 5% and is expected to accelerate growth and expand its scale.
On the expense side, Circle's internal operational costs are mainly employee compensation. External costs primarily consist of channel sharing and transaction costs, which account for about 60% of revenue (most going to Coinbase). The adjusted EBITDA margin, after adding back depreciation and stock-based compensation, is around 20%, lower than most fintech platforms. Therefore, while expanding the ecosystem, expectations of increased cost-sharing have led some investors to worry about Circle's short-term profit pressure.
From a medium to long-term perspective, ecosystem expansion is more critical. Currently, USDC ranks second in the overall stablecoin market. Compared to the leader USDT, its advantage lies in compliance. Once the CLARITY Act is enacted, USDC is expected to further leverage its "relative" advantage and attract more institutional capital.
II. USDC Ecosystem: Accelerating New Minting, Short-Term Impacted by Crypto Asset Pressure
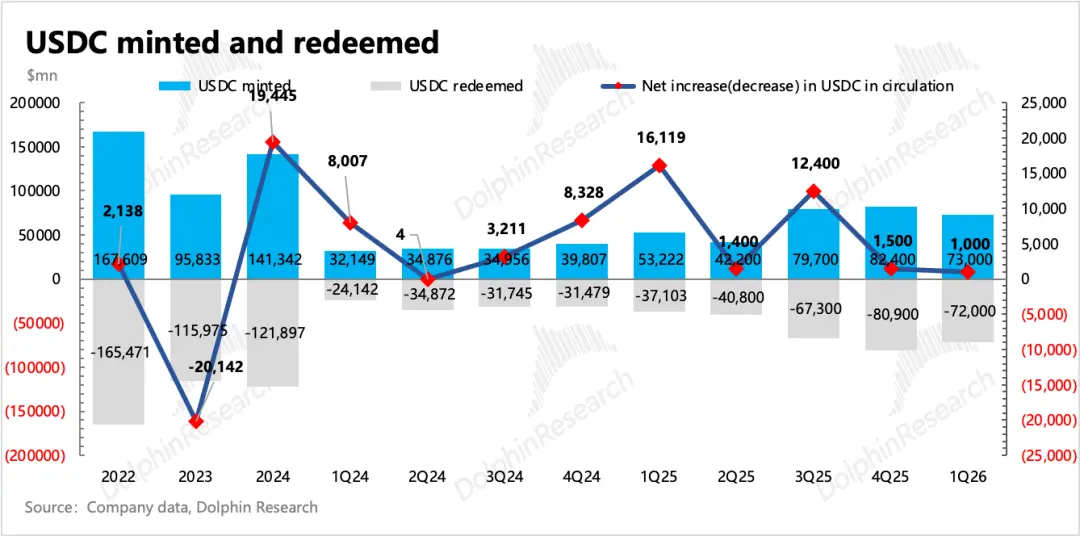
Average USDC circulation in Q1 was $75.2 billion, down sequentially, but climbed to $77 billion by quarter-end, up 2% sequentially. Minting in the quarter was $73 billion, redemptions were $72 billion. Net new issuance slowed significantly compared to Q3. According to Coinmarketcap, USDC circulation balance plummeted rapidly in January amid a panic sell-off in crypto assets, only rebounding in early February.
1. USDC External Market Share
In the overall stablecoin market, USDC's share remained stable sequentially at 28%. Compared to its direct competitor USDT, USDC has not demonstrated sustained competitive advantage.
2. Internal Channel Competition for USDC
Regarding the distribution of USDC across different channels, the share held internally by Circle continued to increase, reaching 18%.
Based on Coinbase's Q1 earnings report disclosure, its share of USDC circulation increased sequentially to 25%, indicating a trend of active retention compared to last quarter.
Another core metric reflecting ecosystem development – the number of active digital wallets. As of the end of Q1, the number of digital wallet MeWs (crypto wallets holding more than $10 on-chain) reached 7.2 million, a net sequential increase of 400,000, which is speculated to have continued slowing due to pressure in the crypto market.
III. Other Revenue Continues to Exceed Expectations, But the Trend is Not Aggressive Enough
Since about 95% of Circle's revenue from reserve asset interest is essentially public information, the main source of expectation variance is other revenue, and Q1 performance continued to exceed expectations.
Specifically, other revenue primarily includes income from minting, transactions, custody, Web3 API suite, tokenized fund USYC, and fees from CPN launched last April (fixed access fees + settlement/audit fees per transaction, Arc chain gas fees, etc.).
Other revenue in Q1 was $42 million, up 13% sequentially, showing a slowdown and was less impressive than last quarter. Additionally, the company's guidance for full-year other revenue remains at $150-170 million. From a sequential growth trend perspective, this is not particularly aggressive. Dolphin Research believes that if USDC expands normally, there is potential to beat this guidance.
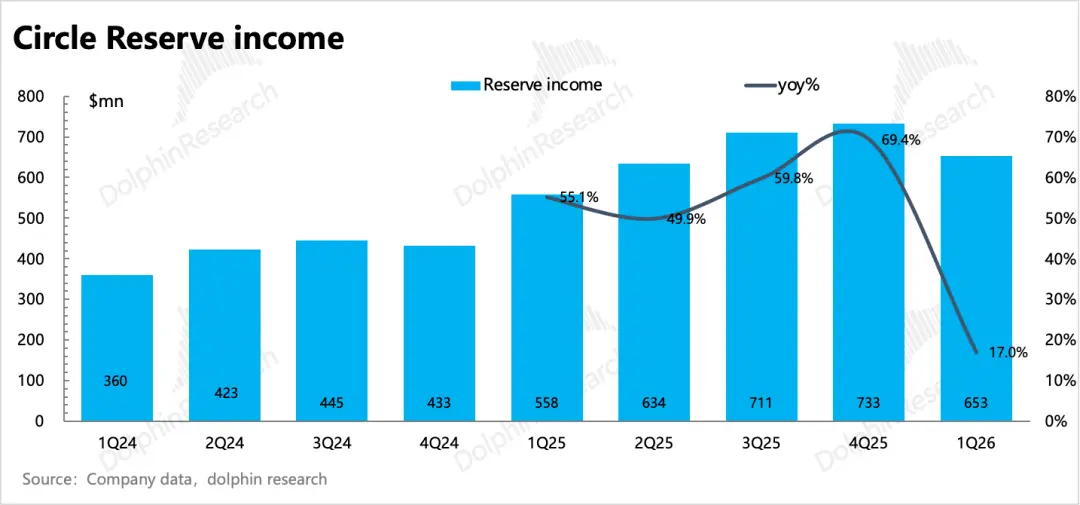
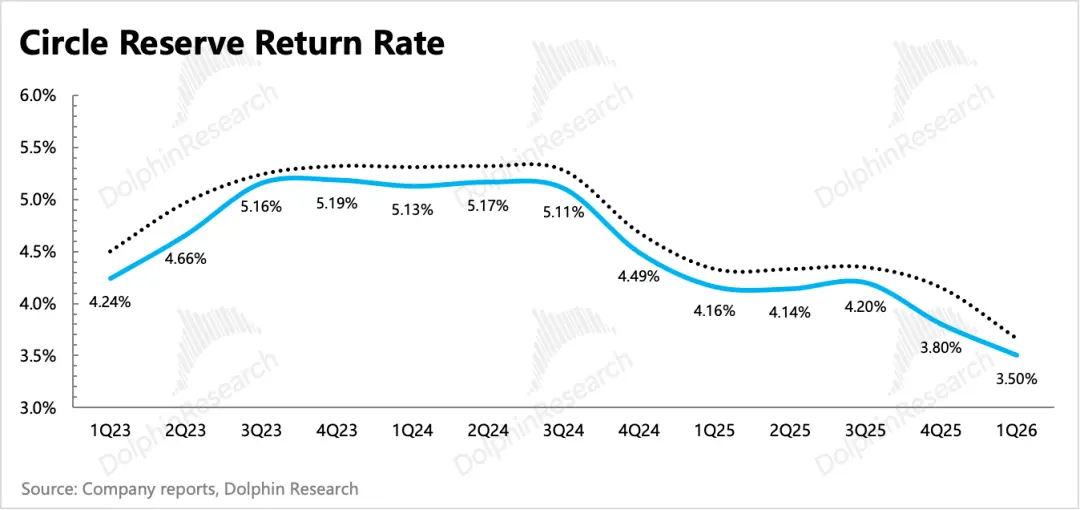
The main revenue, which constitutes the majority, is affected by the pace of USDC expansion and the current Treasury rate environment. In Q1, the average USDC scale increased 70% year-over-year, while the interest rate dropped to 3.5%, down 64 basis points year-over-year. Ultimately, reserve interest revenue growth was 17%, slowing rapidly.
However, expectations for future rate cuts have basically fallen to zero. Therefore, with stable interest rates, if scale expands normally over the next three quarters (QoQ >5%), there is still hope for 5-10% growth for the full year despite year-over-year pressure from interest rates.
IV. Profit Under Pressure Amid Rigid Investments
Q1 gross margin increased by 130 basis points sequentially to 41.4%. Circle continues to alleviate channel cost-sharing pressure by increasing its share of USDC holdings. Additionally, software, payments, and other infrastructure service revenues are mostly high-margin businesses. This quarter, growth in other businesses was faster, and their revenue contribution also increased.
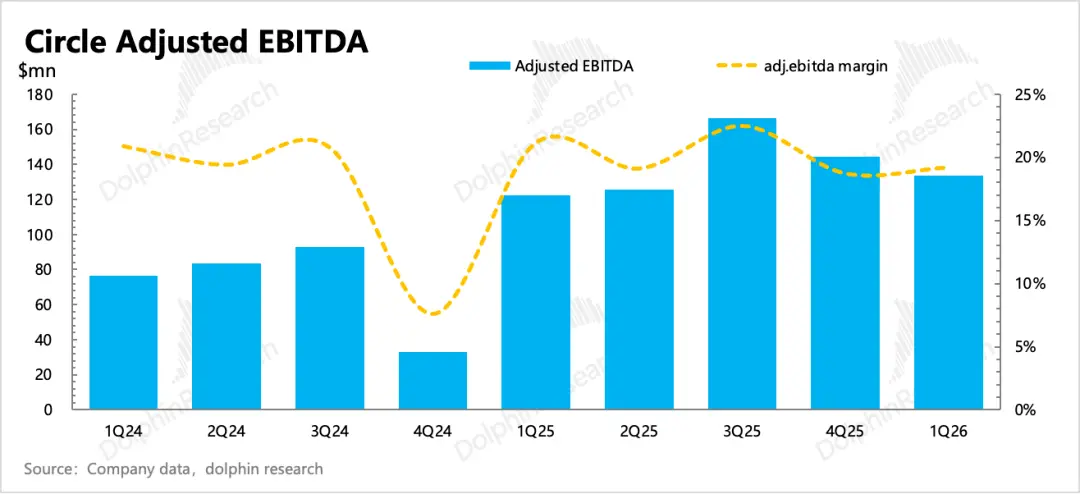
Despite slowing revenue growth pressure in Q1, various expense items still maintained high growth. Final adjusted EBITDA was $133 million, with a margin of 19.2%, up 50 basis points sequentially.
The company's guidance for full-year 2026 costs and operating expenses (excluding SBC and depreciation/amortization) remains unchanged at $570-585 million, representing 10% year-over-year growth, lower than market expectations.