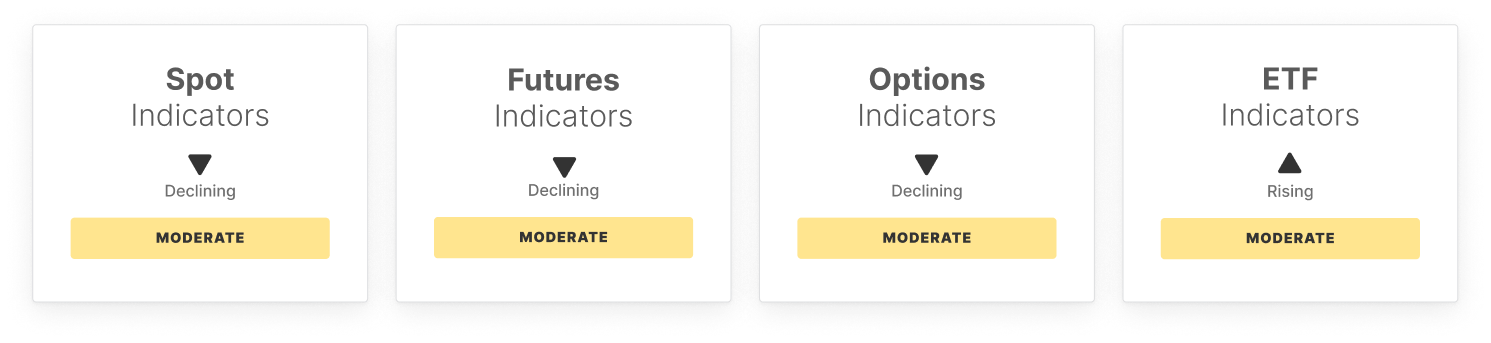
Despite a slight reduction in upward price momentum, the market still exhibits strong buyer interest, potentially buffering against significant price declines. However, a shift in the spot CVD from positive to negative has indicated an increase in selling pressure, revealing a shift towards bearish sentiment. Concurrently, trading activity has seen a rise on centralized exchanges, suggesting robust market participation.
In the futures market, open interest has increased, indicating a growing appetite for risk and heightened sensitivity to price movements. However, a significant decline in the long-side funding payment and a sharp drop in the perpetual CVD suggest an increase in bearish sentiment, with traders showing a willingness to pay a premium for short exposure and reduced buy-side aggression, respectively.
Options trading has seen a decrease in demand for downside protection, suggesting a potential softening of bearish sentiment. However, the contraction in open interest may signal profit-taking or position closures, ultimately affecting market volatility and price dynamics. Meanwhile, the volatility spread indicates a potential stabilization in market sentiment, transitioning from pricing in more risk to a more neutral stance.
In the ETF sector, an increase in the US Spot ETF MVRV ratio and netflow suggest enhanced profitability and strong investor interest. These factors, combined with a notable increase in trading activity, point towards a cautiously optimistic market sentiment and heightened engagement with Bitcoin through regulated channels.
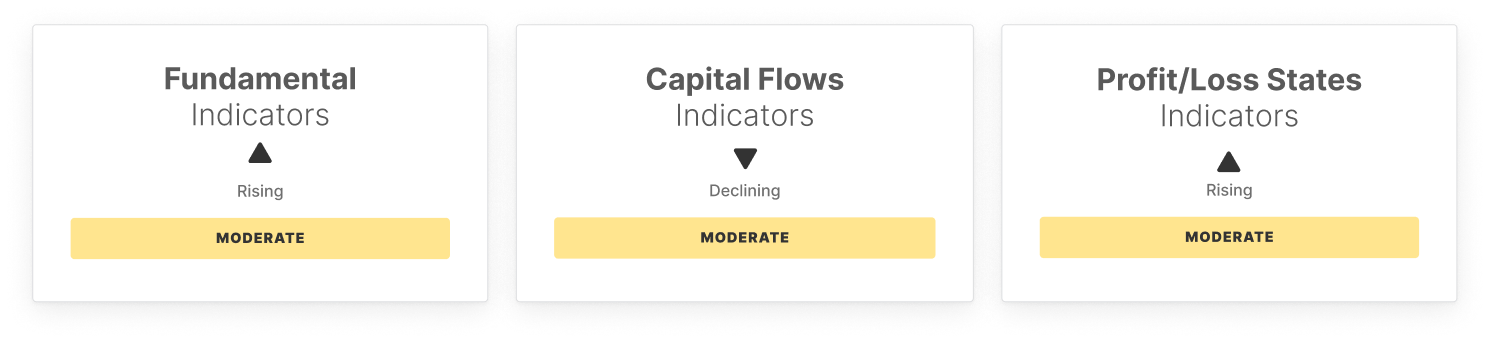
On the liquidity side, a decline in Hot Capital Share and a negative yet improving Realized Cap Change suggest older, more dormant capital and easing net outflows, consistent with cautious conditions. The STH to LTH Supply Ratio remains stable, indicating a balanced structure and continued confidence among long-term holders.
Finally, improvements in NUPL and Percent Supply in Profit signal a potential stabilization phase, with reduced pessimism and lower immediate sell pressure. However, a drop in the Realized Profit to Loss Ratio points to ongoing fear-driven selling, highlighting a complex and evolving market backdrop.
Off-Chain Indicators
On-Chain Indicators
🔗 Access the full report in PDF

Don't miss it!
Smart market intelligence, straight to your inbox.
Subscribe now- Follow us and reach out on X
- Join our Telegram channel
- For on-chain metrics, dashboards, and alerts, visit Glassnode Studio
Disclaimer: This report does not provide any investment advice. All data is provided for information and educational purposes only. No investment decision shall be based on the information provided here and you are solely responsible for your own investment decisions.
Exchange balances presented are derived from Glassnode’s comprehensive database of address labels, which are amassed through both officially published exchange information and proprietary clustering algorithms. While we strive to ensure the utmost accuracy in representing exchange balances, it is important to note that these figures might not always encapsulate the entirety of an exchange’s reserves, particularly when exchanges refrain from disclosing their official addresses. We urge users to exercise caution and discretion when utilizing these metrics. Glassnode shall not be held responsible for any discrepancies or potential inaccuracies.
Please read our Transparency Notice when using exchange data.