Bitcoin RSI bullish divergence draws 2022 comparisons as analysis weighs new price trend

cointelegraphPubblicato 2026-08-25Pubblicato ultima volta 2026-08-25

Introduzione

Bitcoin (BTC) price is at $80,000 amid conflicting market signals. Analysis of key momentum indicators is sparking debate on whether a new trend is emerging. The weekly Relative Strength Index (RSI) has reached 58.3, showing a bullish divergence pattern similar to the one seen before the end of the 2022 bear market, suggesting a potential major trend change. Meanwhile, the daily RSI is near 83, its most "overbought" level since November 2024. Some see this as a reversal warning, while others note sustained overbought periods have historically accompanied bull markets. Analysts draw further comparisons to late 2022, when a sharp RSI surge signaled a new market phase. Additionally, the two-month stochastic RSI has printed a key bullish crossover, though it did not reach the extreme lows seen before prior major reversals. Traders remain divided on whether Bitcoin's recent 25% rebound marks a lasting shift or a temporary pause.

Bitcoin (BTC) price action is offering mixed signals after hitting $80,000 as traders diverge on market trajectory.


Key points:


  • Bitcoin weekly relative strength index (RSI) reaches 58.3, repeating a bullish divergence that accompanied the end of the 2022 bear market.
  • Daily RSI values reach their most “overbought” since November 2024 near 83.
  • Stochastic RSI prints a key crossover but avoids copying previous zero-level bear-market lows.


Weekly RSI echoes Bitcoin’s 2022 bear-market bottom


Relative strength index (RSI) data across daily, weekly and two-month time frames has added to the debate over whether last week’s 25% rebound by Bitcoin will endure.


RSI is a classic indicator for trend momentum. It uses an asset’s average gain or loss over a given lookback window, normally 14 days, to determine the strength of its current trend momentum. For Bitcoin, bullish divergences with price, where RSI makes higher highs while BTC/USD makes lower lows, have accompanied the start of major trend inflections.


In mid-2022, around six months before the end of Bitcoin’s last bear market, weekly RSI began a bullish divergence, locking in higher lows while BTC/USD saw lower lows. Throughout 2026, a similar pattern emerged, data from TradingView shows.
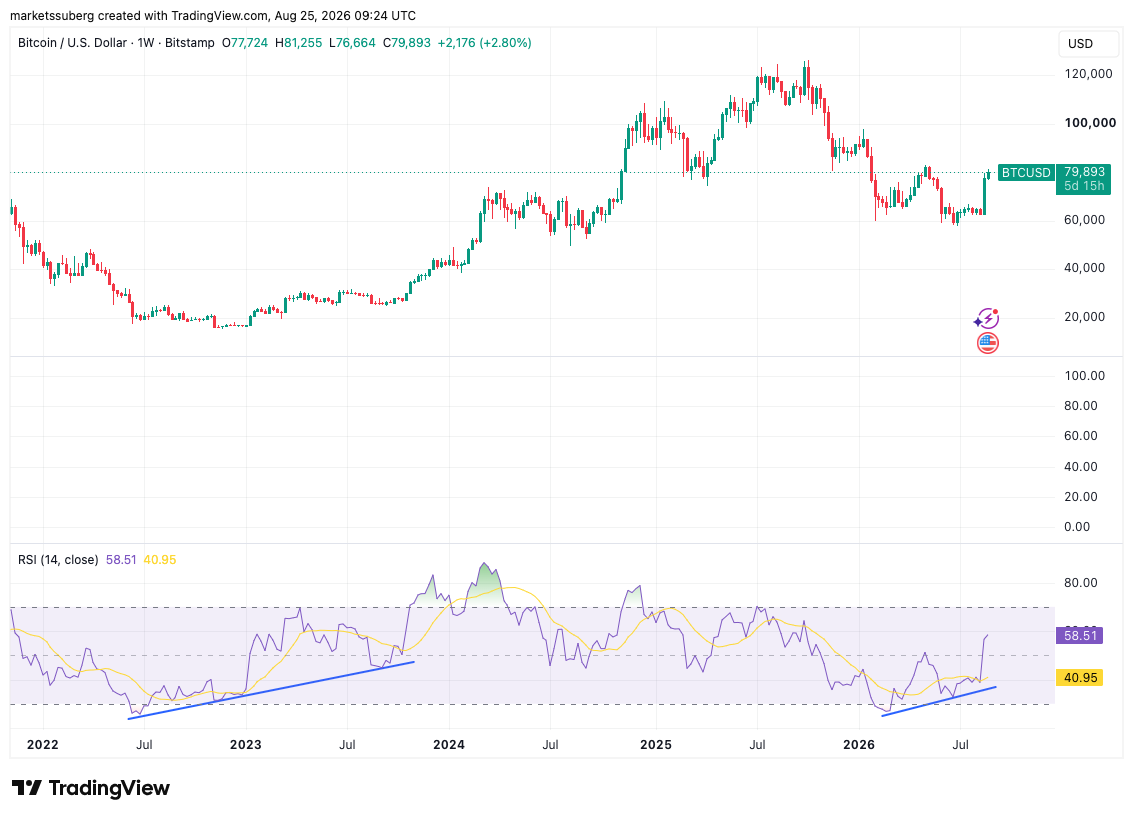

BTC/USD one-week chart with RSI bullish divergences. Source: Cointelegraph/TradingView


While short-term RSI signals present a less reliable picture of overall price trends, weekly signals have led some to rethink the status of the current bear market.


“Weekly is the timeframe that matters here, that’s where you read the secular trend and the cycle inflection points,” Jamie Coutts, chief crypto analyst at Real Vision, wrote in a post on X on Tuesday.


Coutts described weekly bullish divergences as having “real weight,” citing price upside that resulted from previous divergence events.


Weekly RSI currently measures 58.3, its highest levels since BTC/USD hit its latest all-time high of $126,200 in October 2025, having broken through a trend of lower highs. On daily time frames, RSI is now in “overbought” territory at 82.93.
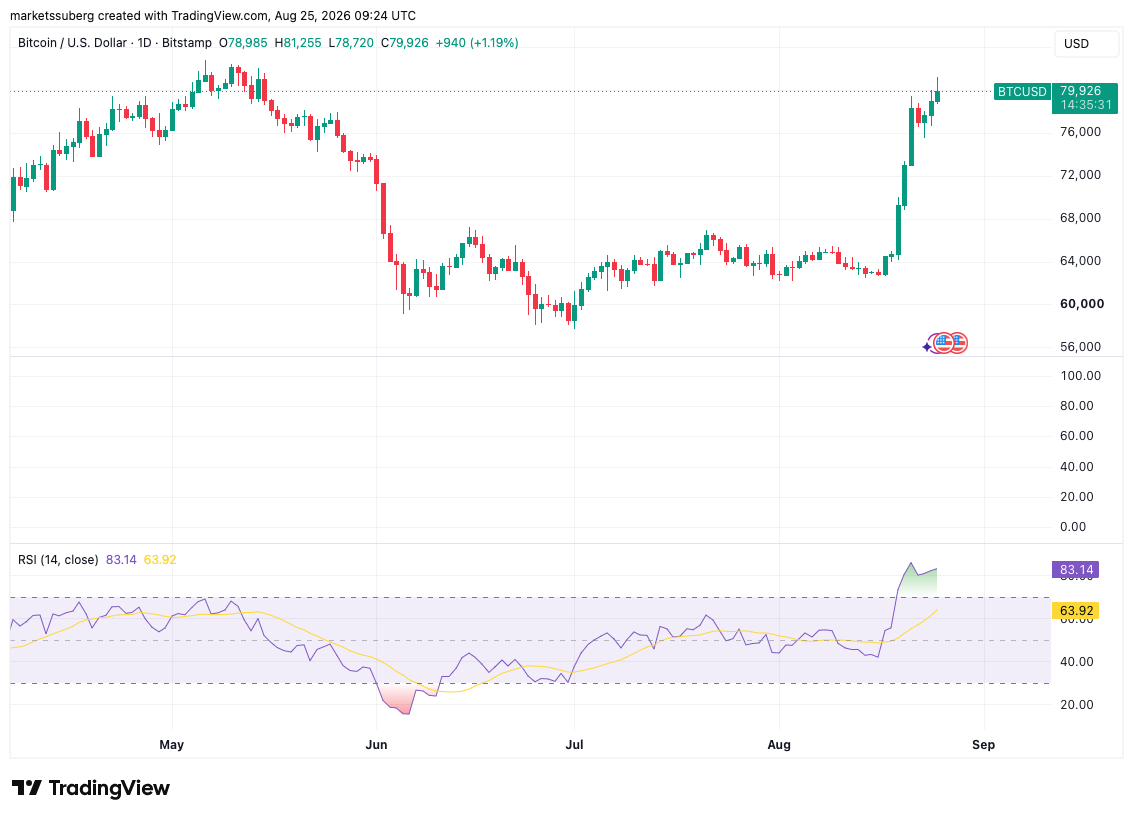

BTC/USD one-day chart with RSI data. Source: Cointelegraph/TradingView


Market participants are split over the implications of the daily readings, which are the highest since November 2024. Some see RSI giving a warning sign of an imminent reversal, while others point to the fact that historically, Bitcoin uptrends have been accompanied by multiple “overbought” periods, where RSI is above 70.


In his latest analysis, Jonatan Randin, senior market analyst at crypto trading platform PrimeXBT, flagged more similarities to late 2022. At the time, daily RSI increased from 40 to 90 over a single weekly candle.


“An extreme move like this usually signals the start of something new,” he told X followers.


“It doesn’t necessarily mean that the bear market is over but it is telling us something. I think what it’s trying to tell us is that we are about to enter a new phase of this cycle.”
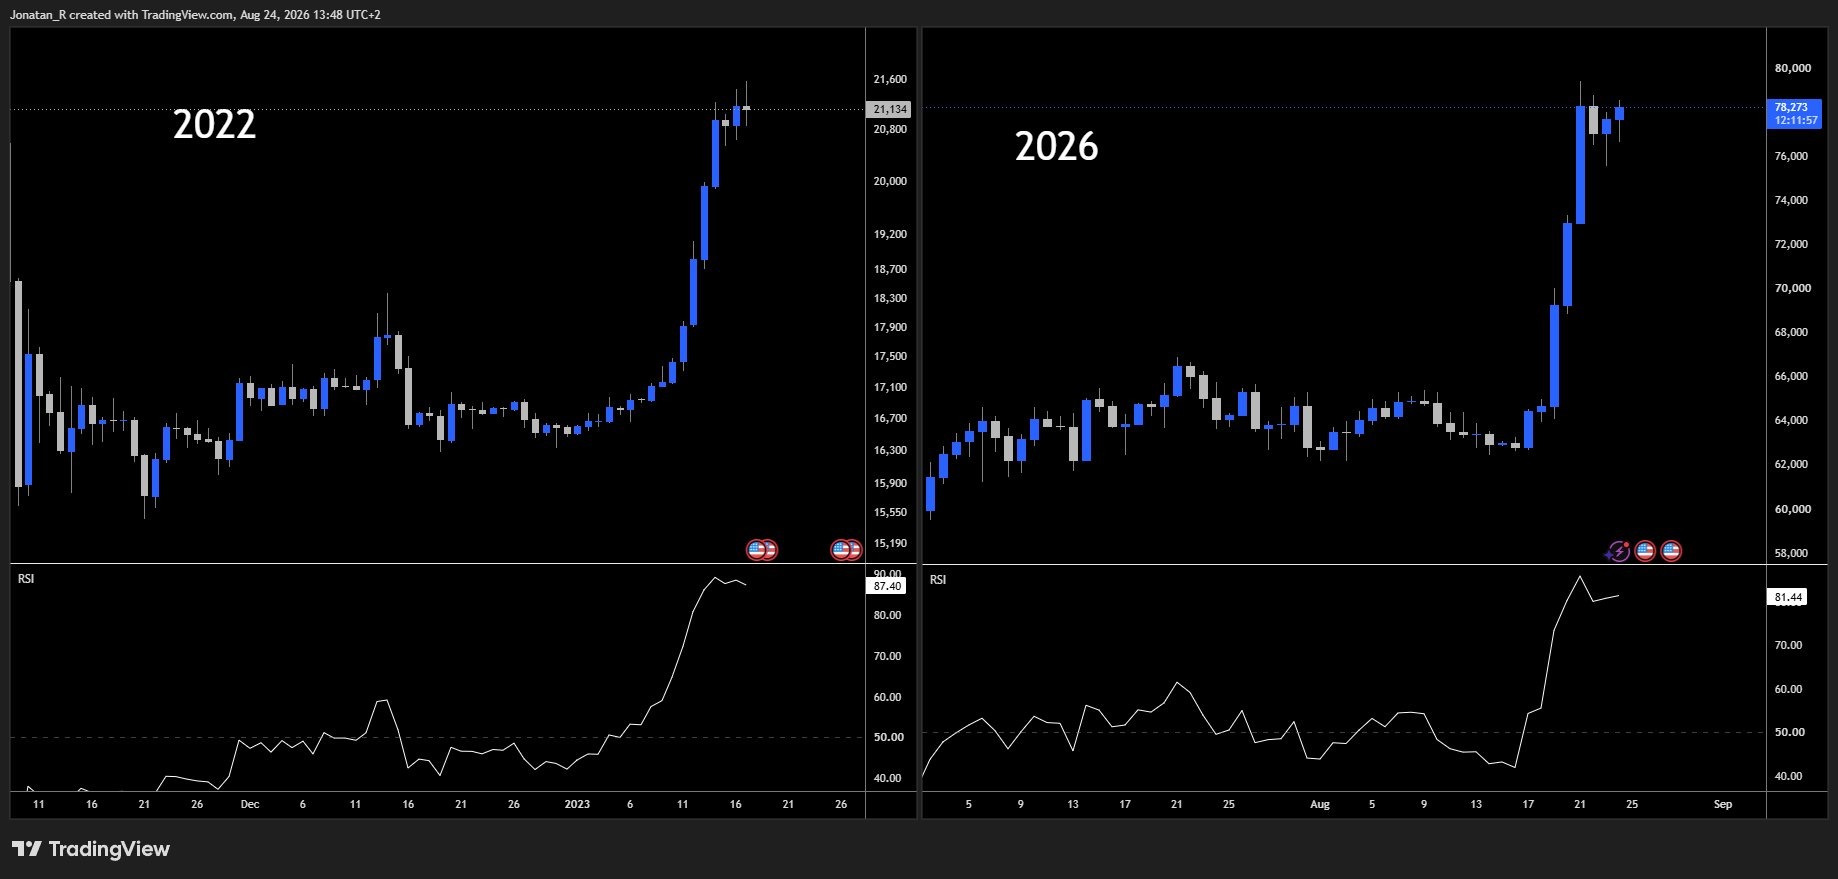

BTC/USD RSI comparison chart. Source: Jonatan Randin on X.com


Stochastic RSI prints anticipated crossover


Previously, Cointelegraph reported on expectations that Bitcoin’s two-month stochastic RSI indicator would repeat historical patterns to provide a clear signal over the end of the bear market.


Related: First bear-market trend line reclaim since 2025: Five things to know in Bitcoin this week


Stochastic RSI privileges more recent price moves, with a crossover of its two constituent trend lines acting as a cue for bullish trend change. This event has now occurred. However, the indicator reached only 4.81, avoiding the macro lows near zero that preceded previous crossovers.
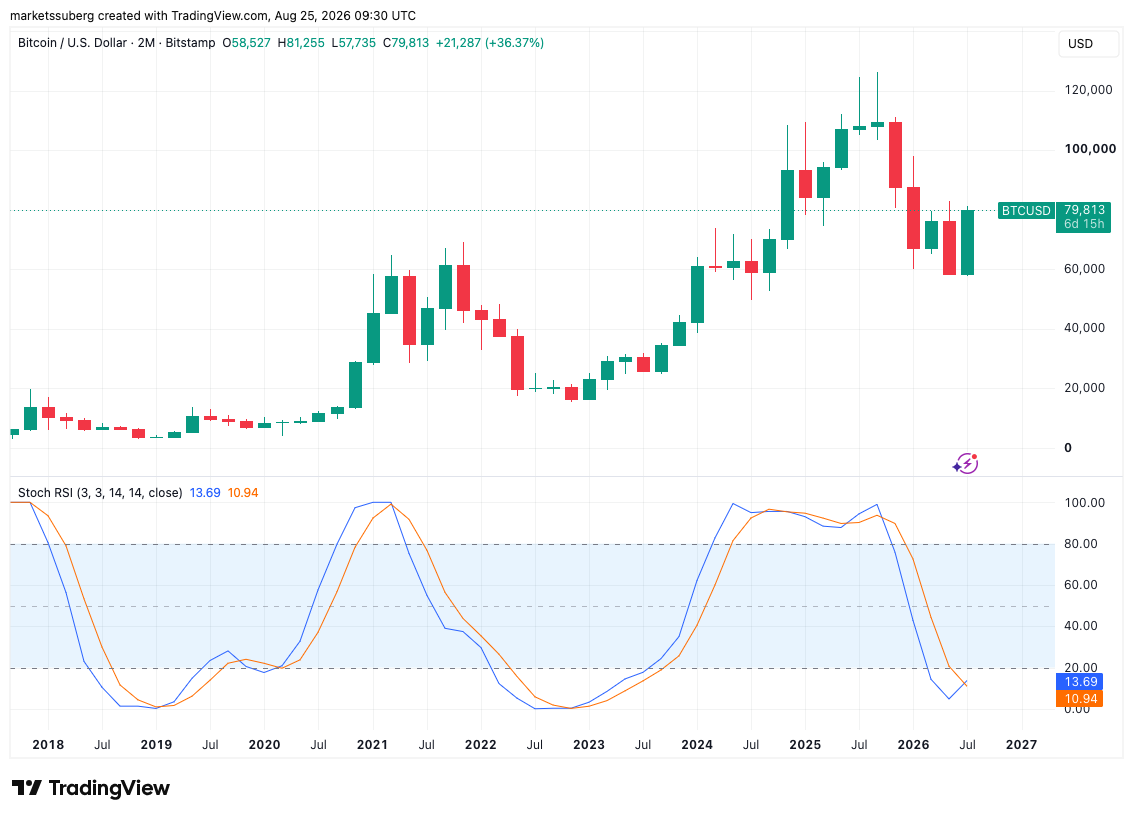

BTC/USD two-month chart with stochastic RSI data. Source: Cointelegraph/TradingView


Domande pertinenti

QWhat key similarity between Bitcoin's current weekly RSI pattern and that of 2022 does the article highlight?

AThe article highlights that Bitcoin's weekly RSI is repeating a bullish divergence pattern that accompanied the end of the 2022 bear market, where the RSI made higher lows while the BTC/USD price made lower lows.

QAccording to the article, what is the current level of Bitcoin's daily RSI and what does it signify?

ABitcoin's daily RSI is at 82.93, which is in 'overbought' territory and marks its highest level since November 2024.

QWhat did analyst Jonatan Randin suggest about the extreme move in daily RSI similar to late 2022?

AJonatan Randin suggested that an extreme RSI move like the one seen (increasing from 40 to 90 in a week) usually signals the start of something new, indicating the market is about to enter a new phase of the cycle.

QWhat event has occurred with Bitcoin's two-month stochastic RSI indicator, and how does its recent low differ from previous bear-market signals?

AThe two-month stochastic RSI indicator has printed a bullish crossover. However, its recent low only reached 4.81, avoiding the macro lows near zero that preceded previous such crossovers at bear-market bottoms.

QWhat conflicting views do market participants have regarding Bitcoin's high daily RSI readings?

AMarket participants are split: some view the high daily RSI as a warning sign of an imminent price reversal, while others point out that historically, Bitcoin uptrends have been accompanied by multiple such 'overbought' periods where RSI is above 70.

Letture associate

Zcash Price Surge Enhances Its Advantage Over Bitcoin in Mining Revenue and AI High-Performance Computing

According to analysis by The Energy Mag, Bitmain's Z15 Pro miner for Zcash cryptocurrency generated approximately $727.30 in gross revenue per megawatt-hour of electricity as of Monday, which is about 3.3 times higher than the estimated industry average for high-performance computing (HPC) at $222.73 per MWh. This marks a significant increase in the mining advantage of Zcash over HPC, from about $150 per MWh in late June to over $500 currently. The performance gap compared to Bitcoin mining hardware like the S23 Pro also widened substantially. The surge is driven primarily by a sharp price increase in Zcash (ZEC), which rose roughly 70% in seven days to trade around $890, setting what analysts consider a practical all-time high based on more liquid trading history. Bitcoin also saw gains of over 20%, rising above $77,000, but its mining revenue growth was far less pronounced than Zcash's. The broader cryptocurrency rally was initially fueled by the U.S. Treasury's decision to expand long-term bond purchases, which lowered yields and weakened the dollar, prompting investors to shift towards alternative assets like gold and cryptocurrencies. Regulatory developments, including former President Trump's push for the Clarity Act and outlined lighter rules for digital asset firms, provided additional momentum. A subsequent short squeeze, with over $4 billion in bearish crypto positions liquidated, further amplified upward pressure. Upcoming U.S. economic data and Federal Reserve Chair Kevin Warsh's speech at the Jackson Hole symposium are seen as key tests. Hawkish signals on inflation could strengthen the dollar and Treasury yields, potentially reversing some of the liquidity-driven crypto gains, while a softer stance may support further demand for risk assets.

cryptonews.ru5 min fa

Zcash Price Surge Enhances Its Advantage Over Bitcoin in Mining Revenue and AI High-Performance Computing

cryptonews.ru5 min fa

Analysis of Mining Rig Asset Depreciation and Tax Cost Recovery

**Analysis of Mining Rig Depreciation and Tax Cost Recovery** The article examines the differing treatments of ASIC mining equipment depreciation in financial accounting versus U.S. federal tax law. Financially, under IFRS/IAS 16, the cost is capitalized and depreciated over the equipment's estimated useful life, typically 2-5 years, based on economic viability factors like technological obsolescence and power efficiency. Tax law, however, offers potentially faster cost recovery. The key U.S. tax development is the permanent restoration of 100% bonus depreciation (IRC §168(k)) by Public Law 119-21, applicable to qualified property placed in service after January 19, 2025. This allows eligible mining rigs' entire tax basis to be deducted in the first year, creating a significant timing advantage for profitable companies by reducing current taxable income and cash taxes. However, companies can elect *not* to use 100% bonus depreciation for an entire asset class. This may be beneficial in loss-making years, as accelerated deductions would only increase net operating losses (NOLs) subject to usage limitations, rather than provide immediate cash tax savings. A transitional 40% bonus depreciation option is also available. This divergence creates temporary differences for accounting purposes. For example, a rig with a $1 million cost and a 3-year accounting life would have a book value of ~$666,667 after Year 1 but a tax basis of zero if 100% bonus depreciation is applied. This $666,667 excess of book value over tax basis creates a deferred tax liability, which reverses over the asset's remaining accounting life. The article contrasts the U.S. approach with other jurisdictions. In Ethiopia, tax depreciation for computing equipment (e.g., 20% straight-line) may be slower than financial depreciation, creating deductible temporary differences. Kazakhstan's new Tax Code employs declining balance methods with varying rates depending on asset classification. In practice, companies must maintain detailed asset records (cost, in-service date, estimated life, tax classification) to align accounting and tax treatments and support deferred tax calculations, especially given the rapid pace of mining hardware evolution.

marsbit6 min fa

Analysis of Mining Rig Asset Depreciation and Tax Cost Recovery

marsbit6 min fa

Trading

Spot
活动图片