Bitcoin Price At $59,000 Is The Line In The Sand, Here’s What You Should Know

bitcoinistPubblicato 2026-03-30Pubblicato ultima volta 2026-03-30

Introduzione

Bitcoin's price is currently consolidating between $60,000 and $74,000, with a decisive breakout direction likely determining the market's next major move. Analysts highlight the critical importance of the 200-Week Moving Average, currently at $59,000, as a key support level. Historically, holding above this level has preceded significant bull runs—such as those in 2015, 2019, and 2023—leading to new all-time highs. Maintaining above $59,000 suggests long-term bullish momentum, with dips viewed as buying opportunities. However, a break below this level could signal a bear market and further declines. The macro structure remains optimistic, urging investors to avoid short-term fear.

Over the last few weeks, the Bitcoin price has ping-ponged between $60,000 and $74,000, suggesting that the direction that the price breaks out of in this range could be determinant of what direction the entire market takes next. After dropping more than 45% already, all attention has now shifted to when the pioneer cryptocurrency will make a new bottom. So far, bulls have held up surprisingly well, but there is still a ‘line in the sand’ that the price must not cross.

Bitcoin Macro Structure Is Still Bullish

Presently, the Bitcoin price is still holding well above the 200-Week Moving Average, which is very bullish for the price, according to crypto analyst Crypto Patel. The reason for this dates back to the past market cycles, where the 200-Week Moving Average has been the major level to hold or beat.

Digging into the past cycles, Crypto Patel explained that the Bitcoin price had been able to stay above the 200-Week Moving Average back in 2015. The result of this was a major rally that saw the Bitcoin price rally toward $20,000 in the bull market that followed.

Then again, in 2019, the same 200-Week Moving Average held firm, and the resulting bull market led to the 2021 peak of $69,000. Even the third time in 2023, despite the price preciously crashing below $20,000, Bitcoin had managed to hold above the 200-Week Moving Average, and bulls were rewarded as the price would reach $126,000 in 2025.
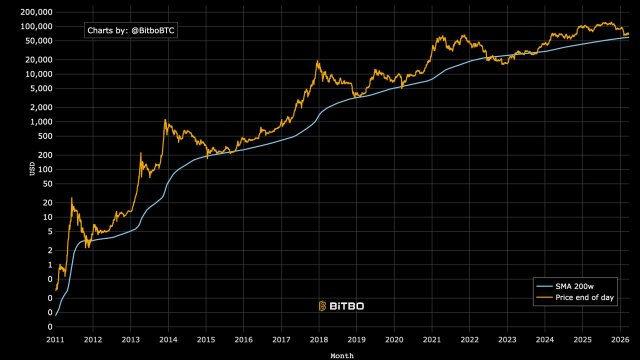
Source: X

Given this trend, it becomes obvious that the Bitcoin price being above the 200-Week MA is bullish, and likewise, a crash below it would be bearish. This is why it is important for the bulls to maintain a hold on this level.

BTC Price Must Not Fall Below $59,000

Going by the analyst’s post, the current 200-Week Moving Average for Bitcoin lies at $59,000. This immediately makes it the level to defend for the bulls. As Crypto Patel explains, as long as the Bitcoin price stays above this level, then ‘every dip is a gift.’ This means it could be an opportunity to buy.

If historical trends are to be respected, holding the 200W MA would mean that the Bitcoin price would see new all-time highs sometime in 2028. “The Macro Structure Is Still Bullish. Don’t Let Short-Term Fear Shake You Out,” the analyst warns.

Alternatively, a break below this 200-Week Moving Average could be disastrous for Bitcoin, because it would mean that the cryptocurrency has now officially entered bear market territory. It could also bring the harbinger of more decline, sending the cryptocurrency lower before establishing a bottom.

BTC bulls begin to push upward again | Source: BTCUSD on Tradingview.com

Crypto di tendenza

Domande pertinenti

QWhat is the significance of the $59,000 level for the Bitcoin price according to the article?

AThe $59,000 level represents the current 200-Week Moving Average, which is a critical support level. Historically, Bitcoin has entered a bull market after holding above this level. A break below it could signal an official entry into a bear market.

QWhat historical evidence does the analyst, Crypto Patel, provide to support the importance of the 200-Week Moving Average?

ACrypto Patel points to three previous cycles: in 2015, holding above the 200-Week MA led to a rally to $20,000; in 2019, it led to the 2021 peak of $69,000; and in 2023, it preceded a rally to $126,000 in 2025.

QWhat is the potential consequence if the Bitcoin price breaks below the 200-Week Moving Average?

AA break below the 200-Week Moving Average would be disastrous as it would mean Bitcoin has officially entered bear market territory and could lead to further decline before a bottom is established.

QWhat is the analyst's advice for investors if the price holds above the $59,000 level?

AThe analyst advises that as long as the price stays above $59,000, 'every dip is a gift,' meaning it should be seen as a buying opportunity, and investors should not be shaken out by short-term fear.

QWhat is the projected long-term outcome if Bitcoin respects the historical trend and holds the 200-Week MA?

AIf the historical trend is respected and Bitcoin holds the 200-Week MA, the price is projected to reach new all-time highs sometime in 2028.

Letture associate

Why Bitcoin Holds Above $64,000 After Fed's Hard Pause

**Bitcoin Stabilizes Near $64,000 Following Hawkish Fed Pause** The cryptocurrency market, led by Bitcoin, remained stable around $64,000 despite a volatile reaction to the latest U.S. Federal Reserve meeting. The Fed paused interest rates but signaled a hawkish stance, with three committee members voting for an increase—the highest dissent since 2016. This limits risk appetite but hasn't triggered panic selling. Key market highlights include Bitcoin ETFs seeing a net inflow of $32.1 million, breaking a streak of outflows, while Ethereum ETFs experienced outflows of $18.65 million. Liquidations affected about 90,000 traders. Technically, Bitcoin finds support around $63,000-$63,500, with major resistance near $66,000. While its price is about 49% below its all-time high, institutional demand via ETFs and the absence of mass capitulation support a potential recovery scenario in the second half of the year. Major altcoins showed mixed movements, with Solana attracting capital while Ethereum faced selling pressure despite strong on-chain metrics like a growing staking queue. Regulatory news took a pause as the U.S. Senate delayed the CLARITY Act vote until at least autumn. For the final trading day of July, U.S. inflation and consumer spending data will be crucial. Bitcoin's key levels to watch are $63,000 support and $66,000 resistance. Sustained ETF inflows and Bitcoin holding above $63,000 are seen as positive signs for a potential market recovery later in the year.

cryptonews.ru33 min fa

Why Bitcoin Holds Above $64,000 After Fed's Hard Pause

cryptonews.ru33 min fa

Participants in XRP Fraud Scheme That Stole $9 Million from 71 Investors Arrested

South Korean police have arrested three individuals accused of operating a fraudulent investment platform that stole approximately 3.4 million XRP (worth about $9 million) from 71 investors between October 16 and 23. The suspects promoted the site Fxrpntwork.com through blogs, online articles, and YouTube videos, promising guaranteed principal and monthly returns of 1.5% to 1.8%. Investors were instructed to transfer XRP from Korean exchanges to overseas platforms and then to wallets controlled by the group before the site was shut down. The scammers copied the branding of legitimate projects Flare Network and FXRP to appear credible. Authorities warn that such impersonation frauds, which use familiar branding and urgent promises of guaranteed profits, are a common red flag. Legitimate companies do not solicit cryptocurrency transfers through unsolicited promotions. Seoul police have issued an Interpol Red Notice for a fourth suspect abroad and are investigating others involved in creating and promoting the fraudulent website. While investigators froze 17.3 billion won in assets, approximately 10 billion won was moved during the probe, with wallet analysis revealing transfers totaling 27.3 billion won, suggesting there may be additional unidentified victims and accomplices. The case underscores the organized, cross-border nature of crypto investment fraud.

cryptonews.ru36 min fa

Participants in XRP Fraud Scheme That Stole $9 Million from 71 Investors Arrested

cryptonews.ru36 min fa

Trading

Spot

Articoli Popolari

Come comprare SAND

Benvenuto in HTX.com! Abbiamo reso l'acquisto di The Sandbox (SAND) semplice e conveniente. Segui la nostra guida passo passo per intraprendere il tuo viaggio nel mondo delle criptovalute.Step 1: Crea il tuo Account HTXUsa la tua email o numero di telefono per registrarti il tuo account gratuito su HTX. Vivi un'esperienza facile e sblocca tutte le funzionalità,Crea il mio accountStep 2: Vai in Acquista crypto e seleziona il tuo metodo di pagamentoCarta di credito/debito: utilizza la tua Visa o Mastercard per acquistare immediatamente The SandboxSAND.Bilancio: Usa i fondi dal bilancio del tuo account HTX per fare trading senza problemi.Terze parti: abbiamo aggiunto metodi di pagamento molto utilizzati come Google Pay e Apple Pay per maggiore comodità.P2P: Fai trading direttamente con altri utenti HTX.Over-the-Counter (OTC): Offriamo servizi su misura e tassi di cambio competitivi per i trader.Step 3: Conserva The Sandbox (SAND)Dopo aver acquistato The Sandbox (SAND), conserva nel tuo account HTX. In alternativa, puoi inviare tramite trasferimento blockchain o scambiare per altre criptovalute.Step 4: Scambia The Sandbox (SAND)Scambia facilmente The Sandbox (SAND) nel mercato spot di HTX. Accedi al tuo account, seleziona la tua coppia di trading, esegui le tue operazioni e monitora in tempo reale. Offriamo un'esperienza user-friendly sia per chi ha appena iniziato che per i trader più esperti.

356 Totale visualizzazioniPubblicato il 2024.12.10Aggiornato il 2026.06.02

Come comprare SAND

Discussioni

Benvenuto nella Community HTX. Qui puoi rimanere informato sugli ultimi sviluppi della piattaforma e accedere ad approfondimenti esperti sul mercato. Le opinioni degli utenti sul prezzo di SAND SAND sono presentate come di seguito.

活动图片













