Bitcoin entered the third quarter in a deep slump: in the spring, during a sharp decline (when it lost over 19% in one week and more than 26% in 30 days), the asset fell to its lowest level of 2026. As a result of the crash, more than half of all bitcoins in circulation were 'underwater' at the low.
Bitcoin.com News tracked how during this period the asset traded as much as 50% below its October 2025 cycle high of $126,209, as bullish catalysts such as exchange-traded fund (ETF) demand and institutional investor accumulation ran into bearish headwinds including tighter macroeconomic policy and profit-taking by long-term holders.
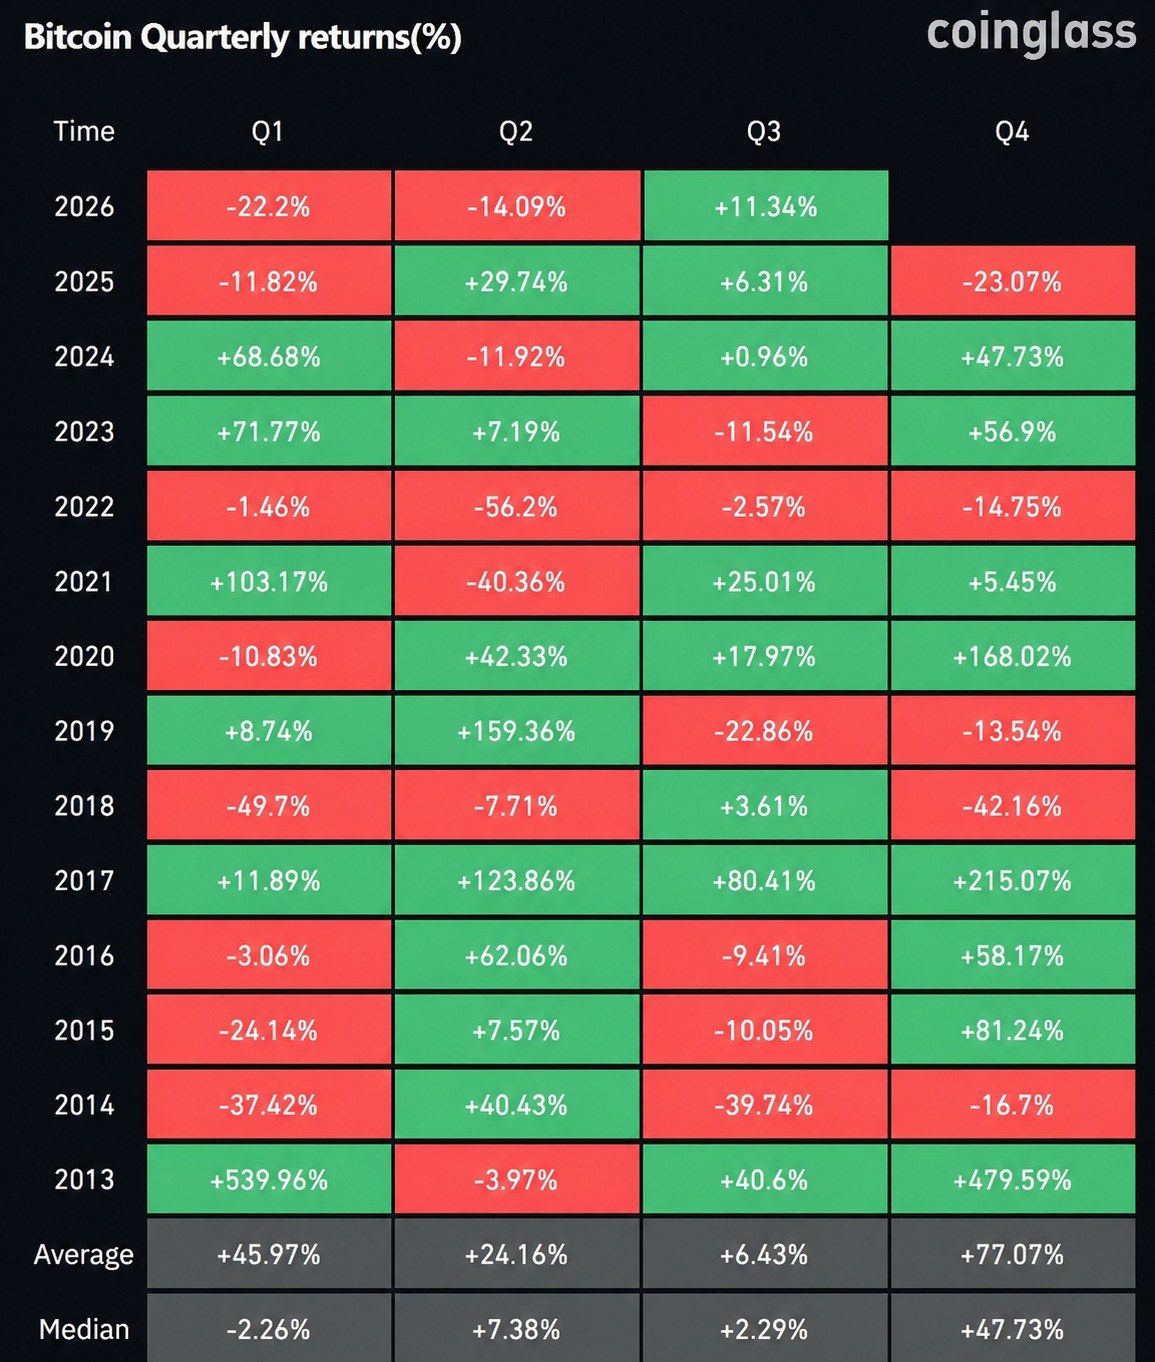
From that low, Bitcoin has significantly recovered to date, and according to quarterly return data tracked by Coinglass, it is up nearly 11% since the start of the quarter, marking its best third-quarter performance since 2021, when Bitcoin gained roughly 25% over the same three-month period.
Most of the Growth Occurred in July
The majority of the third-quarter growth occurred in July alone, with Bitcoin gaining about 9.8% for the month—its best 30-day performance in roughly a year. A notable feature of the July rally is that it was not ETF-driven, meaning unlike previous recoveries fueled by significant inflows into spot Bitcoin exchange-traded funds, this rise occurred largely 'without Wall Street's help,' indicating buying pressure came more from spot and derivatives markets than from a fresh wave of institutional investment.
Historically, rallies based on broad ETF accumulation have tended to attract sustained follow-on buying, while rallies more driven by short covering or weaker spot market demand can end more quickly once momentum fades. Bitcoin entered August around the $64,040 level and has since found support in the $64,500 range, currently trading above $65,000 as of last week (in a narrow but steady range compared to the sharp swings that characterized the second quarter).
Miners Set Lower and Upper Bounds
The Bitcoin mining sector provides another gauge of the current market tension. Currently, with the asset price trading near the $63,500 mark, it is approaching miners' production cost, meaning further downside risks push some operations to breakeven or below. Historically, prices hovering near the miners' breakeven level have acted as an approximate lower bound, as forced selling from unprofitable miners typically tapers off, although this also dampens enthusiasm for a sharp rally continuation without a new catalyst emerging.
A more significant question hanging over the third-quarter rally is seasonality. Historically, August has been one of Bitcoin's weakest months: since 2013, the average August return is only +1.12%, while the median return is closer to -7.49%, reflecting how a few strong Augusts skew the average despite most years ending the month with negative performance.
Only two previous Augusts have shown standout growth (approximately +30% in 2013 and +13.8% in 2021), meaning historical data points more toward consolidation or correction than a continuation of July's gains.
Forecasts emerging ahead of August pointed toward a potential drop into the $55,000–$60,000 range by quarter-end, driven by deteriorating valuation metrics such as the MVRV Z-Score, which is sinking deeper into negative territory, amid broader macroeconomic uncertainty. If this scenario plays out, it would erase a significant portion of the current third-quarter gains before the quarter even concludes.
end-content