Bitcoin has remained under sustained pressure since losing the $70,000 level, entering a corrective phase that has gradually pushed price lower while defining a consolidation range just above the $63,000 zone. Momentum has weakened noticeably, with buyers struggling to regain control and volatility compressing as the market searches for direction. This range-bound behavior reflects a transitional phase rather than a confirmed trend reversal, as traders weigh macro uncertainty, liquidity conditions, and broader risk sentiment across digital assets.
Amid this backdrop, Bitcoin mining difficulty has recently rebounded following a brief dip. Mining difficulty adjusts roughly every two weeks to maintain consistent block production timing. When difficulty rises, it typically signals that more computational power — or hashrate — has returned to the network. Temporary drops can occur when external factors, such as weather disruptions, energy constraints, or operational shutdowns, force some miners offline.
The recent rebound, therefore, suggests renewed miner participation and sustained network resilience. Greater difficulty often indicates confidence among miners in Bitcoin’s long-term viability, as maintaining operations becomes more competitive and capital-intensive. However, it can also increase cost pressure on less efficient miners, potentially influencing short-term supply dynamics if some are forced to liquidate holdings to cover expenses.
Bitcoin Tests Key Support As Downtrend Pressure Persists
Bitcoin’s weekly chart shows a clear deterioration in momentum after losing the $70,000 level, with price now consolidating near the $63,000 zone. The structure reflects a sequence of lower highs since the late-2025 peak above $120,000, indicating that sellers remain dominant despite intermittent stabilization attempts.
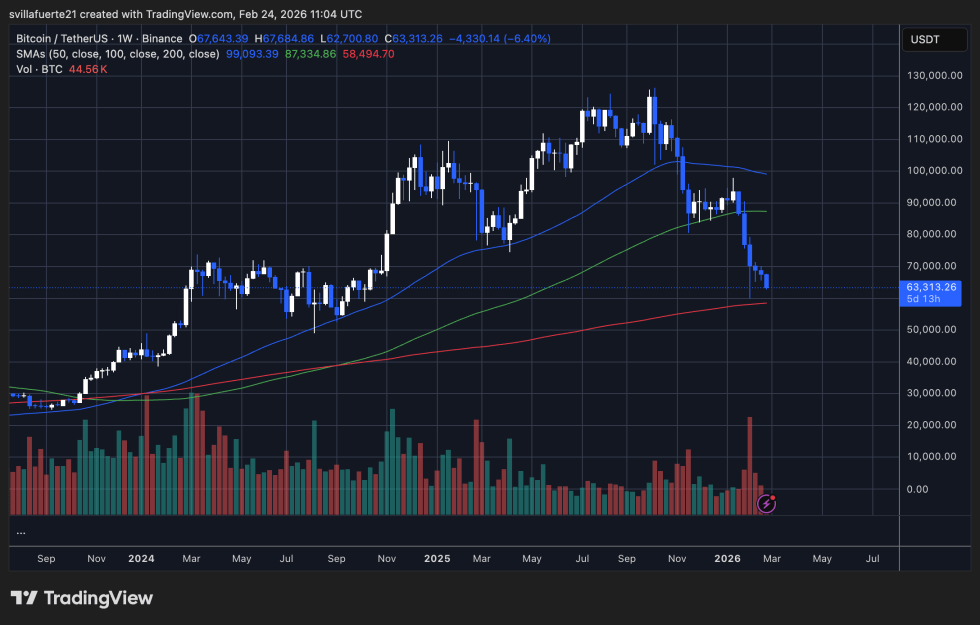
Technically, Bitcoin is trading below the 50-week and 100-week moving averages, both of which have shifted from support into dynamic resistance. This configuration typically signals a transitional or corrective phase rather than a confirmed bullish continuation. Meanwhile, the 200-week moving average — currently much lower — remains the long-term structural support reference.
Volume patterns also suggest caution. Selling activity increased during the latest decline, pointing to distribution rather than simple low-liquidity drift. However, recent candles show some compression in volatility, implying that the market may be attempting to establish a short-term base around current levels.
From a structural perspective, the $60,000–$63,000 region now acts as immediate support. A sustained break below it could expose deeper retracement zones toward the mid-$50,000 area. Conversely, reclaiming the $70,000 threshold would be necessary to restore bullish momentum and shift sentiment toward recovery.
Featured image from ChatGPT, chart from TradingView.com

Related Posts

BIP-110 Could Split Bitcoin In New Soft Fork Fight, Jameson Lopp Warns

Bitcoin Sees “Most Aggressive” Institutional Selling Ever, Analyst Says

Expert Trader Shares How Many Days Are Left Until Bitcoin Reaches A Bottom

State-Backed French Energy Giant Engie Eyes Bitcoin Mining

Bitcoin Dominance To Experience Major Crash? Pundit Shares What This Would Mean