Hello everyone, I'm Cody, a guest analyst for Odaily.
Last week, our market predictions for HYPE and BTC were once again validated by the market—HYPE stopped falling and rebounded near the low point of the IV wave, while BTC maintained a wide-range volatile consolidation pattern, closely matching our previous forecasts.
This week, the market has reached a point that requires patience rather than impulse. We will continue to analyze HYPE and BTC, focusing on this week's entry timing and operational strategies.
Welcome to join our Odaily market discussion group, where I will share daily market commentary and short-term insights, and engage in real-time discussions about market dynamics with everyone.
Summary of this week's core trading views:
• Analysis of HYPE's multi-cycle trend structure.
• Full-cycle tracking of HYPE's market dynamics evolution.
• This week's market prediction and short-term trading strategy for HYPE.
• Analysis of BTC's current trend structure.
• This week's market prediction and medium- to short-term trading strategies for BTC.
Market validation of trading strategies and core views:
• HYPE short-term trading performance: Two short-term long positions (1x leverage) were executed last week, achieving a cumulative return of approximately 9.02%. (Details in Table 1)
• Validation of HYPE market trend prediction: In last week's article, we indicated that HYPE's IV wave adjustment might end near the low of $34.44 on April 2, followed by an upward trend. Our core task last week was to capture the right-side long entry point. The current market movement validates our previous view, with last week's rebound reaching a high of $43.18.
• Validation of BTC medium-term trading performance: Following the established medium-term strategy, Bitcoin continued to hold the short position opened at $89,000 (1x leverage). As of last week's close (approximately $70,742), the profit was about 20.51%, with a maximum profit of about 32.58% during the period. (Details in Part Six)
• Validation of BTC market trend prediction: In last week's article, we indicated that the market would maintain a wide-range volatile consolidation pattern. The current market movement validates our previous forecast.
I. HYPE: Trend Structure Analysis
1. HYPE Daily Level Trend Structure Division: (Based on market evolution after January 21)
HYPE_Daily K-line Chart
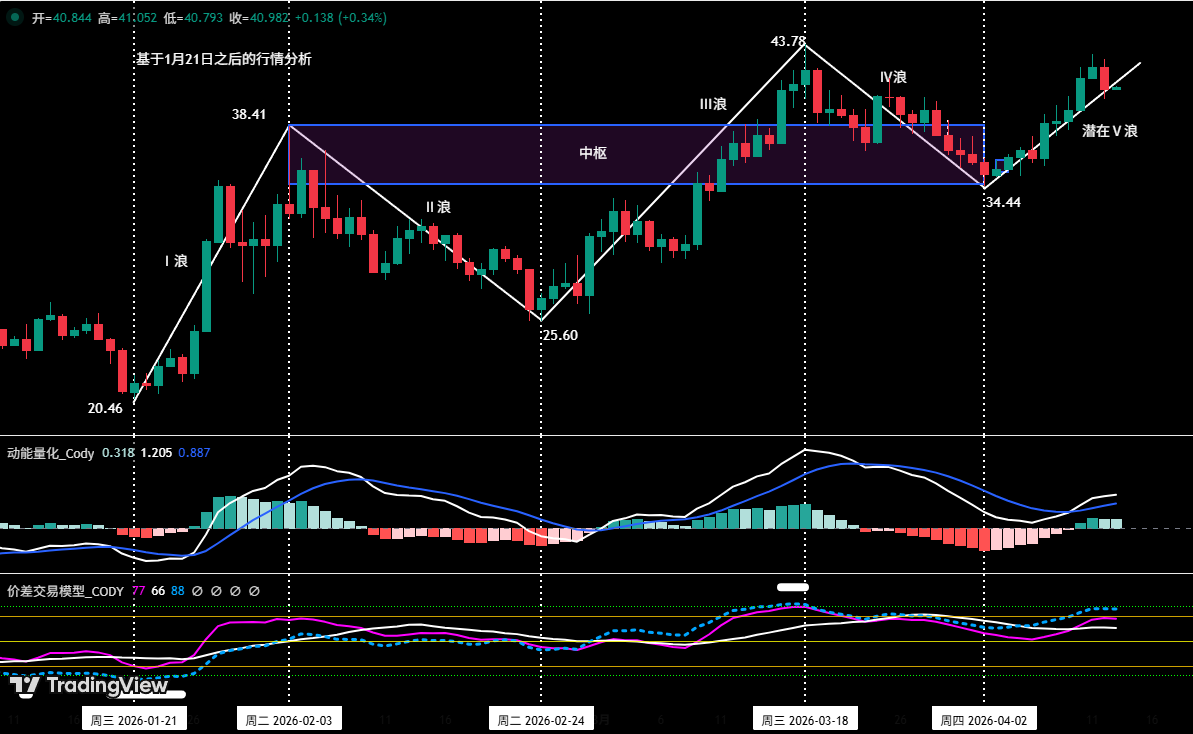
Figure 1
As shown in (Figure 1):
• Wave I (Impulse Wave): From the low of $20.46 on January 21 to the high of $38.41 on February 3, lasting 14 days, with a maximum increase of 87.73%.
• Wave II (Corrective Wave): From the high of $38.41 on February 3 to the low of $25.60 on February 24, lasting 20 days, with a maximum decline of 33.35%.
• Wave III (Main Upward Wave): From the low of $25.60 on February 24 to the high of $43.78 on March 18, lasting 23 days, with a maximum increase of 71.02%.
• Wave IV (Corrective Wave): From the high of $43.78 on March 18 to the low of $34.44 on April 2, lasting 15 days, with a maximum decline of 21.33%.
• Potential Wave V (Impulse Wave): From the low of $34.44 on April 2 to the present, it has been running for 10 days, with a maximum increase of 25.38%. Since the current price has not yet broken through the high of Wave III ($38.41), this movement is still in the potential Wave V stage.
2. Full-Cycle Tracking of HYPE Market Dynamics Evolution
• Weekly Review on February 23: First indicated that HYPE might enter an investment window, noting that the market was in the Wave II correction phase and predicting the potential start of the Wave III main upward trend.
• Weekly Review on March 3: Determined that the low of $25.60 on February 24 might be the starting point of Wave III, confirming the potential location of trend reversal.
• Weekly Review on March 9: Noted that the price had effectively broken through multiple moving average resistances at the daily level, subsequently entering a consolidation phase, expected to be followed by a rapid rise after completion.
• Weekly Review on March 16: Indicated that the market was in the Wave III trend, constructing an upward中枢 (i.e.,中枢 B). Predicted that after completion, it would likely experience wide-range volatile consolidation.
• Weekly Review on March 30: Noted that the overall market structure was still in a daily level upward trend, with the price then in the Wave IV adjustment phase, confirming the breakout and retest of the Wave I top and bottom ($38.41).
• Weekly Review on April 6: Indicated that the market's Wave IV adjustment might have ended at the low of $34.44 on April 2, and that the Wave V upward phase might follow.
3. In-Depth Deconstruction of HYPE's Current Trend Structure (Using 4-hour as the analysis cycle)
HYPE_4-hour K-line Chart
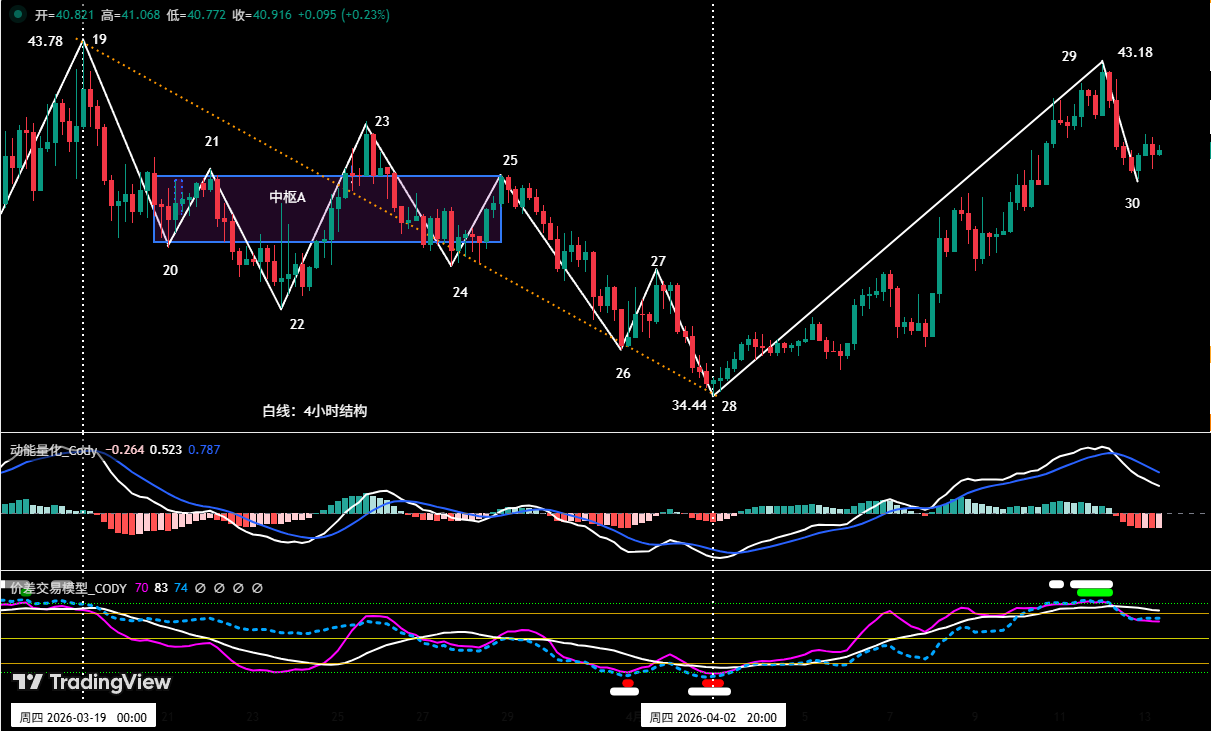
Figure 2
• Division of the potential Wave V upward trend structure based on the low of $34.44 on April 2.
• As shown in (Figure 2), the potential Wave V can be subdivided into: between endpoint 28 and endpoint 30, consisting of 2 segments: 28-29 and 29-30.
• The market is currently running segment 29-30. The chart shows that, from our self-built spread trading model, endpoint 29 triggered a top warning signal (green and white dots in the chart), indicating that technical indicators are in an overbought state, with short-term consolidation adjustment needs.
II. HYPE: This Week's Market Prediction and Short-Term Trading Strategy
1. HYPE This Week's Market Trend Prediction:
• This week's market prediction: As shown in (Figure 2), since the low on April 2, HYPE has been rising continuously for 10 days, very close to the previous Wave III high of $43.78. From the 4-hour chart, short-term technical indicators show overbought signals, indicating a risk of consolidation at the beginning of the week. Investors are advised to avoid blindly chasing highs, patiently wait for low absorption opportunities after the washout ends and the trend stabilizes, and strictly set stop losses.
2. HYPE This Week's Short-Term Trading Strategy:
• Based on the prediction of the overall upward trend, the strategy of "follow the trend, buy on dips" should be followed.
• According to the signals from our self-built quantitative model, use the 30-minute/60-minute cycle as the operation period, utilizing 30% of the position to capture long entry opportunities.
• Entry strategy: HYPE faces adjustment needs at the beginning of the week. If the price retraces to the key support area of $37.5~$38 and shows signals of stabilizing above the support, combined with the bottom buy signals triggered by the two models, consider entering long positions, and strictly set stop losses.
III. Bitcoin: Analysis of Volatile Trend Structure
Bitcoin _4-hour K-line Chart
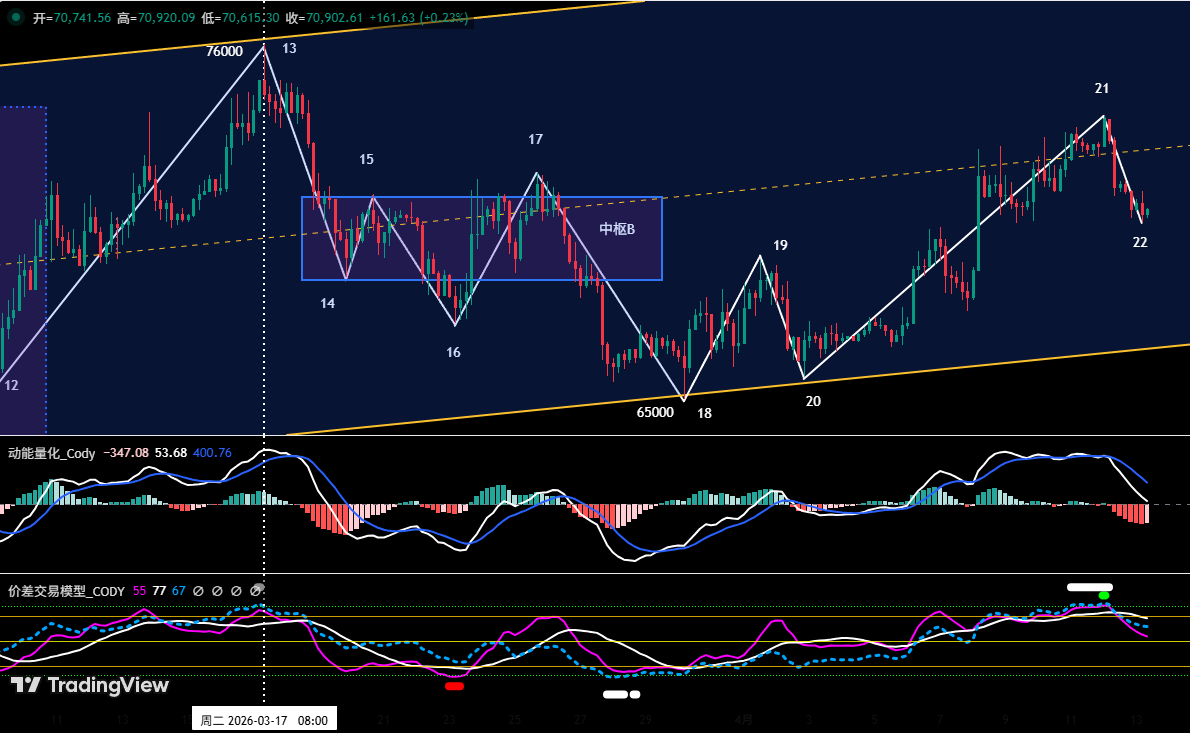
Figure 3
1. Based on market evolution after the low of $65,000 on March 30.
2. As shown in (Figure 3), BTC started a volatile upward movement since the low on March 30. From endpoint 18 to endpoint 22, it consists of 4 segments: 18-19, 19-20, 20-21, and 21-22.
3. Currently, segment 21-22 is running. The chart shows that, from our self-built spread trading model, a top warning signal was triggered near endpoint 21 (green and white dots in the chart), indicating that technical indicators are in an overbought state, while facing the key resistance level of $74,500. Therefore, the market has short-term needs for下跌震荡调整 (decline and consolidation adjustment).
IV. Bitcoin: This Week's Market Prediction and Trading Strategy
1. BTC This Week's Market Trend Prediction:
• Core view this week:
This week, it is expected to maintain a wide-range volatile consolidation between $65,000 and $74,000. The current price is retesting the support near the midline of the range and the key support level of $69,500. If this support holds, the market will maintain a strong consolidation structure: if the support is effectively broken, the consolidation structure weakens, and the price may further test the key support near $65,000. Currently, the market is dominated by news, with sensitive and unclear sentiment. Investors are advised to mainly观望 (watch and wait) for now.
2. Core Resistance Levels:
• First resistance area: $74,500~$76,000 region (near the low of April 2025)
• Second resistance area: $79,000~$80,600 region (near the low of November 2025)
3. Core Support Levels:
• First support level: near $69,500 (previous important support level)
• Second support level: $65,000~$66,000 region (near the lower轨 of the consolidation range)
• Third support level: $60,000~$62,500 region (near the low of February 6)
4. This Week's Trading Strategy (excluding突发消息影响 sudden news impact): (04.13~04.19)
1. Medium-term strategy:
Bitcoin _ Daily K-line Chart: (Position Monitoring Model)
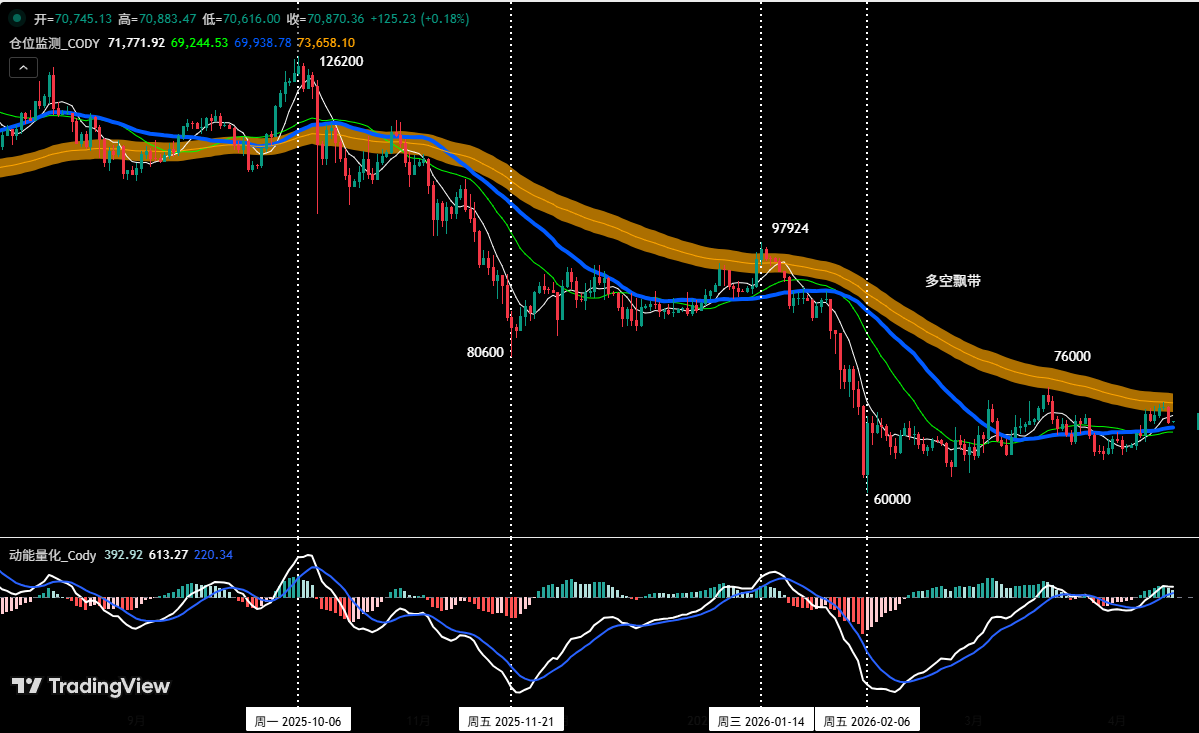
Figure 4
Position Monitoring Model: As shown in (Figure 4), the current price is below the bull-bear ribbon (yellow), and the bearish trend continues. According to the strategy rules, we continue to hold the 60% short position established at $89,000 (January 28).
• If the price反弹 (rebounds) and effectively breaks through the bull-bear ribbon and stabilizes above it, clear all medium-term positions.
2. Short-term strategy: Use 30% of the position, set stop loss points, and look for "spread" opportunities based on support and resistance levels. (Use 30-minute/60-minute as the operation cycle).
3. Based on the prediction of the medium-term bearish trend, the principle of "follow the trend to go short" should be adhered to. To dynamically respond to the complex market changes and combined with the signals from our self-built trading model, we have formulated three short-term operation plans: A/B/C:
• Plan A: 反弹遇阻,逢高沽空 (Sell on rallies when encountering resistance).
• Entry: When the price反弹 (rebounds) to the $74,500~$76,000 area and triggers resistance signals combined with the model's top signals, establish a 30% short position.
• Risk control: Initial stop loss set above $76,500.
• Exit: When the price falls near important support levels and combined with model signals, gradually close positions to take profits.
• Plan B: Small position breakout short.
• Entry: When the price effectively breaks below the key support near $69,000, combined with the model's top signals,顺势 (follow the trend) to establish a 30% short position.
• Risk control: Initial stop loss set above $70,500.
• Exit: When falling to support levels and combined with model signals, gradually close positions to take profits.
• Plan C: Large position breakout short.
• Entry: When the price effectively breaks below the key support near $65,000, combined with the model's top signals,顺势 (follow the trend) to establish a 60% short position.
• Risk control: Initial stop loss for short positions set above $66,500.
• Exit: When falling to support levels and combined with model signals, gradually close positions to take profits.
V. HYPE : Operation Review
1. Short-Term Operation Review: (See Table 1)
Strictly following the operation plan, based on the trading signals from our self-built spread trading model and momentum quantitative model, we executed two short-term (long) operations last week, achieving a cumulative trading profit of 9.02%.
2. HYPE Short-Term Trading Details Summary: (Leverage*1)
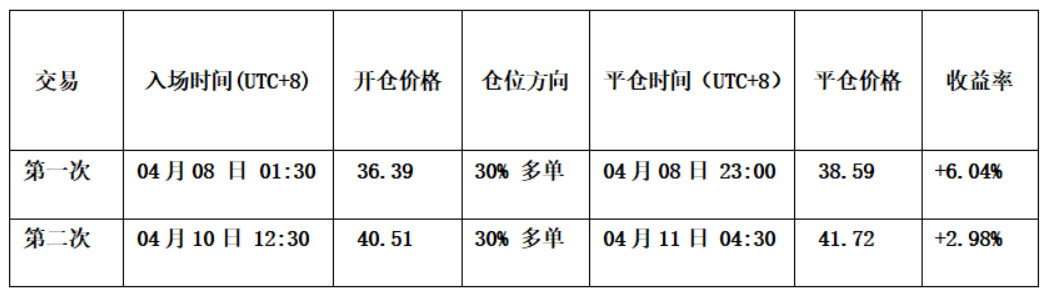
Table 1
3. First Short-Term Trade Review: (See Figure 5)
• Entry strategy: Based on the determination that the market's Wave IV adjustment ended near $34.44, combined with the bottom divergence signal from the momentum model and the spread trading model being at the bottom, we formulated a plan to buy on dips. Therefore, when the price retested this level and showed signs of stopping the fall and stabilizing, we established a 30% long position at $36.39.
• Exit strategy: When the price rose near $40 and encountered resistance, and the spread trading model triggered a strong top warning signal (green dot + white dot), we closed all positions near $38.59.
• Summary: This trade successfully profited approximately 6.04%.
3. Second Short-Term Trade Review: (See Figure 5)
• Entry strategy: When the price broke through the key resistance of $39.5 and successfully retested it, while the K-line formed a "bottom reversal" combination, combined with the two models发出共振上涨信号 (issuing共振上涨 signals). Therefore, we established a 30% long position at $40.51.
• Exit strategy: When the price rose near $43 and encountered resistance, and the spread trading model triggered a strong top warning signal (green dot + white dot), we closed all positions near $41.72.
• Summary: This trade successfully profited approximately 2.98%.
HYPE_30-minute K-line Chart: (Momentum Quantitative Model + Spread Trading Model)
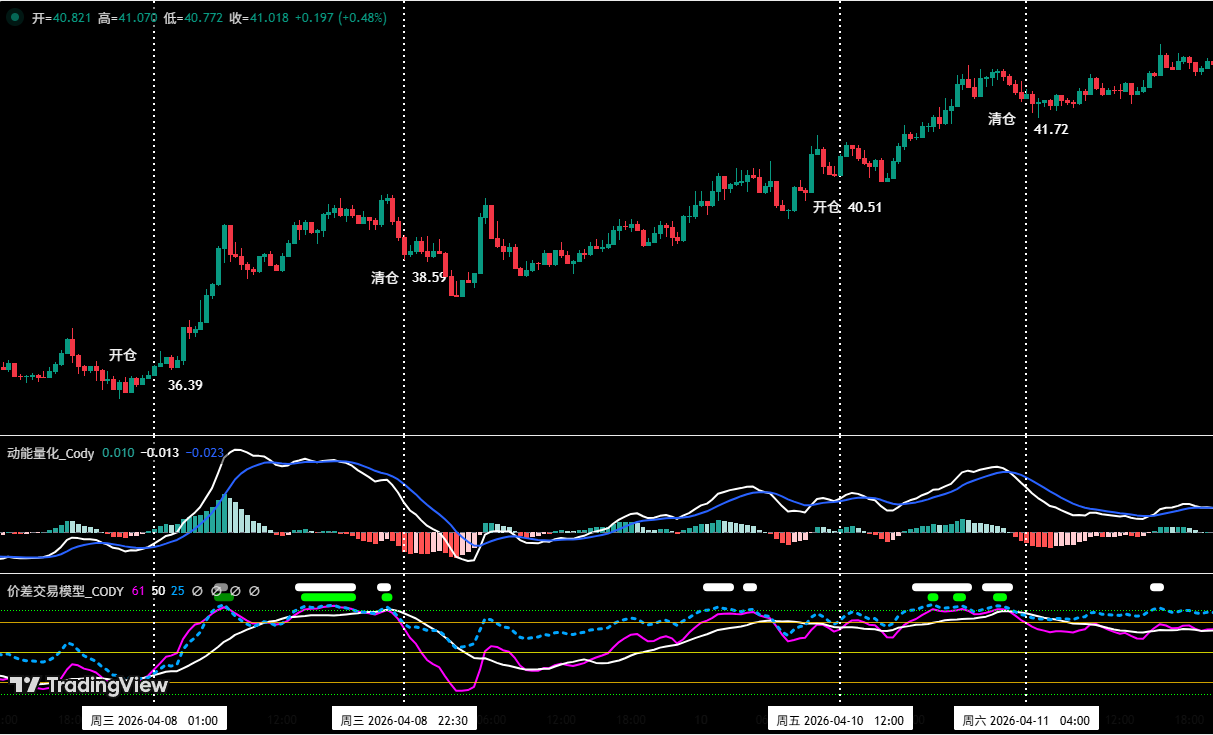
Figure 5 (Short-Term Trading Illustration)
VI. Special Notes:
1. When opening a position: Immediately set the initial stop loss.
2. When profit reaches 1%: Move the stop loss to the entry cost price (break-even point) to ensure capital safety.
3. When profit reaches 2%: Move the stop loss to the position of 1% profit.
4. Continuous tracking: Thereafter, for every additional 1% profit, move the stop loss同步 (synchronously) by 1%, dynamically protecting and locking in profits.
Financial markets change rapidly, all market analysis and trading strategies need to be adjusted dynamically. All views, analysis models, and operational strategies involved in this article are derived from personal technical analysis, for personal trading log purposes only, and do not constitute any investment advice or operational basis. The market has risks, investment needs caution, please do not make decisions based on this.
If you need daily market commentary and real-time communication, welcome to join the Odaily market discussion group, let's track the market and discuss strategies together.


















