Hello everyone, I'm Cody, a guest analyst at Odaily.
Last week, our market predictions for HYPE and BTC were once again validated by the market—HYPE stopped falling and rebounded near the low of wave IV, while BTC maintained a wide-range volatile consolidation pattern, highly consistent with our previous judgments.
This week, the market has reached a point that requires patience rather than impulse. We will continue to analyze HYPE and BTC, focusing on this week's entry timing and operational strategies.
Welcome to join our Odaily market sharing and exchange group, where I will share daily market reviews and short-term insights, and communicate market dynamics with everyone in real time.
Summary of this week's core trading views:
• Analysis of HYPE's multi-cycle trend structure.
• Full-cycle tracking of HYPE's market dynamics evolution.
• This week's market prediction and short-term trading strategy for HYPE.
• Analysis of BTC's current trend structure.
• This week's market prediction and medium- and short-term trading strategies for BTC.
Market verification of trading strategies and core views:
• HYPE short-term trading performance: Completed two short-term long positions (1x leverage) last week, achieving a cumulative return of approximately 9.02%. (Details in Table 1)
• Market verification of HYPE's trend prediction: In last week's article, we pointed out: HYPE's wave IV adjustment might end near the low of $34.44 on April 2, followed by an upward trend. Our core task last week was to capture the right-side long entry point. The current market movement validates our previous view, with last week's rebound reaching a high of $43.18.
• BTC medium-term trading performance verification: Bitcoin followed the established medium-term strategy last week, continuing to hold the short position established at $89,000 (1x leverage). As of last week's close (approximately $70,742), the gain was about 20.51%, with a maximum gain of about 32.58% during the period. (Details in Part Six)
• Market verification of BTC's trend prediction: In last week's article, we pointed out: The market will maintain a wide-range volatile consolidation pattern. The current market movement validates our previous prediction.
I. HYPE: Trend Structure Analysis
1. HYPE Daily Level Trend Structure Division:(Based on market evolution after January 21)
HYPE_ Daily K-line Chart
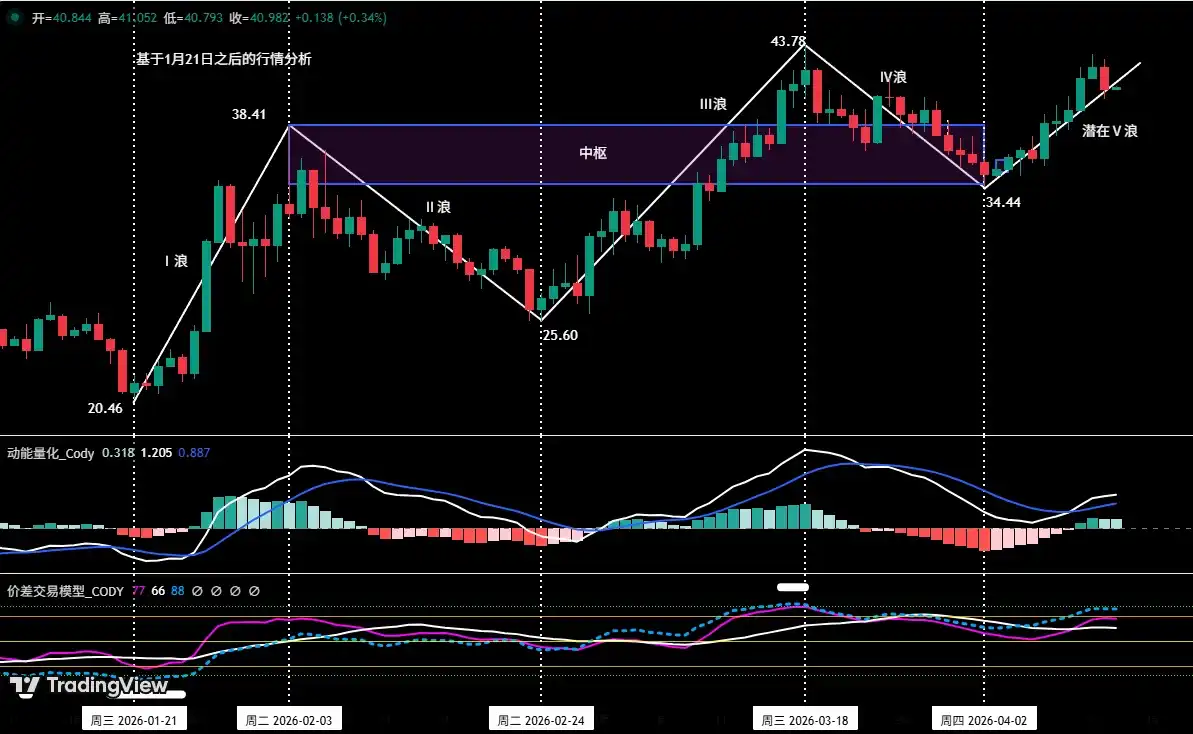
Figure 1
As shown in (Figure 1):
• Wave I (Impulse Wave): From the low of $20.46 on January 21 to the high of $38.41 on February 3, lasting 14 days, with a maximum increase of 87.73%.
• Wave II (Corrective Wave): From the high of $38.41 on February 3 to the low of $25.60 on February 24, lasting 20 days, with a maximum decline of 33.35%.
• Wave III (Main Rally Wave): From the low of $25.60 on February 24 to the high of $43.78 on March 18, lasting 23 days, with a maximum increase of 71.02%.
• Wave IV (Corrective Wave): From the high of $43.78 on March 18 to the low of $34.44 on April 2, lasting 15 days, with a maximum decline of 21.33%.
• Potential Wave V (Impulse Wave): From the low of $34.44 on April 2 to the present, it has run for 10 days, with a maximum increase of 25.38%. Since the current price has not yet broken through the high of Wave III ($38.41), this movement still belongs to the potential Wave V stage.
2. HYPE Market Dynamics Evolution Full Cycle Tracking
• February 23 Weekly Review: First indicated that HYPE might enter an investment window, pointing out that the market was in the Wave II correction stage and predicting that Wave III might start subsequently.
• March 3 Weekly Review: Judged that the low of $25.60 on February 24 might be the starting point of Wave III, confirming the potential position of trend reversal.
• March 9 Weekly Review: Pointed out that the price had effectively broken through multiple moving average resistance on the daily level, subsequently entering a retracement and consolidation stage, expected to be followed by a rapid rise after completion.
• March 16 Weekly Review: Indicated that the market was in Wave III trend, building a rising中枢 (i.e.,中枢 B). Predicted that after completion, it would likely experience wide-range volatile consolidation.
• March 30 Weekly Review: Pointed out that the overall market structure was still in a daily level uptrend, and the price was in the retracement confirmation stage after breaking through the top/bottom of Wave I ($38.41), i.e., the Wave IV adjustment stage.
• April 6 Weekly Review: Pointed out that the market's Wave IV adjustment might have ended at the low of $34.44 on April 2, and Wave V might follow.
3. In-depth Analysis of HYPE's Current Trend Structure (Using 4-hour as analysis cycle)
HYPE_4-hour K-line Chart
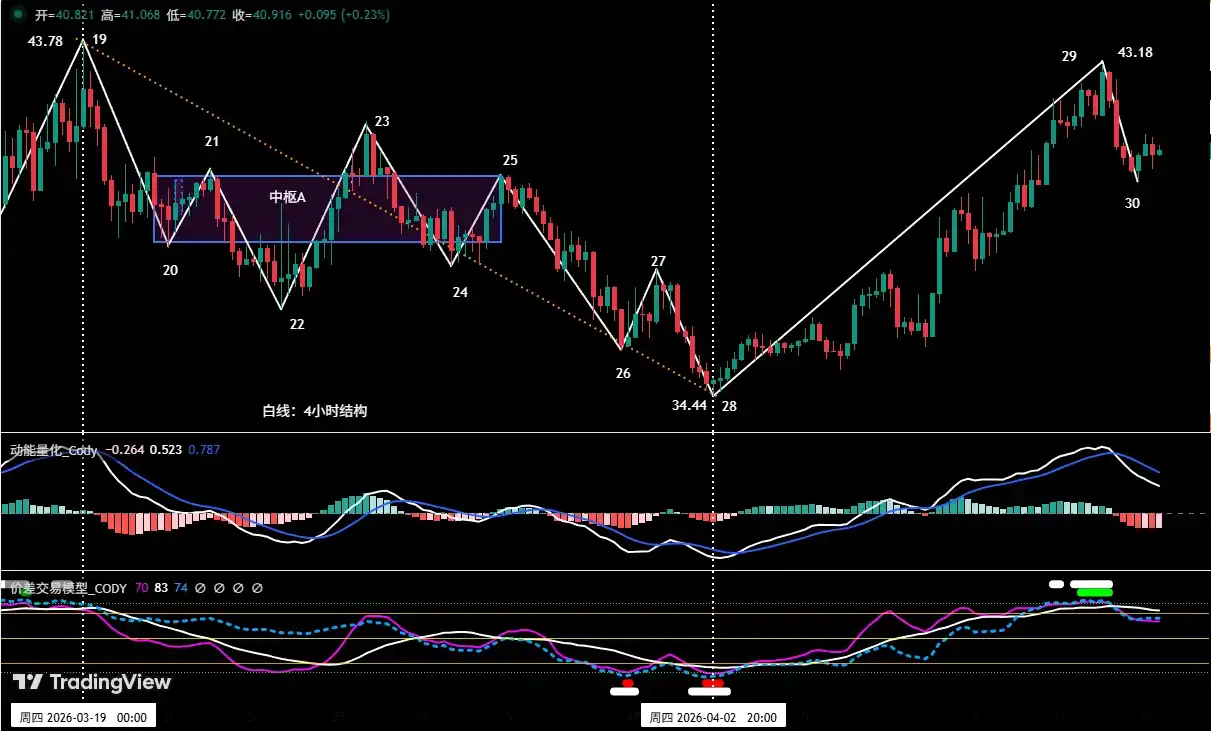
Figure 2
• Division of the potential Wave V upward trend structure based on the low of $34.44 on April 2.
• As shown in (Figure 2), the potential Wave V can be subdivided into: between endpoint 28 and endpoint 30, consisting of 2 segments: 28-29 and 29-30.
• The market is currently running segment 29-30. The chart shows that, from our self-built Spread Trading Model, endpoint 29 triggered a top warning signal (green and white dots in the chart), meaning technical indicators are in overbought territory, indicating short-term consolidation adjustment需求.
II. HYPE: This Week's Market Prediction and Short-term Trading Strategy
1. HYPE This Week's Market Trend Prediction:
• This Week's Market Prediction: As shown in (Figure 2), from the low on April 2 to now, HYPE has risen continuously for 10 days, very close to the previous Wave III high of $43.78. From the 4-hour chart, short-term technical indicators show overbought signals. There is a risk of consolidation at the beginning of this week.建议投资者避免盲目追高, 可以耐心等待洗盘结束、走势稳定后的低吸机会,并注意严格设置止损 (It is suggested that investors avoid chasing highs blindly, patiently wait for low absorption opportunities after the washout ends and the trend stabilizes, and pay attention to setting strict stop-loss).
2. HYPE This Week's Short-term Trading Strategy:
• Based on the prediction of the overall upward trend, the strategy of "follow the trend, buy on dips" should be followed.
• According to the signals of the self-built quantitative model, use the 30-minute/60-minute as the operation cycle, utilize 30% position to capture long entry opportunities.
• Entry strategy: HYPE faces adjustment需求 at the beginning of this week. If the price pulls back to the key support area of $37.5~$38 and shows signals confirming站稳支撑上方 (holding above support), combined with the bottom buy signals triggered by the two major models, consider entering long, and strictly set stop-loss.
III. Bitcoin: Analysis of Volatile Trend Structure
Bitcoin _4-hour K-line Chart
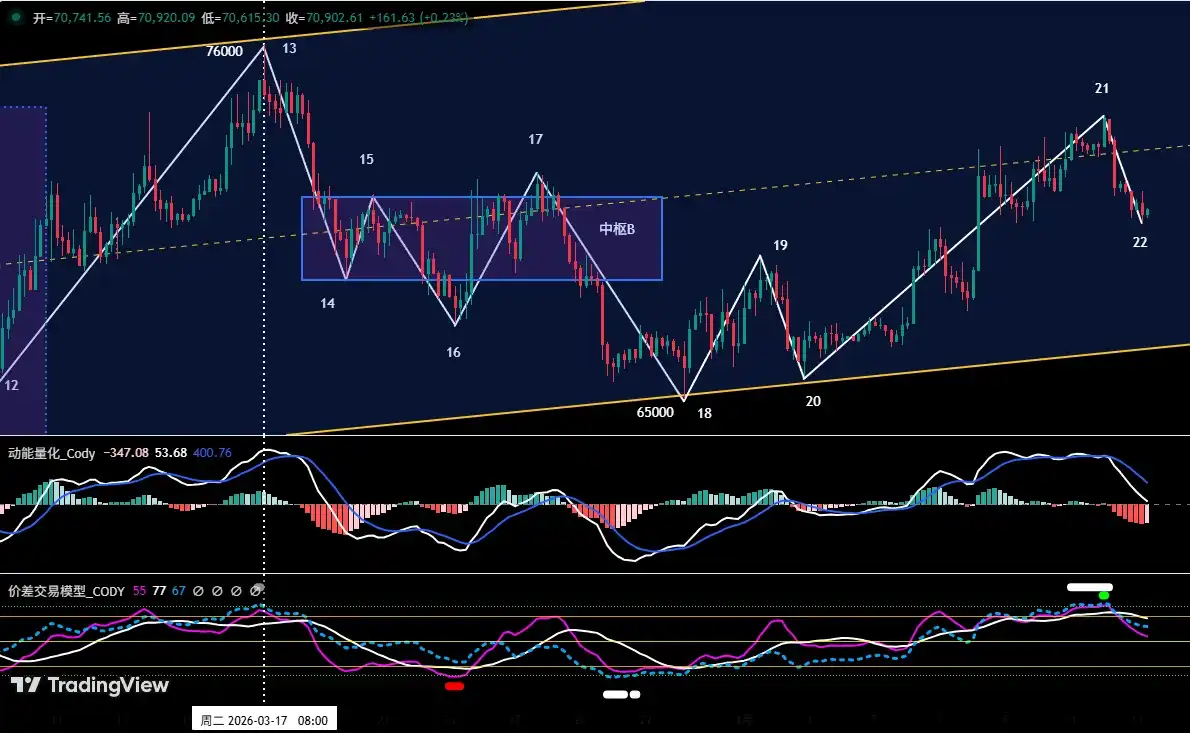
Figure 3
1. Based on the market evolution after the low of $65,000 on March 30.
2. As shown in (Figure 3), BTC started a volatile upward movement from the low of $65,000 on March 30. From endpoint 18 to endpoint 22, it consists of 4 segments: 18-19, 19-20, 20-21, 21-22.
3. Currently, segment 21-22 is running. The chart shows that, from our self-built Spread Trading Model, a top warning signal was triggered near endpoint 21 (green and white dots in the chart), meaning technical indicators are in overbought territory,同时面临 $74,500 key resistance level. Therefore, the market has a short-term demand for下跌震荡调整 (declining/consolidation adjustment).
IV. Bitcoin: This Week's Market Prediction and Trading Strategy
1. BTC This Week's Market Trend Prediction:
• Core view this week:
This week, it is expected to maintain a wide-range volatile consolidation between $65,000~$74,000. The current price is pulling back to test the support near the interval's central axis and key support level of $69,500. If this support holds有效, the market will maintain a strong consolidation structure: if the support is effectively broken, the consolidation structure weakens, and the price may further test the key support near $65,000. The market is currently dominated by news, sentiment is sensitive and direction is unclear.建议投资者暂以观望为主 (It is recommended that investors mainly观望 for now).
2. Core Resistance Levels:
• First resistance area: $74,500~$76,000 area (near the April 2025 low)
• Second resistance area: $79,000~$80,600 area (near the November 2025 low)
3. Core Support Levels:
• First support level: Near $69,500 (previous important support level)
• Second support level: $65,000~$66,000 area (near the lower轨 of the consolidation range)
• Third support level: $60,000~$62,500 area (near the February 6 low)
4. This Week's Trading Strategy (excluding突发消息影响 (sudden news influence)):(04.13~04.19)
1. Medium-term strategy:
Bitcoin _ Daily K-line Chart:(Position Monitoring Model)
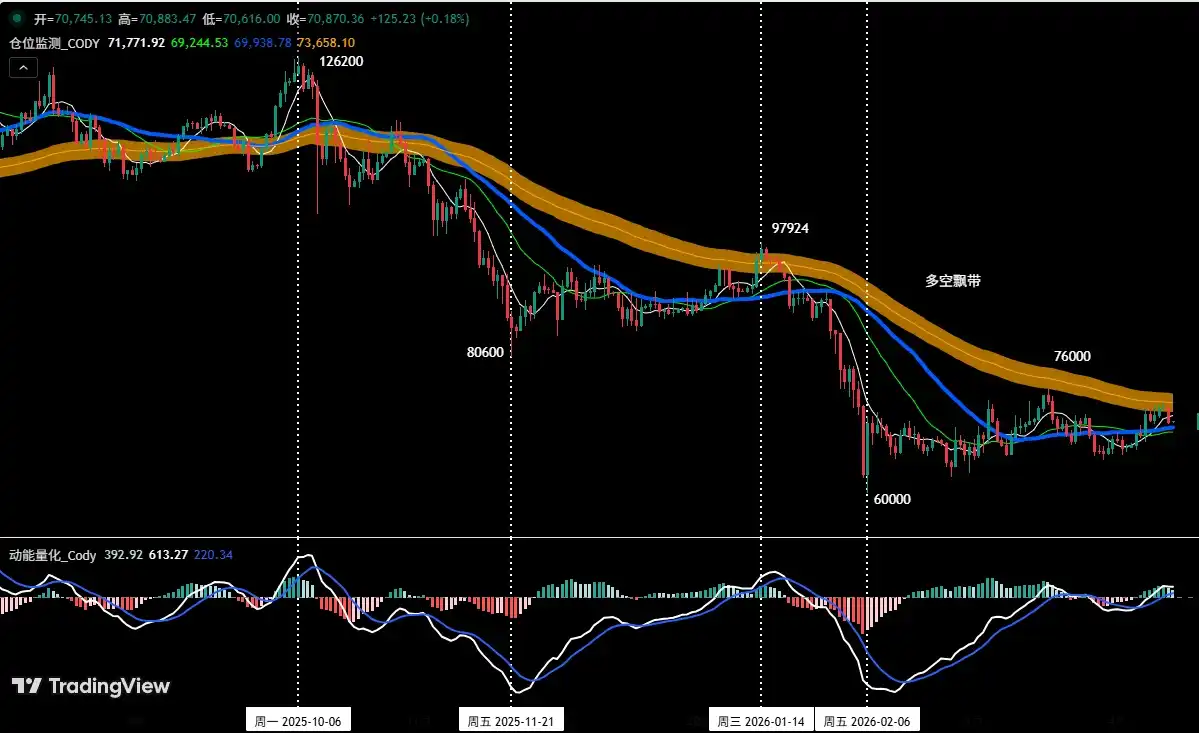
Figure 4
Position Monitoring Model: As shown in (Figure 4), the current price is below the Bull-Bear Ribbon (yellow), and the bearish trend continues. According to the strategy rules, we continue to hold the 60% short position established at $89,000 (January 28).
• If the price反弹有效突破多空飘带并站稳其上方 (rebounds, effectively breaks through the Bull-Bear Ribbon and stabilizes above it), clear all medium-term positions.
2. Short-term strategy: Use 30% position, set stop-loss points, based on support and resistance levels, look for "spread" opportunities. (Use 30-minute/60-minute as operation cycle).
3. Based on the prediction of the medium-term bearish trend, currently adhere to the principle of "follow the trend to go short". To dynamically respond to the complex market evolution and combined with the signals from the self-built trading model, we will formulate three short-term operation plans: A/B/C:
• Plan A: 反弹遇阻,逢高沽空 (Sell on rallies upon encountering resistance).
• Entry: When the price rebounds to the $74,500~$76,000 area, triggers resistance signals and combines with model top signals, establish a 30% short position.
• Risk Control: Initial stop-loss set above $76,500.
• Close Position: When the price falls near important support levels and combines with model signals, gradually close positions to take profits.
• Plan B: Small position breakout short.
• Entry: When the price effectively breaks below the key support near $69,000 and combines with model top signals,顺势建立 30%空头仓位 (follow the trend to establish a 30% short position).
• Risk Control: Initial stop-loss for short position set above $70,500.
• Close Position: When falling to support levels and combining with model signals, gradually close positions to take profits.
• Plan C: Large position breakout short.
• Entry: When the price effectively breaks below the key support near $65,000 and combines with model top signals,顺势建立 60%空头仓位 (follow the trend to establish a 60% short position).
• Risk Control: Initial stop-loss for short position set above $66,500.
• Close Position: When falling to support levels and combining with model signals, gradually close positions to take profits.
V. HYPE : Operation Review
1. Short-term Operation Review:(See Table 1)
We strictly followed the operation plan, based on the trading signals from our self-built Spread Trading Model and Momentum Quantitative Model, completed two short-term (long) operations last week, with cumulative trading profit of 9.02%.
2. HYPE Short-term Trading Details Summary:(Leverage*1x)
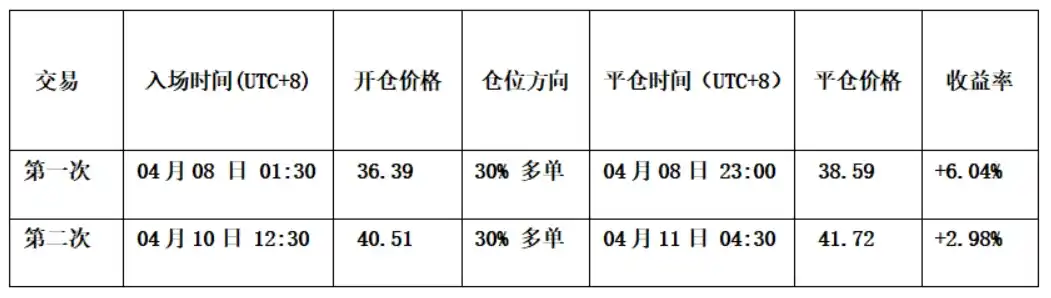
Table 1
3. First Short-term Trade Review:(See Figure 5)
• Entry Strategy: Based on the judgment that the market's Wave IV adjustment ended near $34.44, combined with the bottom divergence signal from the momentum model and the Spread Trading Model being at the bottom, we formulated a plan to buy on dips. Therefore, when the price pulled back to this position and showed signs of stopping the fall and stabilizing, we established a 30% long position at $36.39.
• Close Position Strategy: When the price rose near $40 and encountered resistance,同时价差交易模型触发强烈顶部预警信号 (and the Spread Trading Model triggered a strong top warning signal) (green dot + white dot), therefore, we closed all positions near $38.59.
• Summary: This trade successfully profited about 6.04%.
3. Second Short-term Trade Review:(See Figure 5)
• Entry Strategy: When the price broke through the key resistance of $39.5 and successfully pulled back, 同时 K 线出现“底分型”组合 (and the K-line showed a "bottom reversal" combination), combined with the two major models发出共振上涨信号 (issuing共振上涨 signals). Therefore, we established a 30% long position at $40.51.
• Close Position Strategy: When the price rose near $43 and encountered resistance,同时价差交易模型触发强烈顶部预警信号 (and the Spread Trading Model triggered a strong top warning signal (green dot + white dot)), therefore, we closed all positions near $41.72.
• Summary: This trade successfully profited about 2.98%.
HYPE_30-minute K-line Chart:(Momentum Quantitative Model+Spread Trading Model)
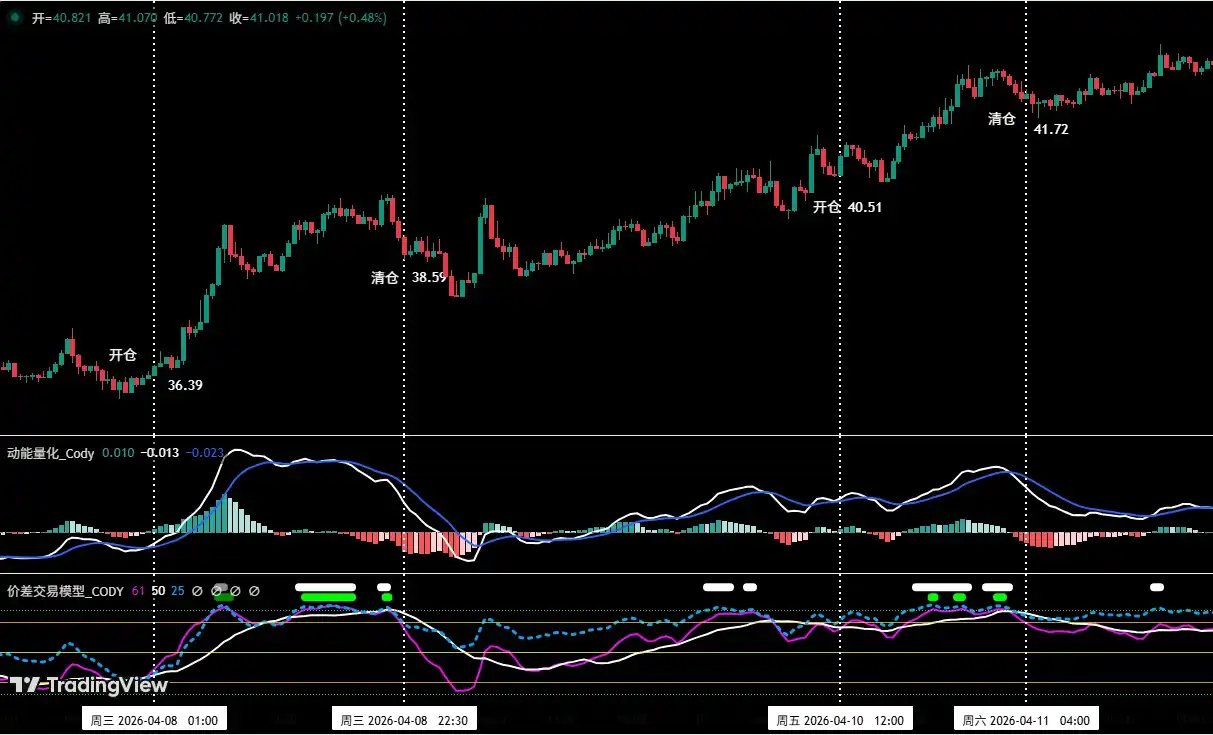
Figure 5 (Short-term Trading Illustration)
VI. Special Notes:
1. When opening a position: Immediately set the initial stop-loss level.
2. When profit reaches 1%: Move the stop-loss to the entry cost price (break-even point) to ensure capital safety.
3. When profit reaches 2%: Move the stop-loss to the position of 1% profit.
4. Continuous tracking: Thereafter, for every additional 1% profit, move the stop-loss同步移动 1% (synchronously by 1%), dynamically protecting and locking in profits.
Financial markets change rapidly, all market analysis and trading strategies need dynamic adjustment. All views, analysis models, and operational strategies involved in this article are derived from personal technical analysis, for personal trading log purposes only, and do not constitute any investment advice or operational basis. The market has risks, investment needs caution, please do not make decisions based on this.
If you need daily market reviews and real-time exchange, welcome to join the Odaily market sharing and exchange group. Let's track the market and discuss strategies together.