Bitcoin is once again attempting to reclaim the $90,000 level, as bulls cautiously rebuild a recovery narrative after weeks of volatility and heavy selling pressure. While sentiment remains fragile and many investors are still positioned defensively, recent price stabilization has opened the door for a short-term upside scenario. Rather than relying on optimism alone, analysts are increasingly pointing to structural indicators that suggest the balance of risk may be shifting.
According to a report by on-chain analyst Axel Adler, Bitcoin’s current setup shows tactical upside potential when viewed through the combined lens of market regime indicators and derivatives liquidation dynamics.
Adler highlights that Bitcoin’s Regime Score has recently transitioned into the +15 to +30 zone, a range that has historically delivered positive average returns. This zone represents an early recovery phase, where downside momentum has faded but euphoria has not yet returned, often creating favorable conditions for asymmetric upside.
At the same time, derivatives data show a clear dominance of short liquidations, meaning that recent price moves have forced bearish positions to close. This creates mechanical buying pressure, which can amplify upward moves even in the absence of strong spot demand. Together, these signals suggest that Bitcoin’s current attempt to reclaim $90,000 is not purely speculative but supported by an improving internal market structure.
Regime Score and Liquidations Point to Tactical Upside
Adler explains that Bitcoin’s composite Regime Score aggregates multiple market dimensions into a single framework, including taker imbalance, open interest pressure, funding rates, ETF flows, exchange flows, and price trend.
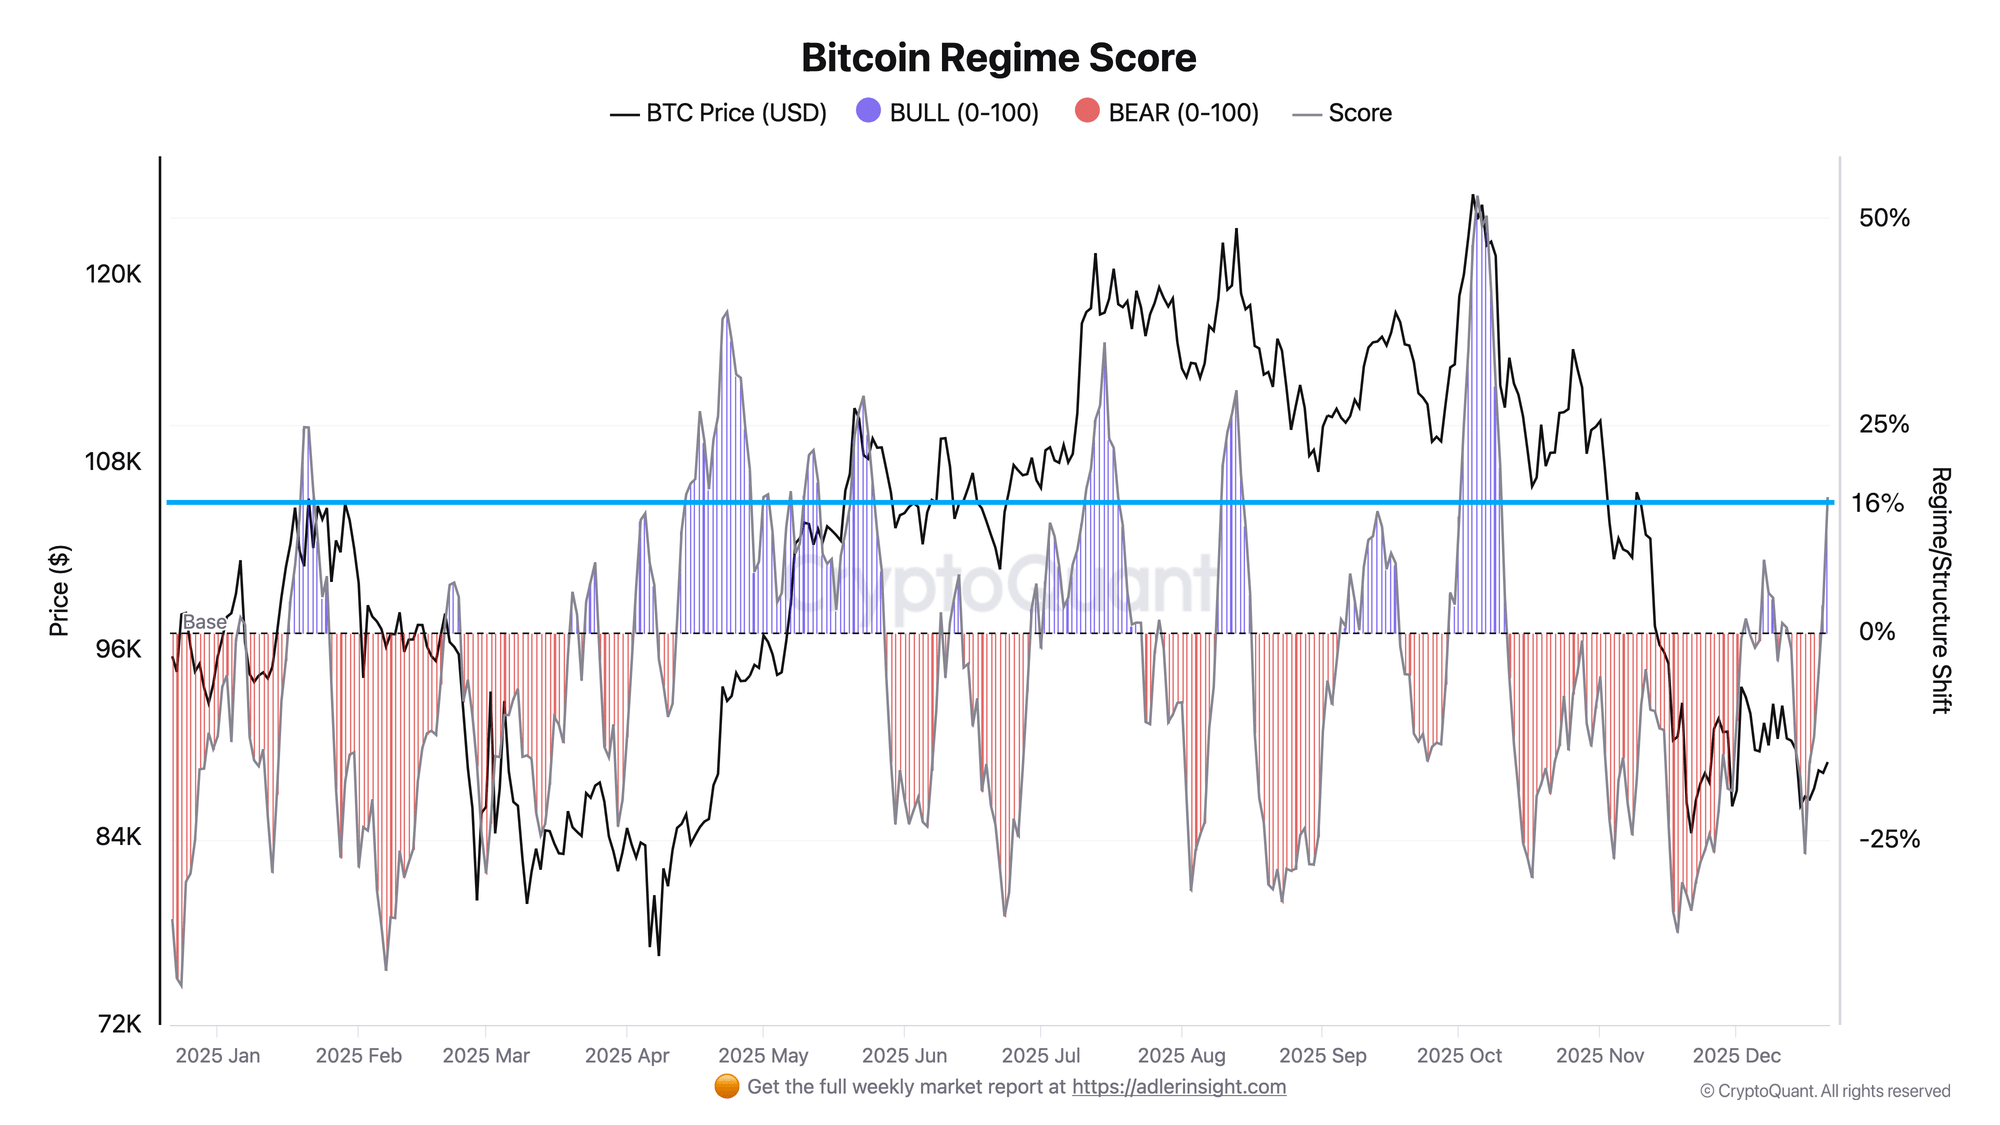
The result is a unified indicator ranging from −100 to +100, designed to capture shifts in market structure rather than short-term noise. Currently, the Regime Score stands at +16.3, placing Bitcoin in the upper part of the neutral zone, defined between +15 and +30.
Backtesting data for 2025 shows that this specific subzone has historically delivered average returns of around +3.8% over a 30-day horizon. This contrasts sharply with the −15 to 0 zone, where expected returns were negative, averaging -1.5% over seven days. Importantly, the indicator has recently rebounded from a bearish extreme, after dropping to −27 just a week ago, signaling a structural recovery rather than a random bounce.
Adler highlights a critical nuance: transitions into the formal bull regime above +30 have historically coincided with local tops, often followed by negative short-term returns. This makes the current +15–30 range more attractive for tactical positioning, while aggressive accumulation above +30 may carry elevated risk.
This view is reinforced by derivatives data. The long/short liquidation dominance oscillator has turned negative at −11%, indicating a surge in forced short closures, while its 30-day average remains positive. With long liquidation dominance at just 44%, short liquidations are clearly prevailing, providing additional mechanical fuel for upside.