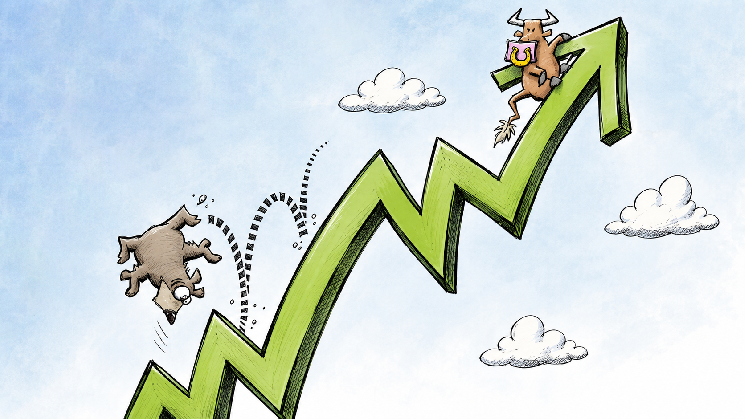
Bitcoin (BTC) Price Under Pressure: Is a Bearish Flag Flashing a Warning of a Slide to $70K?

TheNewsCryptoPubblicato 2025-12-09Pubblicato ultima volta 2025-12-09

Within the bear hold, the largest asset in the crypto market, Bitcoin (BTC), is stuck in the downside waves, lighting up the red candlesticks. Multiple rejections have been faced back-to-back, and are currently trading below the $95K. As of today, with the fear sentiment, BTC has posted a modest loss of over 1.12%.

The price movement in the early hours caused the asset to hit a high of $92,220.86. Later, the bearish fluctuations triggered BTC to fall to its bottom range of $89,586.98. As per the CMC data, at the time of writing, Bitcoin traded at around the $90,511.42 zone.

Besides, the market cap of the asset is resting at $1.8 trillion, and its daily trading volume has dropped and reached the $55.88 billion. As reported by the Coinglass data, the market has witnessed a liquidation of $54.95 million worth of Bitcoin in the last 24 hours.

The Ali chart has exhibited that the current structure on Bitcoin’s chart is forming a bearish flag. The price consolidates upward within a tight channel after a sharp drop, but fails to break higher. If BTC breaks below the lower trendline, the pattern projects a downside target. In this case, around $70K, based on the height of the preceding drop.

Is Bitcoin Preparing for an Extended Bear Grip?

Both the Moving Average Convergence Divergence (MACD) line and the signal line are positioned below the zero line, which indicates Bitcoin’s broader bearish phase. The downside pressure will continue to dominate unless the lines rise back above the zero line.

In addition, the Chaikin Money Flow (CMF) indicator value found at 0.15 suggests moderate buying pressure in the BTC market. The money is flowing into the asset, not strongly, but it hints at a positive shift in demand and may support further upside.

The 4-hour trading session of Bitcoin shows bearish sentiment, with the price might slip to the key support at $90,472. Further correction on the downside could easily push for the death cross emergence, and the bears would send the price below the $90.3K mark.

Conversely, if the bulls appeared, the price could move up toward the $90,612 resistance range. A golden cross might take place with the strengthened upside pressure. Gradually, the bulls likely drive the BTC price to its recent high, above the $90.7K zone.

Bitcoin’s daily Relative Strength Index (RSI) is at 50.54, in the neutral zone — neither overbought nor oversold. With the balanced momentum, the price could swing in either direction. Moreover, BTC’s Bull Bear Power (BBP) of -31.33 signals that bears currently have control. The selling pressure is strong, pushing the price below, and the trend will lean more bearish unless momentum shifts.

Top Updated Crypto News

Zcash (ZEC) Rockets Up 14%: Is Crucial Resistance Lurking Ahead?

TagsBitcoinBTCBTC priceCryptocurrency

Crypto di tendenza

Letture associate

RWA Tokenization Enters the Next Phase: What is the Truly Time-Consuming Advantage to Build?

The article argues that as tokenization frameworks for Real-World Assets (RWA) mature, the ability to issue assets is becoming less of a competitive advantage. The focus is shifting to what happens *after* issuance: which RWA operations can build enduring trust, maintain stable operations, and remain integrated into the financial ecosystem over the long term. The piece introduces the concept of a **Reserve Layer**—infrastructure that connects tokenized assets to the necessary verification, liquidity, and operational systems for on-chain finance. For an asset to serve as a reliable reserve (e.g., short-term U.S. Treasuries, gold), it needs predictable value, standardized features, deep markets, and observable pricing. However, the true, hard-to-replicate advantage lies not just in the underlying asset but in the **operational track record** built over time. This includes consistent reserve management, independent audits, successful redemptions, maintained liquidity, and protocol integrations. Each successful operation adds evidence, creating a reinforcing cycle: more evidence builds stronger institutional confidence, leading to wider distribution, deeper liquidity, and more use cases as collateral. The article presents a framework combining two dimensions: an asset's suitability as a reserve and the issuer's operational capability. The most sustainable model combines **high-quality reserve assets with strong, long-term operational discipline**. A critical blind spot is an asset with high reserve suitability (like gold) issued by an entity with a limited operational track record; the quality of the infrastructure is separate from the quality of the asset itself. In conclusion, the next phase of RWA will be defined by participants who can pair appropriate reserve assets with the operational rigor to support them through market cycles, thereby transforming tokenized RWAs into durable financial infrastructure.

marsbit33 min fa

RWA Tokenization Enters the Next Phase: What is the Truly Time-Consuming Advantage to Build?

marsbit33 min fa

Trading

Spot

Articoli Popolari

Cosa è KR200

Il KOSPI 200 è l'indice di riferimento delle blue-chip della Corea del Sud, che traccia le prime 200 azioni a grande capitalizzazione e alta liquidità quotate sulla Korea Exchange (KRX). Comprende leader di settore come Samsung e SK Hynix e funge da principale sottostante per i derivati azionari coreani e per il benchmarking istituzionale globale.

38 Totale visualizzazioniPubblicato il 2026.08.19Aggiornato il 2026.08.19

Cosa è KR200

Come comprare KR200

Benvenuto in HTX.com! Abbiamo reso l'acquisto di KOSPI 200 (KR200) semplice e conveniente. Segui la nostra guida passo passo per intraprendere il tuo viaggio nel mondo delle criptovalute.Step 1: Crea il tuo Account HTXUsa la tua email o numero di telefono per registrarti il tuo account gratuito su HTX. Vivi un'esperienza facile e sblocca tutte le funzionalità,Crea il mio accountStep 2: Vai in Acquista crypto e seleziona il tuo metodo di pagamentoCarta di credito/debito: utilizza la tua Visa o Mastercard per acquistare immediatamente KOSPI 200KR200.Bilancio: Usa i fondi dal bilancio del tuo account HTX per fare trading senza problemi.Terze parti: abbiamo aggiunto metodi di pagamento molto utilizzati come Google Pay e Apple Pay per maggiore comodità.P2P: Fai trading direttamente con altri utenti HTX.Over-the-Counter (OTC): Offriamo servizi su misura e tassi di cambio competitivi per i trader.Step 3: Conserva KOSPI 200 (KR200)Dopo aver acquistato KOSPI 200 (KR200), conserva nel tuo account HTX. In alternativa, puoi inviare tramite trasferimento blockchain o scambiare per altre criptovalute.Step 4: Scambia KOSPI 200 (KR200)Scambia facilmente KOSPI 200 (KR200) nel mercato spot di HTX. Accedi al tuo account, seleziona la tua coppia di trading, esegui le tue operazioni e monitora in tempo reale. Offriamo un'esperienza user-friendly sia per chi ha appena iniziato che per i trader più esperti.

42 Totale visualizzazioniPubblicato il 2026.08.19Aggiornato il 2026.08.19

Come comprare KR200

Cosa è SKDD

Progettato per fornire rendimenti inversi a leva -2x dei movimenti giornalieri del prezzo delle azioni di SK Hynix, questo è un ETF a leva corta per un giorno sotto GraniteShares. È adatto per investitori con una prospettiva ribassista a breve termine su SK Hynix per allocazione tattica.

95 Totale visualizzazioniPubblicato il 2026.08.19Aggiornato il 2026.08.19

Cosa è SKDD

Discussioni

Benvenuto nella Community HTX. Qui puoi rimanere informato sugli ultimi sviluppi della piattaforma e accedere ad approfondimenti esperti sul mercato. Le opinioni degli utenti sul prezzo di A A sono presentate come di seguito.

活动图片