Bear Market Script: Which Act Is Your 'Faith' Experiencing?

marsbitPubblicato 2026-03-05Pubblicato ultima volta 2026-03-05

Introduzione

The article "Bear Market Script: Which Act Is Your 'Faith' Experiencing?" by TVBee analyzes the typical stages of a cryptocurrency bear market, using Bitcoin (BTC) and Tether (USDT) market capitalization as key indicators. It identifies 3-4 phases: 1. **Reaction Phase (Faith Intact)**: BTC declines while USDT rises, indicating some investors still hold hope. 2. **Confirmation Phase (Faith Collapses)**: BTC may fall or stagnate, and USDT decreases, confirming the bear market as capital exits. 3. **Accumulation Phase (Faith Consolidates)**: BTC may drop or trade sideways, but USDT rises again, suggesting stronger believers are preparing to re-enter. 4. **Final Panic Phase (Black Swan)**: A optional phase where both BTC and USDT fall sharply due to extreme events (e.g., 2022’s Luna collapse). The author suggests the current market (early 2026) is likely in Phase 2, driven by geopolitical tensions like the Iran conflict. The duration of this phase depends on external factors such as Trump administration policies, monetary changes, and potential black swan events. Ideal entry points for investors are during Phase 3 (USDT rising) or in the recovery phase (right-side entry), where USDT growth and BTC stabilization signal a market rebound. The analysis notes that bear markets are evolving—Phase 1 is shortening, but Phase 2 remains unpredictable due to external shocks. Caution and patience are advised.

Author: TVBee

The 3-4 Stages of a Bear Market Experience

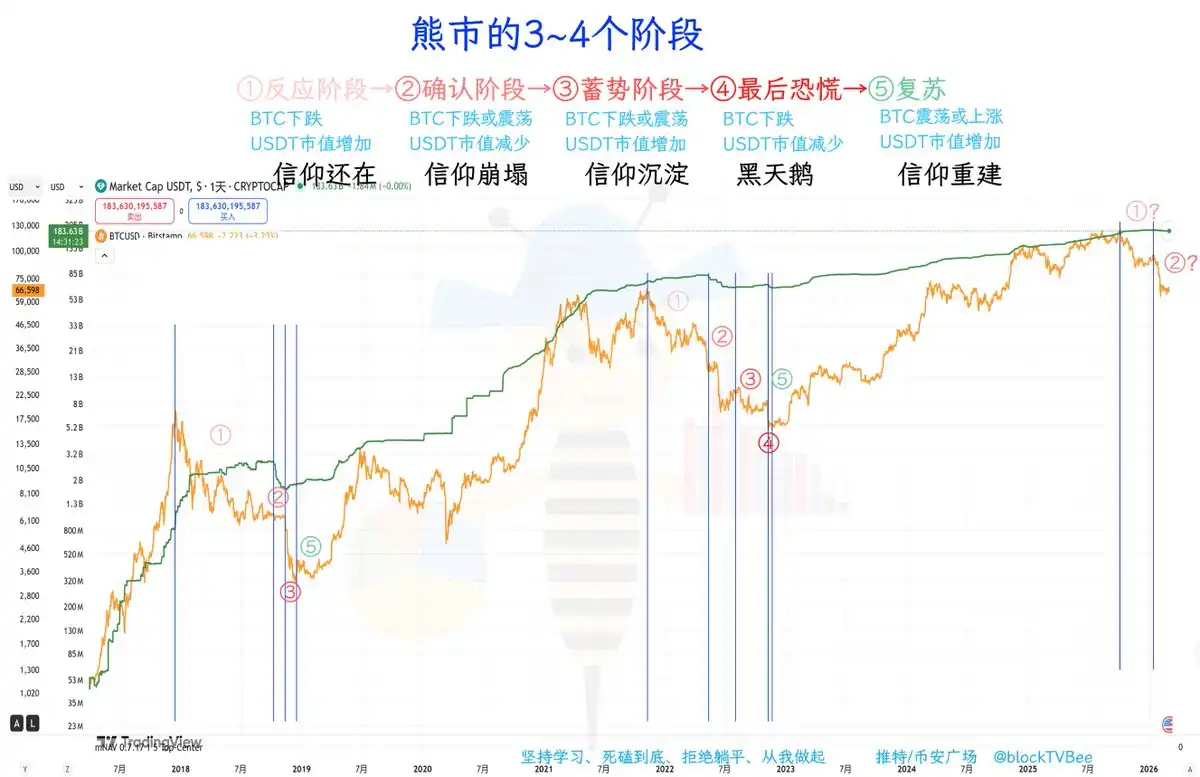
Bear Market Stage 1: Reaction Phase (Faith Remains)

⬩Approx. Dec 16, 2017 ~ Oct 08, 2018

⬩Approx. Nov 07, 2021 ~ May 12, 2022

⬩Suspected Oct 06, 2025 ~ Jan 06, 2026

In this stage, BTC is falling, but the market cap of USDT is rising.

Funds flowing out of crypto are still accumulating partly in USDT; some people likely hold illusions about the market trend. This is the market's reaction phase to the bear market, the stage where faith still remains.

It is suspected that Oct 06, 2025 ~ Jan 06, 2026 completed this stage.

Bear Market Stage 2: Confirmation Phase (Faith Collapses)

⬩Approx. Oct 08, 2018 ~ Nov 14, 2018

⬩Approx. May 12, 2022 ~ Aug 04, 2022

⬩Suspected Jan 06, 2026 ~ ?

In this stage, BTC may be falling or moving sideways, but the market cap of USDT is decreasing.

Funds flowing out of crypto are now exiting USDT; the market confirms the bear market, and capital begins to exit as the main trend. This is also the stage where faith collapses.

2018 had no major negative events, so BTC moved mainly sideways, while 2022 had Luna + Three Arrows, so BTC fell primarily.

It is suspected that Jan 06, 2026 began entering this stage, with the USDT market cap starting to decrease, and the market beginning to question BTC, its digital gold properties, believing BTC will fall to the 30k range......

However, there are currently no signs that Stage 2 has ended.

Bear Market Stage 3: Accumulation Phase (Faith Sediments)

⬩Approx. Nov 14, 2018 ~ Dec 15, 2018

⬩Approx. Aug 04, 2022 ~ Nov 09, 2022

In this stage, BTC may be falling or moving sideways, but the market cap of USDT is increasing.

In 2018, because the previous phase was sideways, this phase was a decline. In 2022, the previous phase was primarily a decline, so this phase first fell and then moved mainly sideways.

Either funds from selling BTC are no longer primarily exiting, or capital is entering, causing the USDT market cap to increase. The weakest believers have already left, while the steadfast believers begin holding U or injecting capital, accumulating and waiting. Market faith also enters a sedimentation stage.

Bear Market Stage 4: Final Panic (Black Swan)

⬩Approx. Nov 09, 2022 ~ Nov 22, 2022

In this stage, BTC is falling, and the USDT market cap is also decreasing.

This is the final panic stage, mainly influenced by a black swan event. 2018 did not have this stage.

Recovery

After BTC bottoms out, it may gradually move upward or oscillate at the bottom. However, the USDT market cap increases. This is a stage of market recovery and faith rebuilding.

When to Buy the Dip

The earliest should be in Stage 3, when the USDT market cap is rising, using partial positions to buy the dip in batches.

The best buying opportunity, the phase where BTC crashes and the USDT market cap falls, may not necessarily occur; 2018 did not have this phase.

For retail investors, a more ideal buying range might be on the right side, i.e., the recovery stage. This stage features sustained growth in the USDT market cap, and BTC has experienced a bottom and shows signs of stabilization or even upward movement.

Final Thoughts

By comparison, it can be seen that each cycle's Stage 1 is getting shorter, because the market is reacting to the bear market faster and faster.

However, Stage 2 has not gotten shorter. Stage 2 may be related to the impact of negative events. The first half of 2018 had no negative events; it even had the mainnet launches of EOS and Tron. In 2022, the Luna crash followed by Three Arrows bankruptcy made this cycle's Stage 2 longer and the decline greater.

We are most likely already in Stage 2 now; the USDT market cap is decreasing, and the current negative is the Iran conflict. It is still uncertain when this negative will end.

Price-wise, Brother Bee believes the impact of the conflict on liquidity is relatively weak, but US stocks have a correction demand, so the current situation might be between the 2018 and 2022 Stage 2, possibly a downward. Of course, the certainty of this guess is not high; the uncertainties around Trump and Iran are quite significant.

In terms of cycles, Brother Bee's speculation is that around the time of Trump's visit to China, the geopolitical negatives might end. Because Trump's visit to China would mean that regarding countries like Iran, Trump already holds sufficient negotiation chips.

However, whether black swans will appear during the process of communication and coordination between the two sides is unknown. Furthermore, there are subsequent key events like Wash's inauguration and Japan's interest rate hike.

Therefore, when Stage 2 will end still requires continued observation. The first opportunity to buy the dip still requires patience, waiting for the USDT market cap to resume its rise after experiencing a decline. Since USDT's current use is not limited to crypto trading, the changes in its market cap this cycle might be less obvious. Thus, it's also necessary to consider factors like geopolitics and monetary policy.

Domande pertinenti

QWhat are the main stages of a bear market according to the article, and what characterizes each stage?

AThe article outlines 3-4 stages: 1. Reaction Stage (Faith Remains): BTC falls, but USDT market cap rises as some funds remain hopeful. 2. Confirmation Stage (Faith Collapses): BTC may fall or stagnate, USDT market cap decreases as funds exit, confirming the bear market. 3. Accumulation Stage (Faith Sediments): BTC may fall or stagnate, but USDT market cap increases as weak holders leave and strong holders accumulate. 4. Final Panic Stage (Black Swan, not present in 2018): BTC falls sharply with USDT market cap decreasing due to a black swan event.

QBased on the historical patterns described, when did the author suggest the 'Reaction Stage' of the current bear market (circa 2025-2026) likely began and ended?

AThe author suggested the Reaction Stage for the current cycle疑似 (suspectedly) began around October 6, 2025, and ended around January 6, 2026.

QWhat is the key on-chain metric the author uses to identify the transition between bear market stages, particularly between Stage 1 and Stage 2?

AThe key on-chain metric is the market capitalization of USDT. A rising USDT market cap characterizes Stage 1, while a decreasing USDT market cap signals the transition into Stage 2.

QAccording to the author, what is the earliest recommended time for investors to consider buying the dip (accumulating assets) in a bear market?

AThe earliest recommended time to start accumulating is during Stage 3 (the Accumulation Stage), when the USDT market cap is increasing. The author advises using a portion of capital to buy in batches at this stage.

QWhat are some of the specific geopolitical and economic events mentioned as potential factors prolonging the current 'Confirmation Stage' (Stage 2)?

AThe events mentioned are the Iran conflict, potential U.S. stock market correction, uncertainty surrounding former President Trump's actions (including a potential visit to China), the upcoming term of Fed Chair Waller, and a potential interest rate hike by Japan.

Letture associate

Raising Interest Rates Is Not a Tech Killer, EPS Is: A Strategy for Discarding the Weak and Retaining the Strong After the AI Theme's Sharp Decline

**Summary: Rising Interest Rates Are Not the Killer of Tech; EPS Is: The "Keep the Strong, Ditch the Weak" Strategy After the AI Theme Plunge** The author argues that the sharp sell-off in tech and AI-related stocks, triggered by a strong US jobs report that heightened Fed rate hike fears, represents a "pullback to pick up passengers" rather than a "car crash." The true end of a tech bull market is not determined by an extra 25 basis point hike, but by industry overcapacity and the disproval of earnings per share (EPS) expectations. Historical analysis shows that during past rate hike cycles, the Nasdaq-100 often outperformed, provided EPS growth remained strong. The current phase is seen as a shift from a "broad narrative-driven rally" to a "focused verification stage" for AI. The investment strategy should be to "keep the strong, ditch the weak." * **Retain exposure** to high-conviction AI infrastructure leaders with clear order visibility, stable margins, strong cash flow, and upward EPS revisions (e.g., AI servers, advanced packaging, optical modules, key cloud suppliers). * **Reduce exposure** to high-beta, narrative-driven stocks with unclear profit paths (e.g., some quantum computing, space, or speculative chip stocks), especially on rebounds. Valuation concerns should focus on whether earnings can catch up to high multiples, not on high P/E alone. Crowded positioning signals a concentration into quality assets, not necessarily a market top. The upcoming Q2 earnings season will be a key validation point. The core principle is to hold stocks with proven EPS, while using macro events (CPI data, central bank meetings) to manage timing and risk.

marsbit35 min fa

Raising Interest Rates Is Not a Tech Killer, EPS Is: A Strategy for Discarding the Weak and Retaining the Strong After the AI Theme's Sharp Decline

marsbit35 min fa

The Largest IPO in History Ignites Heated Debate: Is SpaceX Worth $1.77 Trillion?

SpaceX's potential IPO is priced at $135 per share, aiming to raise $75 billion and valuing the company at approximately $1.77 trillion, which would make it the largest IPO in history. This valuation has sparked intense debate among investors. Bullish analysts, including major underwriters Goldman Sachs and Morgan Stanley, argue the valuation is justified by SpaceX's long-term potential. They see it not just as a rocket company but as a future leader in space infrastructure, with key growth drivers being Starlink satellite internet, low-cost rocket launches, and future AI-related ventures. They project revenues reaching hundreds of billions to trillions of dollars by 2030-2040. ARK Invest's model suggests a 2030 enterprise value could reach $2.5 trillion. Bearish analysts from independent research firms like Morningstar, PitchBook, and New Constructs contend the IPO price is excessively high, already pricing in unrealistic future growth. Using DCF and sum-of-the-parts models, they estimate fair value between $780 billion and $1.7 trillion, significantly below the IPO target. They highlight risks such as the speculative nature of AI projections, over-dependence on Elon Musk, high growth expectations, and corporate governance concerns. Trefis set a target price of just $79 per share. While both sides acknowledge SpaceX's unique position in commercial space, the core disagreement centers on whether the $135 share price offers a reasonable margin of safety or is overly optimistic. Despite the valuation controversy, reported strong demand for the IPO indicates significant market interest.

marsbit2 h fa

The Largest IPO in History Ignites Heated Debate: Is SpaceX Worth $1.77 Trillion?

marsbit2 h fa

After the Passage of the GENIUS Act and the CLARITY Act, What Is the Correct Architecture for On-Chain Yield?

The article discusses the evolution of on-chain credit, distinguishing three markets: overcollateralized crypto lending, unsecured lending (largely unsuccessful), and asset-backed credit (ABC). ABC, backed by identifiable real-world collateral with legal recourse, is identified as the fastest-growing category and the only one credibly addressing adverse selection—the core problem in credit where the riskiest borrowers self-select. Current growth in on-chain Real World Assets (RWAs), particularly tokenized private credit funds (e.g., Maple Finance, Centrifuge), is substantial but often merely "wraps" existing fund structures, inheriting their risks rather than solving adverse selection at the protocol level. The regulatory landscape is a key driver, with the US GENIUS Act (prohibiting stablecoin issuers from paying yield) and the proposed CLARITY Act (closing loopholes on indirect yield) set to redefine permissible yield-bearing products. This makes vaults (like ERC-4626) the critical architecture—they become the primary compliant vehicle for delivering yield, functioning as issuance, disclosure, distribution, and recovery mechanisms. The author's thesis is that the correct post-GENIUS/CLARITY architecture involves building ABC solutions where credit assessment, structure, and recovery are encoded directly into the smart contract vault layer, moving beyond mere tokenized fund wrappers to solve adverse selection fundamentally and ensure regulatory compliance.

Foresight News3 h fa

After the Passage of the GENIUS Act and the CLARITY Act, What Is the Correct Architecture for On-Chain Yield?

Foresight News3 h fa

Trading

Spot
Futures

Articoli Popolari

Come comprare 4

Benvenuto in HTX.com! Abbiamo reso l'acquisto di 4 (4) semplice e conveniente. Segui la nostra guida passo passo per intraprendere il tuo viaggio nel mondo delle criptovalute.Step 1: Crea il tuo Account HTXUsa la tua email o numero di telefono per registrarti il tuo account gratuito su HTX. Vivi un'esperienza facile e sblocca tutte le funzionalità,Crea il mio accountStep 2: Vai in Acquista crypto e seleziona il tuo metodo di pagamentoCarta di credito/debito: utilizza la tua Visa o Mastercard per acquistare immediatamente 44.Bilancio: Usa i fondi dal bilancio del tuo account HTX per fare trading senza problemi.Terze parti: abbiamo aggiunto metodi di pagamento molto utilizzati come Google Pay e Apple Pay per maggiore comodità.P2P: Fai trading direttamente con altri utenti HTX.Over-the-Counter (OTC): Offriamo servizi su misura e tassi di cambio competitivi per i trader.Step 3: Conserva 4 (4)Dopo aver acquistato 4 (4), conserva nel tuo account HTX. In alternativa, puoi inviare tramite trasferimento blockchain o scambiare per altre criptovalute.Step 4: Scambia 4 (4)Scambia facilmente 4 (4) nel mercato spot di HTX. Accedi al tuo account, seleziona la tua coppia di trading, esegui le tue operazioni e monitora in tempo reale. Offriamo un'esperienza user-friendly sia per chi ha appena iniziato che per i trader più esperti.

353 Totale visualizzazioniPubblicato il 2025.10.20Aggiornato il 2026.06.02

Come comprare 4

Discussioni

Benvenuto nella Community HTX. Qui puoi rimanere informato sugli ultimi sviluppi della piattaforma e accedere ad approfondimenti esperti sul mercato. Le opinioni degli utenti sul prezzo di 4 4 sono presentate come di seguito.

活动图片