Average Crypto Trader Losses Reached $500 Million Per Day in 2025

RBK-cryptoPubblicato 2025-12-25Pubblicato ultima volta 2025-12-25

Introduzione

According to a Coinglass report, the total volume of forced liquidations of margin-based trading positions on crypto exchanges neared $150 billion in 2025. The estimated average daily liquidation volume throughout the year ranged from $400 million to $500 million. A record-breaking single-day liquidation event occurred on October 11, accounting for nearly 15% of the annual total with nearly $20 billion in futures positions liquidated. This was triggered by US President Donald Trump's announcement of new 100% tariffs on Chinese imports and export controls on critical software, which sparked fears of a new trade war and caused a sharp shift towards risk-off sentiment. Bitcoin and Ethereum fell by 10-15% at their peak, while many altcoins crashed by 80% or more. The crash exposed key market vulnerabilities, including reliance on opaque liquidation mechanisms, fragile infrastructure under peak load, and a lack of effective circuit breakers common on traditional exchanges. Unlike the Terra (LUNA) collapse in 2022, this event did not lead to a cascade of institutional investor defaults, as the risks were concentrated in specific strategies and assets rather than being systemic.

In 2025, the total volume of forced liquidations of margin-based trading positions on cryptocurrency exchanges approached $150 billion, according to a Coinglass report. The estimated average daily liquidation rate throughout the year ranged from $400 million to $500 million.

This refers to the nominal value of positions including leverage (a $100 position with 10x leverage counts as $1000 in the total loss amount), but even with this adjustment, the scale of the losses remains impressive.

Nearly 15% of the annual liquidation volume occurred in a single day—on the night of October 11th, when the crypto market experienced the largest cascade of futures position liquidations in history, with a total volume of nearly $20 billion. This set an absolute record for the volume of forcibly closed trading positions on cryptocurrency exchanges.

The event occurred against the backdrop of U.S. President Donald Trump announcing new 100% tariffs on imports from China, as well as export controls on critical software. This sharply increased expectations of a new trade war, as Coinglass writes, which forced markets into a "risk-off" mode, meaning a retreat from high-risk assets, including Bitcoin and other cryptocurrencies.

Experts note that the scale of the consequences was determined not only by external factors but also by the structure of the leverage used and the functioning of liquidation mechanisms. During exchange overload, Auto-Deleveraging (ADL) mechanisms were triggered, and trades were executed at unfavorable prices, causing losses even for profitable traders.

Bitcoin and Ethereum lost 10–15% at their peak, while many altcoins collapsed by 80% or more.

The Coinglass report stated that the crash of that day revealed key market vulnerabilities: reliance on opaque liquidation mechanisms, the fragility of infrastructure under peak loads, and the lack of effective circuit breakers that exist on traditional exchanges.

Unlike the crash of the Terra (LUNA) project in 2022, this collapse did not lead to a series of defaults by institutional investors. The risks were not systemic and were concentrated in specific strategies and assets, noted Coinglass.

How the Base Blockchain Ecosystem is Structured. Top 5 Applications

AI Outperformed Humans in a Crypto Trading Tournament. What Were the Results

Miner "Capitulation" Called a Bullish Factor for Bitcoin. Why

Domande pertinenti

QWhat was the average daily liquidation amount for crypto traders in 2025 according to the Coinglass report?

AThe average daily liquidation amount ranged from $400 million to $500 million in 2025.

QWhat event on October 11 triggered the largest cascade of futures liquidations in crypto market history?

AUS President Donald Trump announced new 100% tariffs on imports from China and export controls on critical software, which sharply increased expectations of a new trade war.

QWhat were the maximum losses for Bitcoin and Ethereum during the market crash described in the article?

ABitcoin and Ethereum lost 10-15% at their maximum, while many altcoins collapsed by 80% or more.

QWhat key market vulnerabilities were exposed by the crash according to the Coinglass report?

AThe key vulnerabilities were dependence on opaque liquidation mechanisms, infrastructure fragility during peak loads, and the lack of effective circuit breakers that exist on traditional exchanges.

QHow did this market crash differ from the Terra (LUNA) collapse in 2022 in terms of institutional impact?

AUnlike the Terra collapse, this crash did not lead to a series of defaults by institutional investors. The risks were not systemic and were concentrated in specific strategies and assets.

Letture associate

Bank of Japan Signals Interest Rate Hike Despite Keeping Them at 1%

The Bank of Japan (BOJ) kept its benchmark interest rate at 1% on July 31, as widely expected, following a June hike to a 31-year high. The decision passed with an 8-1 vote, with board member Hajime Takata again dissenting in favor of a hike to 1.25%. Despite holding rates steady, the BOJ signaled a hawkish tilt, warning that underlying inflation is likely to accelerate and exceed 2% from the latter half of the fiscal year. While it slightly lowered its core inflation forecast for FY2026, officials expressed stronger confidence that an overshoot will occur later, driven by yen weakness, corporate pricing behavior, and lingering energy shock effects. Markets were focused on the BOJ's forward guidance. Analysts noted the central bank appeared to balance short-term caution with a long-term warning of tighter policy. Governor Kazuo Ueda faces the challenge of reconciling a government reluctant to tighten further with bond markets already pricing in additional hikes, with the timing of the next move debated. Adding complexity, the BOJ reportedly intervened in currency markets hours before the rate decision, buying yen to support the currency which had fallen to 40-year lows against the dollar. Yen weakness stems from the wide U.S.-Japan interest rate gap, high fuel prices, and market skepticism about the pace of BOJ policy normalization. The yield on Japan's 10-year government bonds fell to 2.8%, indicating investor expectations for future monetary tightening.

cryptonews.ru5 min fa

Bank of Japan Signals Interest Rate Hike Despite Keeping Them at 1%

cryptonews.ru5 min fa

Why Are Leveraged ETFs like 7709 Inherently Negative EV Products?

This article argues that the SK H力士 2x Leveraged ETF (7709) is fundamentally a negative expected value (EV) product, rather than simply a "double SK H力士" investment. Its core issue stems from its daily rebalancing mechanism to maintain a 2x leverage target. After a price move, the fund must buy more after a rise or sell after a fall to readjust its leverage, creating a systematic pattern of buying high and selling low. This introduces a "delay loss": it always reacts to past price changes, missing potential gains from adjusting earlier during an uptrend and suffering greater losses from adjusting later during a downtrend. While more frequent intraday rebalancing would improve returns in strong, smooth trending markets by reinvesting profits or cutting losses sooner, it also dramatically increases volatility drag (frictional losses) during choppy, oscillating markets due to more frequent high-buy/low-sell trades. The author draws a parallel to an option seller who delta hedges (short gamma), which involves similar "buy high, sell low" dynamic hedging. However, unlike an option seller who receives upfront premium (IV and theta) as compensation for this risk, the leveraged ETF investor receives no such compensation. Instead, they bear all the path-dependent volatility decay, plus additional costs like swap/derivatives financing, management fees, and trading slippage. Thus, the product's return profile can be framed as: 2x directional return minus realized variance drag minus financing costs minus derivatives costs minus management fees minus transaction costs. For the investor to profit, SK H力士's price must not only rise significantly but do so in a strong, sustained, and smooth trend to overcome these inherent structural costs. High volatility and frequent price reversals are particularly damaging. The article also notes that while the ETF has no explicit liquidation line like perpetual futures, avoiding a sudden "blow-up," its net asset value can still decay towards zero over time through this combination of volatility drag and fees. For experienced traders, directly managing leverage via perpetual contracts may offer more control and potentially lower costs than this packaged, mechanistic product.

marsbit12 min fa

Why Are Leveraged ETFs like 7709 Inherently Negative EV Products?

marsbit12 min fa

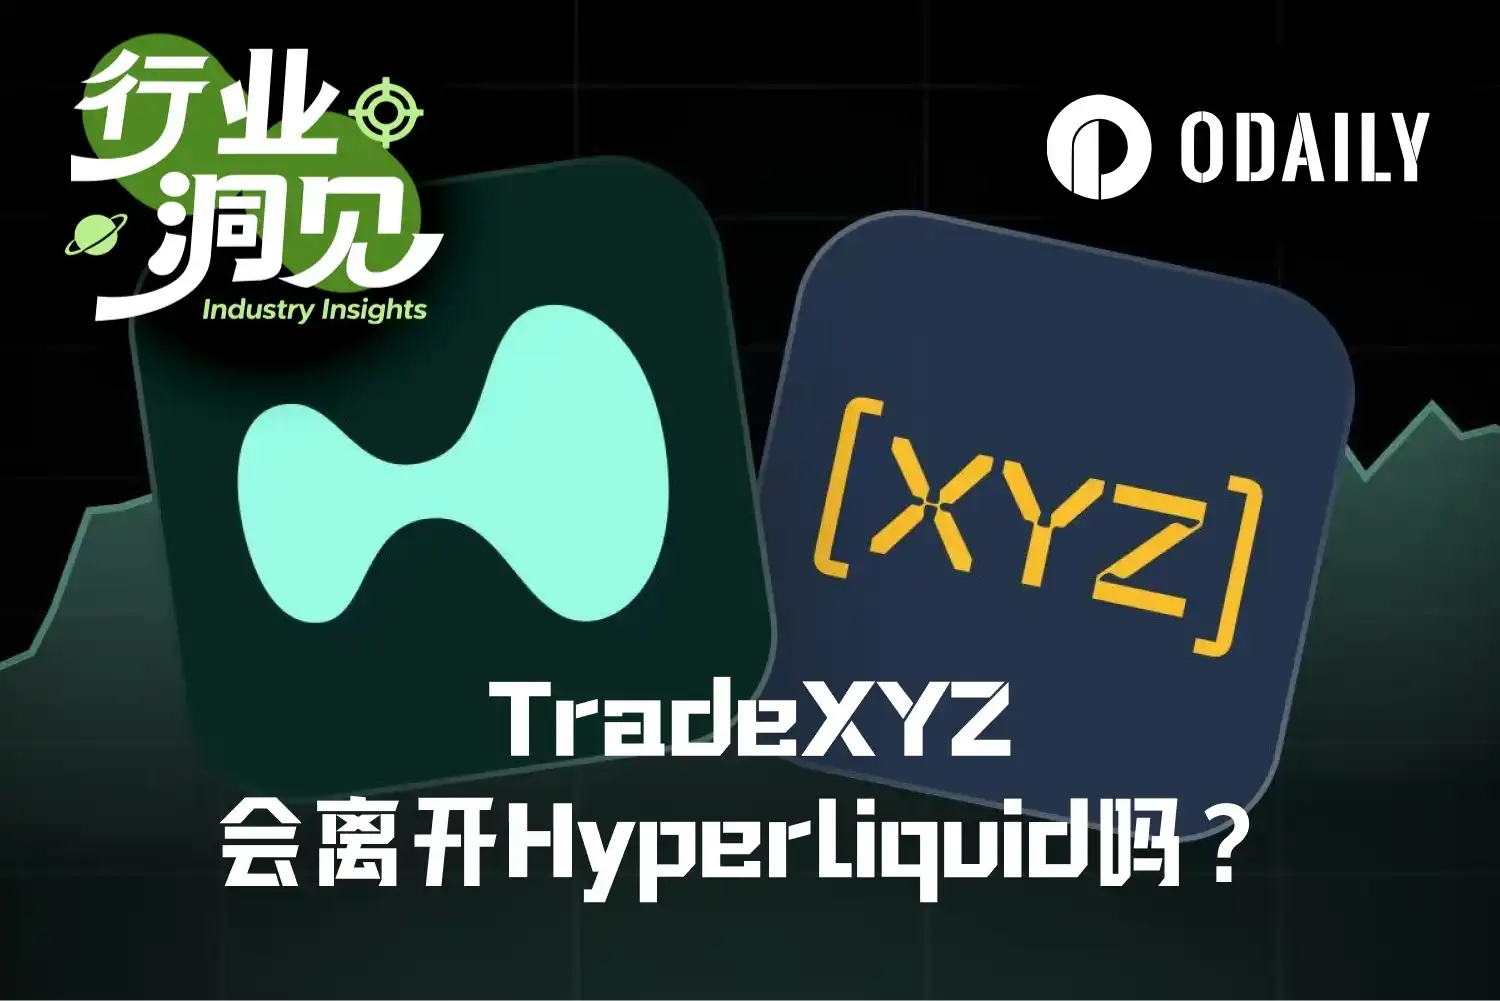
'Backstabbing' or 'Win-Win'? How Likely Is TradeXYZ to Break Away from Hyperliquid and Go Solo?

The article discusses the growing debate over whether TradeXYZ, which dominates Hyperliquid's HIP-3 market with over 90% of its volume, might break away to build its own independent trading platform. This possibility is fueled by TradeXYZ's immense market influence and the common industry trend of successful projects seeking more control and profit capture. Key arguments for a potential split include TradeXYZ's overwhelming contribution to Hyperliquid's metrics and the financial incentive to retain all transaction fees, as it currently splits them 50/50 with Hyperliquid. The piece draws parallels to other cases, like Anthropic's "Claude Code" competing with its former partner Cursor, suggesting "betrayal" can occur when business leverage shifts. However, strong counterarguments suggest a split is unlikely or would be detrimental. TradeXYZ relies on Hyperliquid's high-performance infrastructure and its platform as a primary user acquisition channel. Building a comparable system would be challenging. Furthermore, the founders of both projects share a history of trust and mutual admiration. The analysis concludes that a separation would likely be a lose-lose scenario: Hyperliquid would lose a major growth narrative and trading volume, while TradeXYZ would face technical hurdles, user migration issues, and reputational damage, potentially allowing competitors to seize market share. The most rational path is seen as continued collaboration, with TradeXYZ potentially negotiating better terms while leveraging Hyperliquid's established strengths.

marsbit22 min fa

'Backstabbing' or 'Win-Win'? How Likely Is TradeXYZ to Break Away from Hyperliquid and Go Solo?

marsbit22 min fa

Trading

Spot
活动图片