Aave [AAVE] breached the $100 support level amid a broader market slip and fell to a three-week low of $96. In fact, at press time, AAVE traded at $97, down 7.7% on the daily charts, while the market cap fell by over $200 million.
In doing so, the altcoin fell below its short-term Moving Averages (MA), the 9- and 21-day MAs, reflecting strong downside pressure.
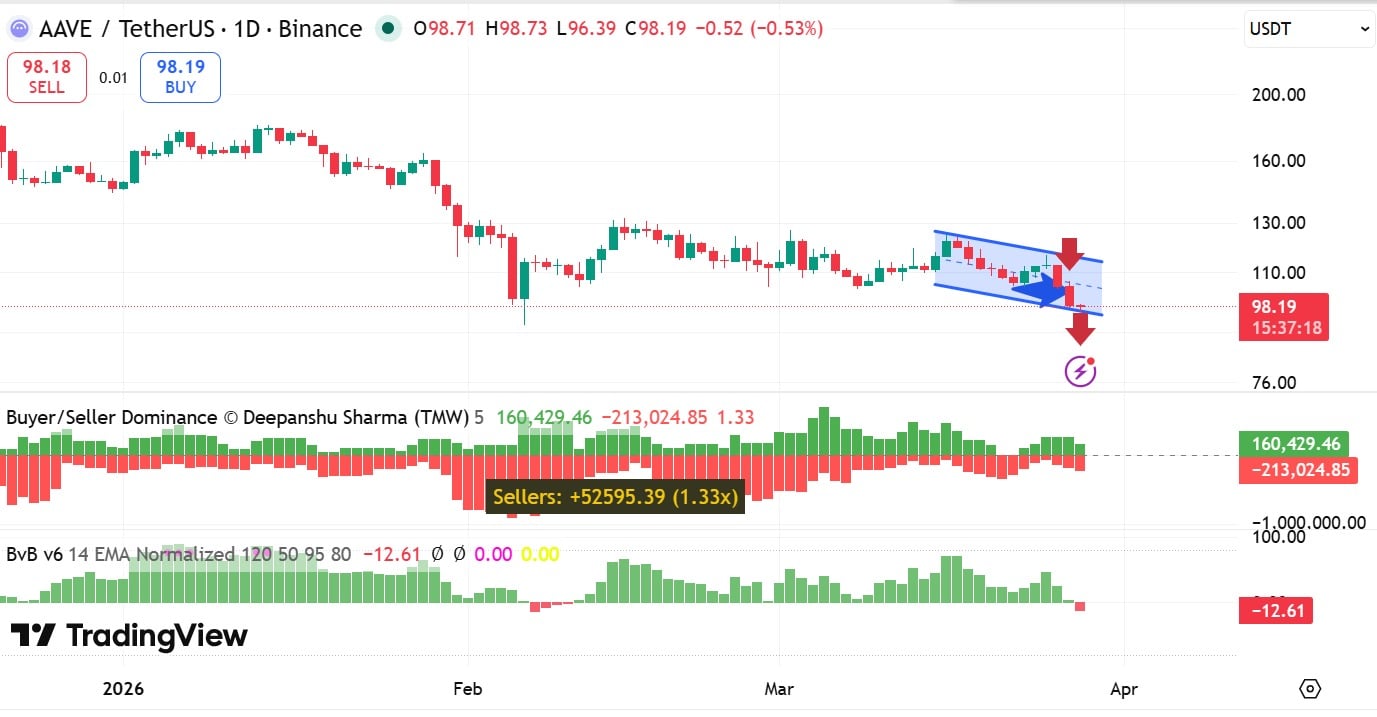
AAVE drops below $100
As the crypto market retraced, AAVE market participants turned bearish and began exiting the market aggressively, thereby strengthening downside momentum.
In fact, the Bulls vs. Bears indicator turned negative after being positive for more than a month. When this metric turns negative, it suggests that sellers have dominated the market and displaced buyers.

Furthermore, exchange activities echoed this seller dominance. According to CryptoQuant data, 79k AAVE tokens flowed into exchanges, compared to 74k flowing out.

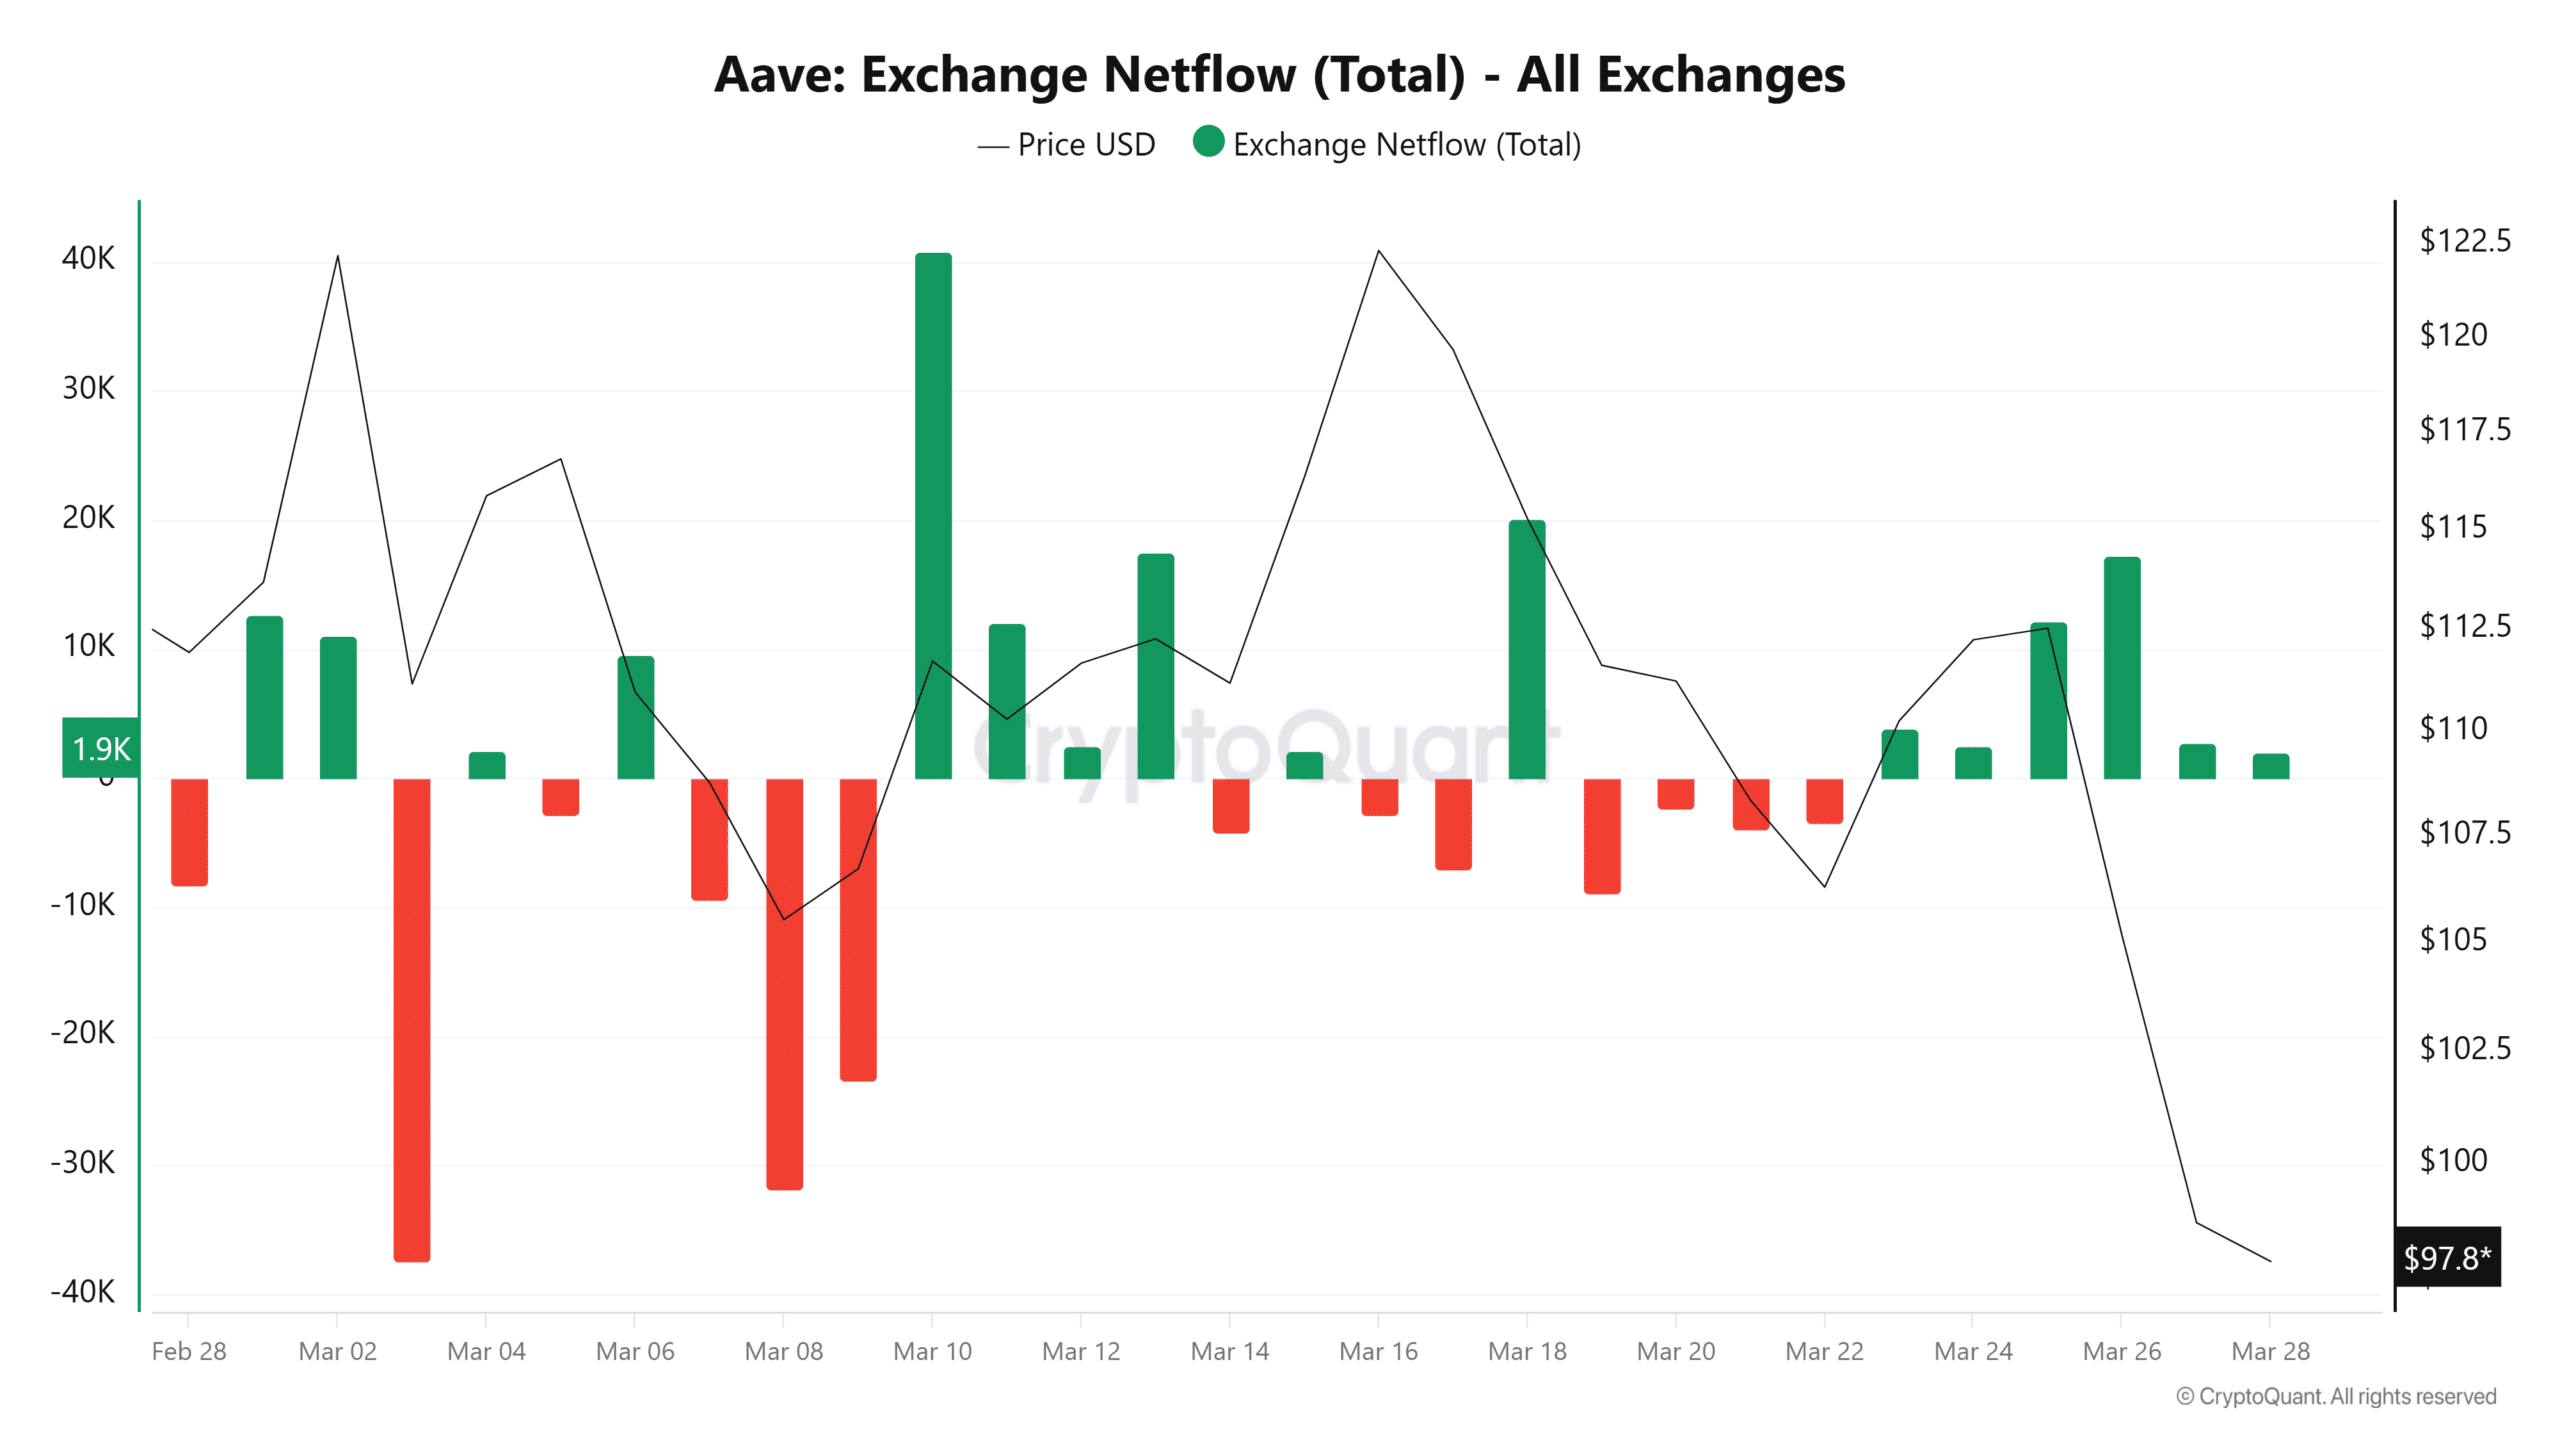
Thus, the altcoin’s Netflow extended its hold within the positive zone for the sixth day, suggesting that sellers have had a strong dominance over the market.
As a result, the altcoin’s Exchange Supply Ratio jumped to a monthly high of 0.137 as of writing, indicating increased selling activity. Often, such a jump in ESR reduces scarcity, thus increasing the supply available for immediate sale.
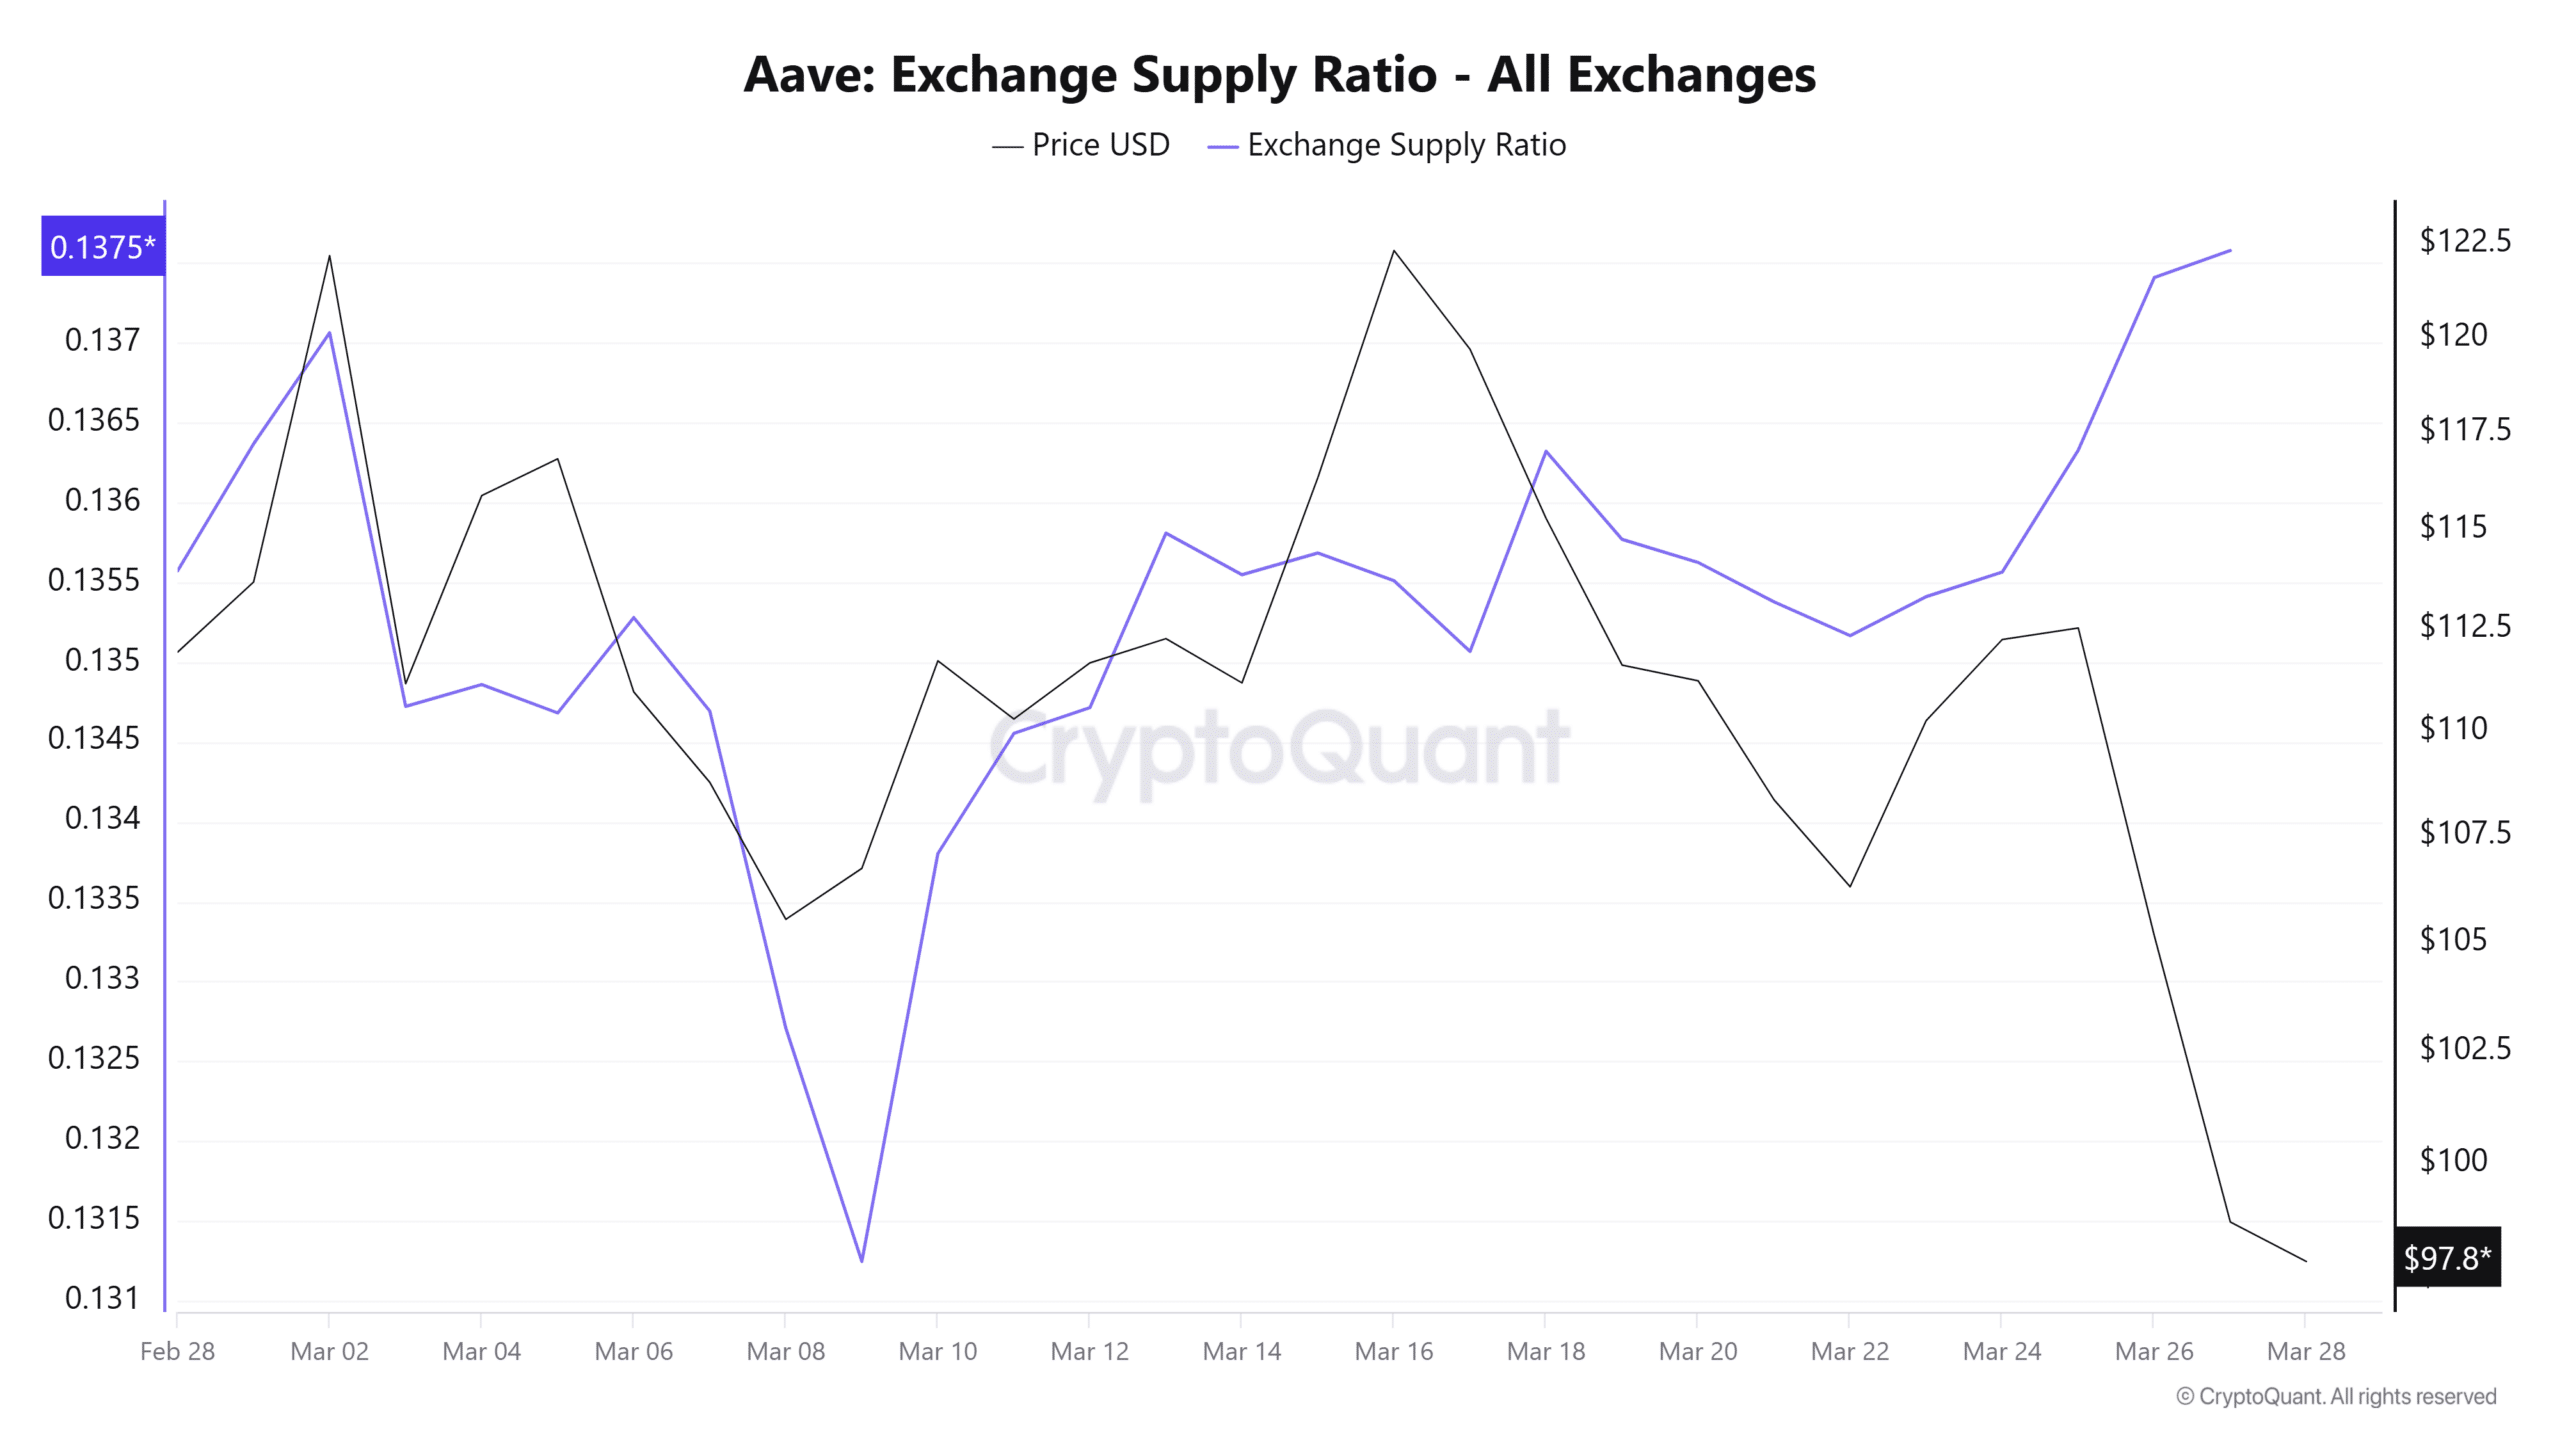

Such a setup on exchanges has preceded strong downward momentum for the asset, leading to lower prices.
What momentum indicators suggest
AAVE has experienced strong downward momentum and breached a key support level, with sellers significantly outpacing buyers. Since then, the altcoin’s Relative Strength Index (RSI) dropped deeper into bearish territory, falling to 34 at press time.
With RSI nearing oversold territory, this suggests sellers’ control of the market, while buyers have largely stepped back. Traditionally, such market conditions have strengthened downward momentum, typically resulting in lower prices.

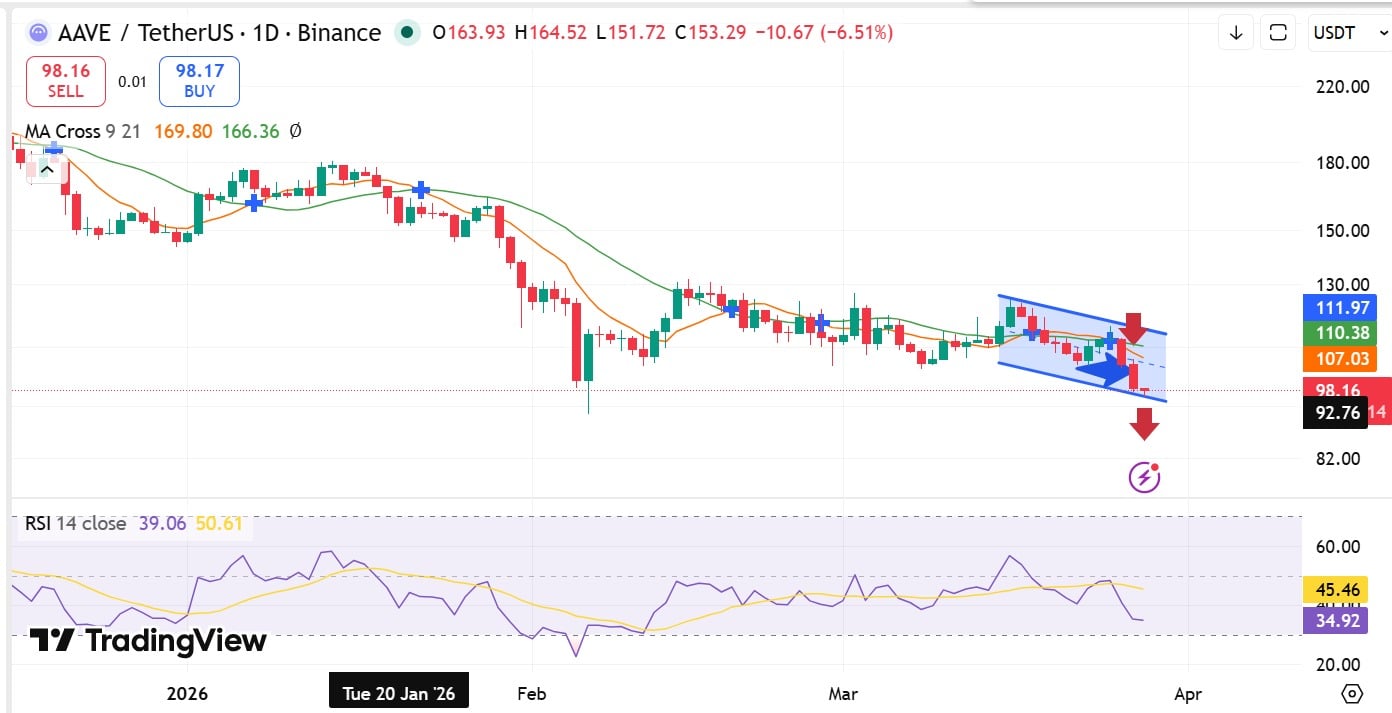
Therefore, if sellers continue to overrun the market with little resistance, AAVE is likely to slide towards $92 before attempting another leg up.
However, if the market cools down and bulls reclaim $100, the altcoin could set the ground for a rebound. But for a significant trend reversal, bulls need to flip $100 and reclaim the 9- and 21-day MAs at $107 and $110, respectively.
Failure to do so will see the altcoin enter an extended bearish streak, with a likelihood of staying below $100.
Final Summary
- Aave dropped 7.7%, breaching $100 and dropping to a three-week low of $96.
- AAVE faced intense selling pressure, with bears outpacing bulls, strengthening downside risk.


