Analyst’s Bitcoin Price Crash Prediction From May 2025 Resurfaces And It Says The Bottom Is Not In

bitcoinistPubblicato 2026-02-09Pubblicato ultima volta 2026-02-09

Introduzione

A previously published Bitcoin price crash projection from analyst KillaXBT, dating back to May 13, 2025, has regained attention for accurately predicting the current market downturn. The model uses rotational market mathematics to identify cycle stages—accumulation, distribution, and breakdown—and signaled that Bitcoin had not yet reached a macro bottom. The analysis highlighted key levels, including accumulation phases that fueled the rally and distribution zones near $115,000–$120,000 where exhaustion signals emerged. The chart correctly anticipated rejections at highs, fading momentum, and eventual breakdowns, with Bitcoin transitioning into mid-range consolidation around $100,000 before falling further. Currently, Bitcoin is trading in a lower distribution band near $70,000, with the model suggesting extended bearish consolidation. Relief rallies lack strength, and volatility remains high on declines. The projection indicates a potential capitulation toward $50,000 to complete the distribution phase, concluding that the true market bottom has not yet been established.

A previously published Bitcoin price crash projection from May 13, 2025, has re-entered market discourse after several prominent crypto traders on X recirculated the chart and commended the foresight behind the analysis from KillaXBT. The model mapped Bitcoin’s full cycle structure — from accumulation to distribution and breakdown — long before the current correction unfolded. Now, the same framework is signaling that Bitcoin has yet to establish a macro bottom.

Chart Signals That Nailed The Bitcoin Price Crash

KillaXBT’s framework is built on rotational market mathematics, measuring how many times price cycles are within a range before exhaustion. The analyst segmented Bitcoin’s structure into consolidation blocks and assigned swing counts to identify when liquidity had been fully absorbed.

In the early phase, accumulation rotations labeled “(2×2)+1 = 5” and “(5×2)+1 = 11” defined the base that ultimately fueled Bitcoin’s impulsive rally. These counts indicated that internal liquidity cycling was complete, clearing the path for expansion. Once that move matured, the price transitioned into a high-range consolidation beneath the cycle peak.

Inside the 115,000–120,000 distribution zone, the chart identified overlapping exhaustion clusters marked “(2×5)+1 = 9” and “(3×2)+1 = 7.” For traders, stacked counts at highs typically signal supply absorption. Although Bitcoin printed marginal higher highs, momentum was fading — a textbook late-stage distribution signal.
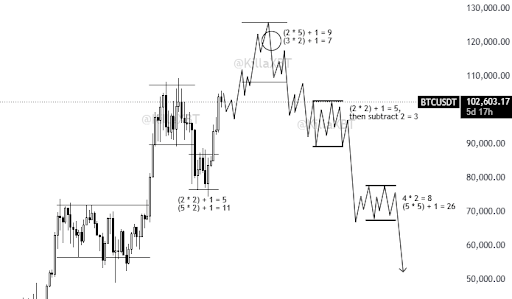
Source: Chart from KillaXBT on X

Market behavior followed that roadmap. Bitcoin formed repeated rejection wicks near the highs, upside momentum slowed, and breakout attempts failed to secure acceptance above resistance. Volume compression reinforced the distribution thesis. Instead of continuation, the price rolled over.

The model then mapped a transition into mid-range consolidation around the 100,000 psychological level, with BTCUSDT referenced near 102,603. Annotated “(2×2)+1 = 5, then subtract 2 = 3,” the structure signaled weakening bounce capacity. Price action mirrored the setup: multiple support tests, lower highs, and eventual breakdown — completing the crash phase outlined in the May 2025 forecast.

Bitcoin Price Could Drop Further Before Hitting Bottom

The resurfaced chart’s larger significance lies in its forward projection. After the six-figure range failed, the model guided Bitcoin into a lower distribution band around 70,000. This zone carried heavier rotational counts — “4×2 = 8” and “(5×5)+1 = 26” — implying extended consolidation within a bearish continuation framework.

Current market behavior continues to align with that structure. Bitcoin has already rotated into lower support territory following the 100K breakdown, while volatility has expanded on selloffs rather than recoveries. Relief rallies remain corrective, lacking the impulsive follow-through required to confirm bottom formation.

The chart’s final stage shows a potential capitulation toward the $50,000 area, marked by a sharp move below the lower range. Structurally, this is an unfinished downside that completes the current distribution phase.

The sequence is straightforward: accumulation pushed prices higher, the rise led to distribution, and now distribution is causing further breakdowns. Because no consolidation has shown the expansion profile typical of a macro base, the model maintains that the true bottom is not yet in.

BTC trading at $69,162 on the 1D chart | Source: BTCUSDT on Tradingview.com

Domande pertinenti

QWhat is the main prediction of the resurfaced Bitcoin price analysis from May 2025?

AThe analysis predicts that the Bitcoin price crash is not over yet and that the true macro bottom has not been established, with a potential further drop toward the $50,000 area.

QWho created the Bitcoin price projection model that is being discussed?

AThe model was created by an analyst known as KillaXBT.

QWhat key mathematical concept does KillaXBT's framework use to analyze Bitcoin's price action?

AThe framework is built on rotational market mathematics, measuring how many times price cycles are within a range before exhaustion, using formulas like (2x2)+1=5 to identify liquidity absorption and exhaustion clusters.

QAccording to the model, what was the significance of the distribution zone between $115,000 and $120,000?

AThis zone was identified as a high-range distribution area with overlapping exhaustion clusters, signaling supply absorption and marking a late-stage distribution phase before the price rolled over.

QWhat is the model's final projected stage for the current Bitcoin price cycle?

AThe model's final projected stage is a potential capitulation event, involving a sharp move below the lower consolidation range toward the $50,000 area to complete the current distribution phase.

Letture associate

Must-Watch Events Next Week|CLARITY Act Could Face Senate Vote; SpaceX, Circle to Report Earnings (8.3-8.9)

**Summary: Key Events and Developments to Watch (August 3-9)** The upcoming week is marked by significant financial disclosures, key legislative deadlines, and notable product updates. **Major Financial Events:** Several companies are scheduled to release their Q2 2026 earnings. American Bitcoin (ABTC) will report on August 3, followed by SpaceX and Hut 8 Mining Corp. on August 4, and Circle on August 5. Notably, a significant portion of SpaceX shares (up to 12% of total shares) will be unlocked on August 6 following their earnings release. **Key Legislative Deadline:** The U.S. Senate faces an August 7 deadline to secure 60 votes for the CLARITY Act, a bipartisan bill aiming to establish a federal regulatory framework for cryptocurrencies. The Senate may hold a full vote on the bill during the week. **Economic Data:** The U.S. July Non-Farm Payrolls report will be released on August 7, providing crucial labor market data. **Technology & Product Updates:** * **Shutdowns:** DeFi portfolio tracker Zapper and wallet app Ctrl Wallet will cease operations on August 3. * **Upgrades:** LayerZero will deprecate its v1 relayers on August 3. XRP Ledger's new version 3.3.0, featuring five new functions, is expected next week. * **AI:** Elon Musk announced that the advanced Grok 4.6 AI model is set for release around August 7. * **Bitcoin:** The BIP-110 forced signaling for a potential Bitcoin network change is scheduled to begin around August 8. **Other Notable Events:** Chinese robotics firm Unitree Tech has set its preliminary price inquiry for its IPO for August 5. South Korean exchange Upbit will delist AQT and AERGO tokens on August 3.

marsbit40 min fa

Must-Watch Events Next Week|CLARITY Act Could Face Senate Vote; SpaceX, Circle to Report Earnings (8.3-8.9)

marsbit40 min fa

Stocks Are Plummeting More Sharply Than Cryptocurrencies. Where Has the Money Gone?

Stock Markets Plunge Deeper Than Cryptocurrencies: Where Did the Money Go? In late July, Seoul's Kospi index triggered circuit breakers for two consecutive days, plummeting over 40% from its June high. The collapse was led by heavyweight stocks like SK Hynix, whose record profits still disappointed investors, and devastating leveraged ETFs, with one major product losing over 83% of its value. This signaled a global, forced deleveraging targeting the most crowded trades. Interestingly, while stocks exhibited extreme volatility akin to crypto markets, Bitcoin rose nearly 15% in July after a prior steep drop. Analysis shows the money fleeing equities did not flow into Bitcoin. Instead, Bitcoin had already absorbed its sell-off in May-June, when U.S. spot Bitcoin ETFs saw historic outflows. The true safe-haven beneficiary was gold, whose price rose over 20% year-on-year, highlighting a decoupling between Bitcoin and gold as "digital gold." The sell-off was a targeted unwinding of leveraged positions in tech and semiconductors, accelerated by broker-dealer risk management and shifts in the AI narrative, including new competition from Chinese memory chipmakers. The retreat path was clear: from high-valuation tech stocks to cash and U.S. Treasuries, then to gold. For Bitcoin to attract sustained institutional inflows, conditions like eased global liquidity pressure, a "soft-landing" Fed rate cut, and U.S. regulatory clarity via legislation like the stalled CLARITY Act are needed. Currently, Bitcoin is not a safe haven but an already-cleared asset. Its low correlation with tech stocks, however, makes it a potential diversification play for institutional portfolios once the storm passes. The money isn't here yet, but the positioning is underway.

marsbit40 min fa

Stocks Are Plummeting More Sharply Than Cryptocurrencies. Where Has the Money Gone?

marsbit40 min fa

In Conversation with Ray Dalio: We Are Currently in an AI Bubble, with 1% of My Portfolio in Bitcoin

Ray Dalio, founder of Bridgewater Associates, warns in an interview that the current AI boom shows classic bubble characteristics, which could lead to significant economic downturns as seen in past cycles like 1929 or 2000. He explains that speculative enthusiasm, fueled by debt and overvaluation, often precedes a crash when rising rates or taxation force asset sales, causing widespread losses and recession. Dalio also outlines his "Big Cycle" theory, describing an approximate 80-year pattern where widening wealth gaps, massive government deficits, and shifting geopolitical power (like China's rise) create internal conflict and global instability. He emphasizes that we are in a late-cycle, transitional phase where traditional powers like the US and UK face decline. For personal wealth protection, Dalio advises diversification beyond cash into assets like stocks, bonds, real estate, and particularly gold, which he prefers over Bitcoin. While he holds about 1% of his portfolio in Bitcoin as a non-printable hard asset, he views gold as more secure from technological or governmental threats. Regarding AI's impact, Dalio believes it will disproportionately benefit capital owners, worsening inequality by replacing both physical and cognitive labor. He suggests that human intuition and emotional intelligence, combined with AI, will be key for future workers. On taxation, Dalio argues that wealth taxes are impractical and risk triggering asset sell-offs, reducing productive investment. He points to the UK as a cautionary example of debt, low productivity, and political strife. Geopolitically, Dalio foresees a more regionalized world, with the US showing weakness in prolonged conflicts like with Iran, akin to past imperial declines. The ideal outcome, he suggests, is coexisting powerful blocs (e.g., Americas, China-Asia Pacific) without major war.

marsbit4 h fa

In Conversation with Ray Dalio: We Are Currently in an AI Bubble, with 1% of My Portfolio in Bitcoin

marsbit4 h fa

Daily 7.2 Trillion KRW: Foreign Capital's Record Net Buying on Friday! Wall Street Says Headwinds for Korean Stock Fund Flows Have Subsided

South Korean stock market sees a dramatic shift in fund flows. On July 31, foreign investors made a record net purchase of approximately KRW 7.2 trillion in KOSPI stocks, marking a fundamental reversal from the persistent large-scale net outflows seen in previous months. This contributed to a significant narrowing of foreign net selling in July to KRW 9.8 trillion, down sharply from KRW 48.4 trillion in June and KRW 44.5 trillion in May. Simultaneously, domestic institutional pressure eased. South Korean pension funds and asset managers turned to a net buying position in July, purchasing KRW 1.0 trillion worth of KOSPI shares, contrasting with net sales in May and June. Market volatility is expected to be dampened by new financial regulations. Effective July 31, the Financial Services Commission tightened access for retail investors to single-stock leveraged ETFs by raising the minimum cash deposit requirement. Trading volumes for these products subsequently dropped to about 50% of their monthly average. Citigroup Research maintains its year-end KOSPI target of 10,000 points. The firm cites several supportive factors: the substantial easing of headwinds from capital outflows, a robust fundamental outlook for the semiconductor sector, historically low market valuations, strong economic fundamentals, and the potential for policy support from financial authorities if needed.

marsbit4 h fa

Daily 7.2 Trillion KRW: Foreign Capital's Record Net Buying on Friday! Wall Street Says Headwinds for Korean Stock Fund Flows Have Subsided

marsbit4 h fa

Trading

Spot
活动图片





