Analyst Reveals Accumulation Level For Dogecoin Before It Rallies To $2

bitcoinistPubblicato 2026-04-25Pubblicato ultima volta 2026-04-25

Introduzione

A crypto analyst, Crypto Patel, predicts that Dogecoin (DOGE) could rally to $2, despite currently trading below $0.10. The analyst identifies a key accumulation zone between $0.07 and $0.09, where DOGE has repeatedly tested support without breaking down. Based on a bi-weekly chart using Elliott Wave theory, DOGE is in a Wave 4 consolidation phase within a descending channel. A bounce from this support is expected to trigger a Wave 5 rally, projecting a 2,767% surge toward $2. Price targets are set sequentially at $0.50, $1, and $2, with a stop-loss below $0.048. For a bullish trend reversal, DOGE must break above the $0.10 resistance level, which was recently rejected in April. Analysts emphasize that market conditions and a confirmed higher high are critical for the projected uptrend.

A crypto analyst is of the notion that the Dogecoin price will trade at $2, with this view being obvious, and most just can’t see it yet.

The meme coin is still pinned below the $0.10 threshold despite repeated attempts to break higher, but according to crypto analyst Crypto Patel, the chart is screaming for a breakout rally to $2. This prediction is based on a decades-long chart structure with a projection of DOGE bouncing off a strong accumulation zone.

Dogecoin Sitting Inside Accumulation Zone

Crypto Patel pointed to a narrow range between $0.09 and $0.07 as the most important accumulation level for Dogecoin right now. This is based on technical observations showing that the meme coin is already trading within that band and repeatedly testing it as support.

His accompanying bi-weekly chart spanning DOGE’s full price history from 2019 through a projected 2027 peak maps an Elliott Wave structure across two complete market cycles.

Source: Chart from Crypto Patel on X

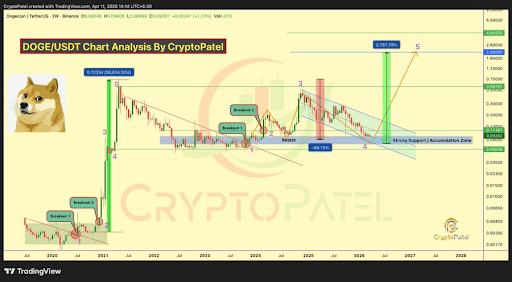
The previous cycle topped at $0.72334, representing a 26,834% gain from its base. The current setup shows Dogecoin in what Crypto Patel labels as Wave 4, which is a consolidation phase playing out within a support and accumulation zone.

Wave 4 has been playing out since the DOGE price topped out at $0.48 in December 2024. Since then, the price action has been characterized by lower highs and lower lows, and this has led to the formation of a parallel downward channel on the 2-week candlestick timeframe.

DOGE’s Projected Path To $2

This zone carries added significance because it corresponds with the lower boundary of the descending channel that has been guiding Dogecoin’s price structure for months. Notably, each retest within the $0.08 to $0.09 band has so far failed to produce a breakdown, and this means there are strong buy orders here.

The expected move here is a bounce from the lower trendline, with the green vertical arrow projecting a wave 5 extension that sees the Dogecoin price going on a 2,767% rally. This projected rally will see Dogecoin landing squarely around $2. Crypto Patel set his price targets at $0.50, $1, and $2 in that sequential order, with a stop-loss defined as a higher-timeframe close below $0.048.

Dogecoin is not in its breakout phase yet. Even with the larger bullish structure in place, Dogecoin’s broader outlook is dependent on market conditions.

The most important thing right now is breaking above $0.10. This price level was rejected on April 17, when Dogecoin reached as high as $0.102. A similar analysis from crypto analyst Trader Tardigrade interpreted this rejection as a clean retest after breaking out of a descending triangle on the daily timeframe. All that needs to happen now is the creation of a higher high that flips the downtrend into an uptrend.

DOGE trading at $0.09 on the 1D chart | Source: DOGEUSDT on Tradingview.com

Domande pertinenti

QAccording to crypto analyst Crypto Patel, what is the key accumulation level range for Dogecoin before it rallies?

AThe key accumulation level range for Dogecoin is between $0.09 and $0.07.

QWhat is the analyst's projected price target for Dogecoin's potential rally?

AThe analyst's price target for the potential rally is $2.

QWhat specific Elliott Wave phase is Dogecoin currently in, according to the analysis?

ADogecoin is currently in Wave 4, which is a consolidation phase.

QWhat is the significance of the $0.10 price level for Dogecoin's price action?

AThe $0.10 level is a significant resistance point that needs to be broken for the price to establish a new uptrend, as it was rejected on April 17.

QWhat is the stop-loss level defined by Crypto Patel for this bullish setup?

AThe stop-loss is defined as a higher-timeframe close below $0.048.

Letture associate

STRC Breaks Below $95: Why Does It Continue to Depeg? Is There Default Risk?

"STRC Falls Below $95: Why the Persistent Depegging and Is There Default Risk?" The article discusses the recent decline in the price of STRC, a perpetual preferred stock issued by Strategy (MSTR) designed to trade around a $100 par value. As of publication, STRC traded at $94.65, raising market concerns. STRC is described as a high-yield cash flow product, offering an 11.50% annual dividend paid monthly. Its "preferred" status grants it priority over common stock for dividends and in liquidation. Key reasons cited for the price depegging include: 1. **Bitcoin's Price Drop:** MSTR's assets are heavily tied to Bitcoin (BTC), which fell over 21% from its recent high, pressuring all Strategy-related products. 2. **Competitive Pressure:** Rival Strive Asset Management's similar product, SATA, offers daily dividends and has maintained its $100 par value with a ~13% yield. In response, Strategy has proposed changing STRC's dividend frequency from monthly to bi-weekly, pending shareholder vote. 3. **Technical Selling:** A break below $100 may have triggered algorithmic selling and stop-losses, exacerbating the decline. Regarding default risk, the analysis suggests it is currently low. Strategy founder Michael Saylor confirmed the June 2026 dividend rate remains at 11.50% with no cuts or suspensions. The company's massive reserve of 843,706 BTC provides a significant backstop for its obligations. Industry opinions are mixed. Some analysts view the BTC holdings as reliable support for dividends, while critics like Peter Schiff warn of potential dividend cuts leading to price crashes and lawsuits. Others highlight inflation risk and the company's ability to reduce dividends without a formal default. In summary, STRC's drop is attributed to BTC volatility, competition, and technical factors. While immediate default risk appears contained, the product faces challenges from market conditions and competitive dynamics.

marsbit42 min fa

STRC Breaks Below $95: Why Does It Continue to Depeg? Is There Default Risk?

marsbit42 min fa

AI Trading Cools, South Korean Stocks Plunge 1.8%, Spot Gold Rises 1%, Bitcoin Dives

A sell-off in AI-related stocks, triggered by Broadcom's disappointing earnings forecast, sent shockwaves through global markets. South Korea's KOSPI led Asia's decline, plunging 1.8% as the risks from concentrated chip stock gains and surging leveraged investments came to the fore. The tech-heavy Nasdaq 100 futures fell 0.5% following Broadcom's 14% after-hours plunge, which signaled a slower-than-expected transition to AI clients. This pullback extended Wall Street's weakness, halting the S&P 500's nine-day rally amid hawkish Fed signals and renewed Middle East tensions. South Korean authorities convened an emergency meeting, pledging "immediate measures" against market volatility and warning of record-high stock margin debt. The adjustment rippled across assets: Bitcoin fell to around $64,000, its lowest since February, while safe-haven gold rose 1% on bargain hunting. Oil prices dipped on Middle East ceasefire news. Market analysts noted the sell-off was driven by profit-taking after massive gains, particularly in chip stocks like Samsung and SK Hynix, which now dominate the KOSPI. Wall Street banks are divided on Korea's outlook, with Goldman Sachs raising its target while Citigroup and others warn of overvaluation and a potential bubble. Bridgewater's Ray Dalio noted that great technological shifts often create bubbles. Meanwhile, Fed officials' hints at potential future rate hikes added to the cautious mood ahead of key U.S. jobs data.

华尔街日报1 h fa

AI Trading Cools, South Korean Stocks Plunge 1.8%, Spot Gold Rises 1%, Bitcoin Dives

华尔街日报1 h fa

Seeking Alpha's Hot Article: Why Might the U.S. Stock Market Crash in June?

In a recent Seeking Alpha article, financial professor and analyst Damir Tokic argues that the US stock market may be poised for a significant crash in June 2026. The core thesis centers on a "mega-bubble" in equities, particularly within the technology sector, which has driven the S&P 500 to near-record valuations, with a Shiller P/E ratio exceeding 40—a level comparable to the 2000 dot-com bubble. Tokic identifies two primary catalysts for a potential collapse. First, he points to unsustainable market exuberance fueled by what he terms the "Trump Stimulus"—massive AI capital expenditure by tech giants, which he believes is politically driven and cannot last. Second, and more urgently, he highlights the escalating Iran war as a critical threat. The ongoing closure of the Strait of Hormuz has created a severe global energy supply crunch. Strategic petroleum reserves are projected to hit critically low operational levels by June, potentially causing oil prices to spike above $200 per barrel and triggering a severe, supply-driven inflationary shock. This scenario, Tokic warns, would force the Federal Reserve's hand. Despite currently maintaining a dovish bias, the Fed would likely be compelled to officially pivot to a hawkish stance at its June FOMC meeting to combat soaring inflation and bond yields. He contends that such a shift—or even a failure to act, which would destroy Fed credibility—could be the trigger that punctures the market bubble. The resulting downturn, he concludes, could rival the bear markets of 2000 and 2008, advising investors to prepare for a major correction.

marsbit1 h fa

Seeking Alpha's Hot Article: Why Might the U.S. Stock Market Crash in June?

marsbit1 h fa

Trading

Spot
Futures
活动图片