Venice Token has regained attention following a sharp price increase amid accelerated growth of the Venice AI platform. Recently $VVV traded around $13.71, marking a daily increase of 12.29%. The token also rose 16.30% over seven days, according to market data. Furthermore, trading activity exceeded $20 million in the last 24 hours.
The rally gained momentum after Venice co-founder Eric Voorhees highlighted significant annualized revenue growth. It is reported that Venice surpassed $100 million in annualized revenue after recently reaching $70 million.
Venice Token leads daily gainers as co-founder reports $100 million in annualized revenue
— BSCN (@BSCNews) August 17, 2026
Venice Token base:0xacfe6019ed1a7dc6f7b508c02d1b04ec88cc21bf rose about 7% to $12.64 today, topping CoinMarketCap's daily gainers among major tokens with volume up over 140%. The move... pic.twitter.com/FP6pmJH5TR
Revenue Growth Amplifies Bullish Narrative
Venice's revenue growth provides an important fundamental backdrop for $VVV's latest recovery. Reports indicate the platform was generating over $70 million in annualized revenue by July 1. It later surpassed the $100 million annualized revenue mark in about six weeks.
Notably, the platform reportedly achieved profitability in the first quarter. Venice also claims to have approximately 3.5 million users and 1.7 million daily API calls. Furthermore, its token model creates demand through the use of API credits and $VVV burns.
The project is reported to have burned 33.7 million $VVV, representing roughly 42% of the total supply. Meanwhile, the team is reported to hold over 30 million $VVV with zero selling. These figures could strengthen a long-term scarcity narrative if platform activity continues to grow.
Venice AI [ $VVV ] just crossed $100M annualized ↓
— Chain INK (@0xchainink) August 17, 2026
> $70M ARR on July 1. $100M now
> Profitable since Q1
> $1B valuation, $65M from Dragonfly
> 3.5M users, 1.7M API calls daily
> 33.7M $VVV burned, 42% of supply
> $5 per $100 of API credits burns $VVV
> Team holds 30M+ $VVV, zero... https://t.co/uDXwA33wXI
Venice also holds a $1 billion valuation following a $65 million investment from Dragonfly. Thus, further revenue expansion could become increasingly important for the $VVV market valuation.
$VVV Technical Structure Turns Bullish
The four-hour chart for $VVV currently shows a notable short-term reversal. The token has reclaimed its 20, 50, and 100 exponential moving averages. The price is now approaching the $13.50 Fibonacci resistance zone.
This level is an immediate test for buyers following the recent gains. A sustained four-hour close above $13.50 could confirm stronger upward momentum. Consequently, the next major target lies around $14.50.
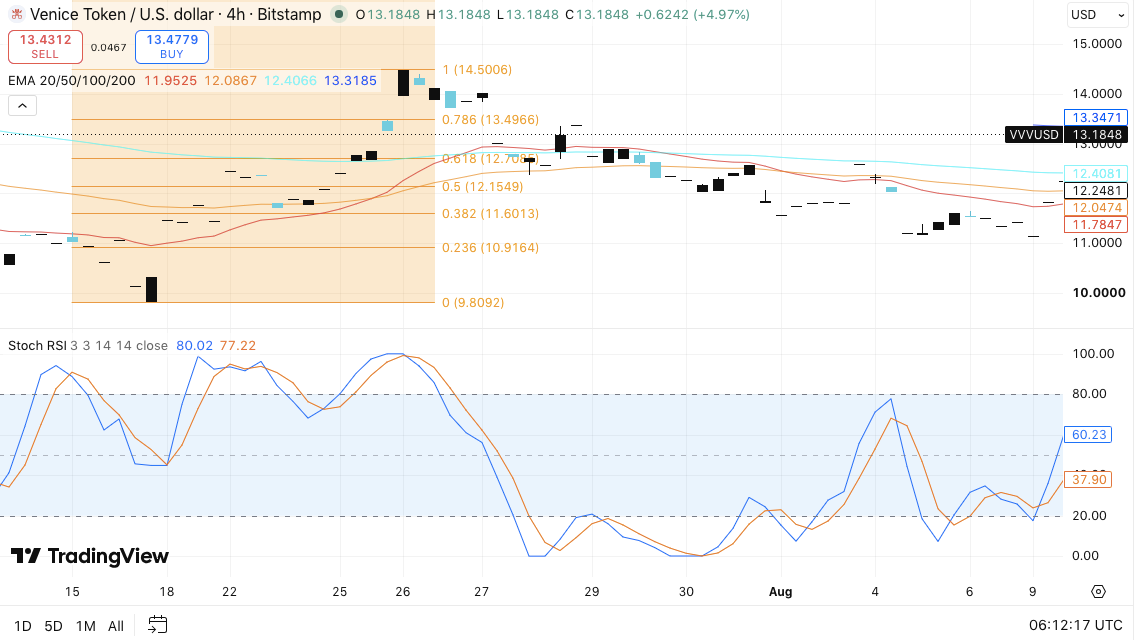
Moving beyond $14.50 could expose the $15 psychological level. However, traders should monitor momentum indicators closely, as the Stochastic RSI has risen sharply. The indicator is now approaching overbought territory, increasing the likelihood of short-term profit-taking.
Related: PI Price Forecast Remains Steady at $0.086 as Pi Network Reforms App Economy
$VVV could find initial support between $13.18 and $13.00 if sellers emerge. Below this zone, the $12.70–$12.41 region remains significant. The 50- and 100-EMA clusters are located in this area, providing buyers another potential defense zone.
Declining Open Interest Creates a Warning
Despite stronger price movement, derivatives participation remains significantly weaker than during $VVV's early rally. Open interest surged above $120 million in May and briefly approached $140 million.
Subsequently, the metric trended lower persistently through June and July. Several pickups failed to deliver a sustainable recovery in leveraged participation.
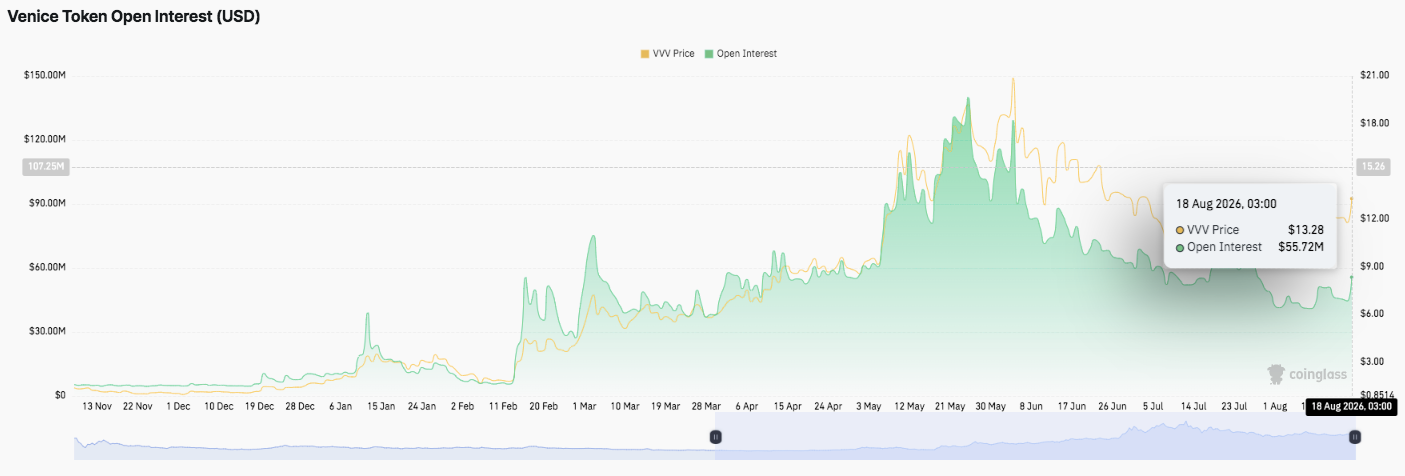
By August 18, open interest stood at about $55.72 million. This figure remains substantially below the previous peak, despite $VVV's recent price recovery.
This divergence creates an important signal for traders. Price has strengthened while leverage remains relatively subdued. Thus, the current uptrend may reflect improving spot demand rather than aggressive derivatives speculation.
However, rising open interest alongside further price gains could strengthen the bullish case. Such a move would indicate that new positions support the ongoing recovery.
Spot Flows Remain a Key Risk
Data on $VVV spot flows provides a more cautious picture. Inflows increased in April and May as the token approached the $20 region. However, significant negative net flows emerged in late May and June.
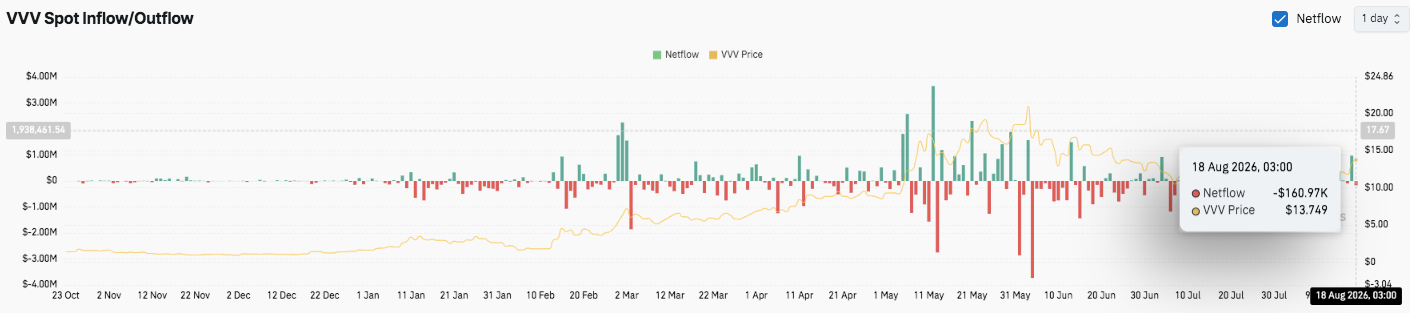
July continued with a mix of inflows and outflows. Nonetheless, outflow spikes typically outweighed buying activity. By August 18, the net flow was around minus $160,970, while $VVV traded around $13.75.
Venice Token Price Technical Overview
Key levels for Venice Token remain clearly defined as $VVV attempts to extend its recent recovery:
Upside Levels: Nearest resistance is $13.50, followed by $14.50 and $15.00. A decisive break above $14.50 could strengthen momentum toward the $15.00 psychological level.
Downside Levels: $13.18–$13.00 represents the first support zone, followed by $12.70–$12.41 in the area of the 50- and 100-EMA. A deeper correction could open $12.25 and $11.60.
Resistance Ceiling: $13.50 is a pivotal level capable of switching to stronger bullish momentum. A sustained 4H close above this zone could confirm the reversal and attract new buyer interest.
Will Venice Token Rise?
The short-term direction for $VVV depends on whether buyers can break through and hold above $13.50. Stronger spot market demand and rising open interest could support a move toward $14.50 and $15.00. However, persistent spot outflows and reduced open interest could stimulate profit-taking.
A failure to defend $13.00 would increase the risk of a decline toward $12.70–$12.41. For now, $VVV remains at a critical technical juncture, with improving fundamentals for Venice AI potentially serving as a catalyst for the next major move.
end-content