Author:0xsmac
Compiled by: Deep Tide TechFlow
Deep Tide Guide: While the market is shouting "fundamentals are dead" and capital is frenziedly flocking to tech giants, the author uses an astronomical discovery to expose the logical flaws behind this narrative. Starting from the components of valuation multiples, this article reminds investors to distinguish between the actual quality of a business and the premium the market is willing to pay, which holds particular warning significance for long-term allocations in crypto and tech fields.
I promise this introduction won't be as long as the last one about the weather.
But give me 90 seconds.
Over a hundred years ago, a woman named Henrietta Leavitt was doing tedious work: measuring the brightness of thousands of stars on photographic plates (the imaging method before film). She noticed a characteristic of a type of pulsating star: the slower these stars pulsated, the intrinsically brighter they were.1
This might just seem interesting today, like "okay, that's pretty cool." But at the time, astronomers couldn't tell the difference between a faint star close to Earth and a very bright star far away. For them, the smudge left on the photographic plate was the same. Apparent brightness was a messy mixture of these two variables: how bright the thing actually is, and how far away it is from us.
Henrietta's work separated these two things: if you could observe the pulsation rate, you could know its intrinsic luminosity; if you knew its intrinsic luminosity, you could infer the distance based on how faint it appeared. Astronomers call this a "standard candle."
A few years later, a man named Edwin Hubble found one of these pulsating stars, applied Leavitt's mathematics, and discovered that something he had thought was a gas cloud within our Milky Way was actually an entire independent galaxy, a million light-years away. So, in short, the observable universe expanded by about a trillion times, all because one person figured out how to separate what something looks like from what it actually is.
That's obviously cool in itself.
But another interesting thing is that around the same time, two other astronomers independently plotted a scatter plot, with one axis being intrinsic luminosity and the other being temperature. They found that stars didn't scatter randomly in this space but clustered into distinct families. The implication: stars with identical apparent brightness could, and indeed did, belong to completely different families, with completely different pasts, and most importantly, completely different futures...
So, What's Written in the Stars?
In recent years, there has been much discussion around markets, narratives, capital, company building, and financial nihilism. This sentiment seems to have reached a fever pitch as the tech and finance worlds confront a future markedly different from the previous few decades. Particularly evident is how noisy, and in many ways more reflexive, it has become to separate progress from asset prices. But as investors who make a living by buying assets (expected to) outperform, a simple framework is:
Forward return ≈ fundamental growth × change in valuation multiple (multiplied by dividends collected along the way).
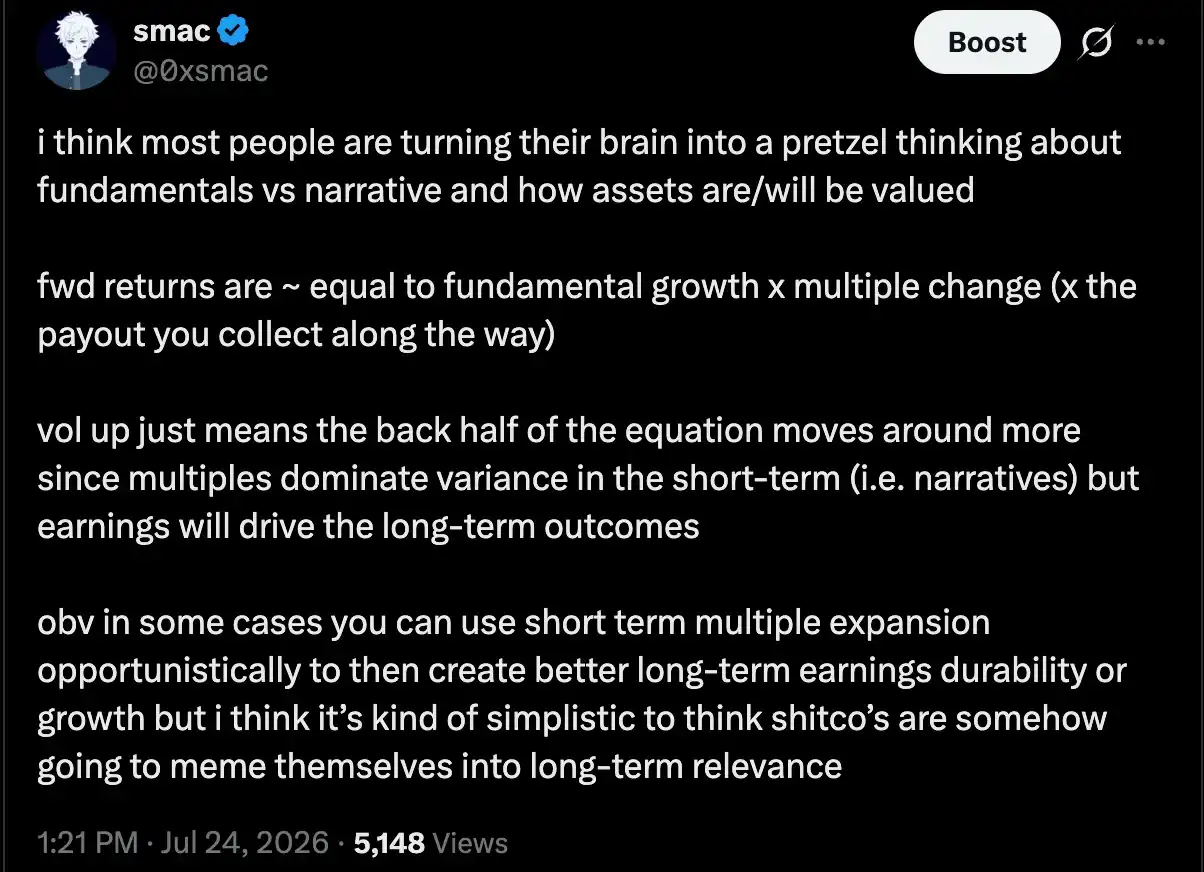
In this context, the valuation multiple corresponds cleanly to the smudge on the photographic plate. It is an observable data point that entangles two things the market cannot directly see: how good the business actually is, and how far away (or how durable) its future cash flows are. I believe most of the money to be made comes from investors most capable of untangling these two variables earlier than others (i.e., "differential cognition"), and we will continue to see staggering capital destruction for investors who treat the smudge as the star.
Value Investing Is Not Fundamental Investing
I think there's a misunderstood view: that fundamental investing has historically dominated excess return creation. This legend mostly comes from the lineage of Graham, Buffett, Tiger Fund, and the vast narrative built around them. People believed that around the 2000s, this method stopped working, and anyone investing that way was crushed by momentum, trends, and "just buy the tech giants." The conclusion once was (and still is?) "fundamentals are dead."2

The modern version of "fundamentals don't matter" isn't inherently stupid. It's rooted in many ideas our Compound team has written about before. The biggest companies get the biggest mechanical buying, winner-takes-all economics exist in software, AI means giants can translate scale into moats faster than challengers, and there are market microstructure reasons embedding momentum more deeply into our market infrastructure. These are all real. But similarly, the tech Magnificent 7 as we know them today outperformed because their actual earnings compound growth repeatedly proved, then reproved, their valuation multiples justified. Today, in August 2026, at least one view is that we are in/entering a new AI acceleration era where labs and hyperscale cloud providers with capital to procure and buy compute at scale will irreversibly pull away.6 No need to bother with valuation analysis, no need to ask how much growth is already pulled forward, or how large the economy must be to support everyone's expectations. Just hold a few names, ride the tailwind of the new tech paradigm, because fundamentals are just LARPing for those nostalgic for the old world.
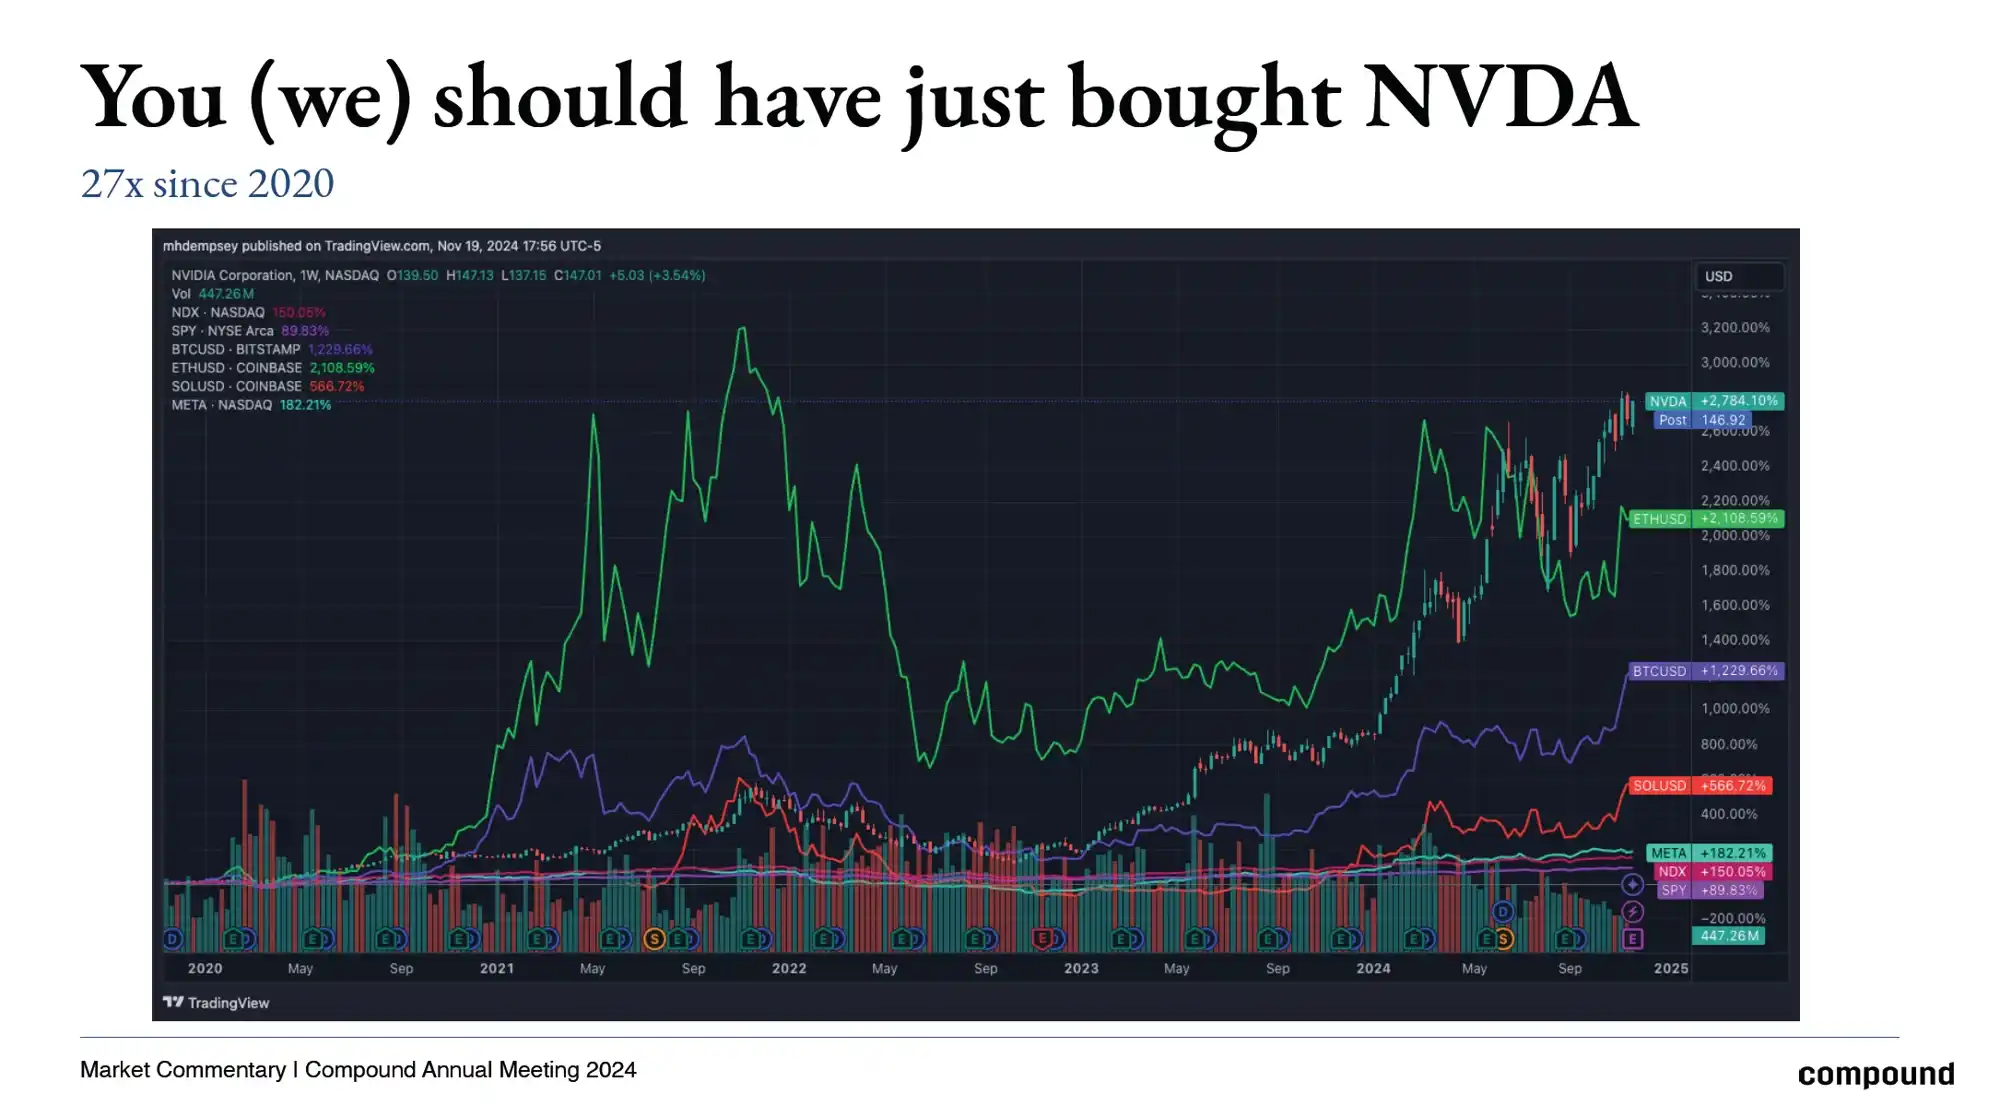
I even think that despite constant fear-mongering about how high concentration at the top of the stock market has become, there's still significant room for this concentration to grow.7 So, preemptively rebutting myself here: I don't think "it's already at peak power law" is itself a very strong argument.8
Nevertheless, the conclusion I listed above—hold these giants, watch them grow from $1-4 trillion companies to $10-20 trillion companies—has many deep-seated flaws.
First, this tune has been tried countless times, with a clear track record of underperformance.9 Critics will say "you don't get it," "this is the first time we're solving intelligence," "AGI," "computer god," "you think Jensen, Elon, Sam are wrong and you know more about business and the world than they do?" That's a Pandora's box for another day. But by definition, any truly disruptive technology invites this type of exaggerated prediction. Now there's a massive social media engine amplifying it. Also, I largely agree most jobs are made up and we'll keep making up new ones.10
Markets Are Becoming Less Efficient

We've also consistently seen that even these massive, constantly analyzed, and re-researched companies can be drastically mispriced. Meta is one of the most covered companies globally. It holds a de facto oligopoly in almost all markets it operates. Yet in late 2022, it traded at ~8x forward P/E. It was priced like a melting ice cube. Then it proceeded to skyrocket over 8x in front of people. The entire process was a valuation event. For this company everyone knows, there was huge disagreement on fundamentals.
Perhaps the sharpest point is that this increasingly popular underlying belief is itself positioning. I've been scrolling through many ideas lately, but in short, Silicon Valley's rising influence over financial markets has distorted how they operate and how participants behave. Too many people are now rushing to the other side of the boat.11

Alpha comes from others' mistakes or misjudgments. "Fundamentals are dead" has become consensus. I believe most investing cohorts only recently understood the degree to which narrative influences security pricing. But with the Silicon Valley complex occupying a prominent place in broader financial markets, this view is no longer fresh. Now even the dumbest person you know parrots "everything's a meme" to sound smart.
Many fundamental long/short managers have been culled. Replaced by people who bought QQQ fifteen years ago or systematic pod-shops. At least it's worth considering: when market consensus believes any contrarian cognition is a waste of time, betting against it might be timely.
Aside: I enjoy listening to Gavin Baker's podcast, but a recent episode gave me pause. He said everyone he met on his trip was more bullish than him. I don't disbelieve him. In fact, it matches my and many others' experiences visiting that city. But when he claimed not a single data point wasn't bullish, there's a clear disconnect. And this happened after memory stocks crashed 50%. This is exactly my point: many things can be true simultaneously. He might see robust long-term demand, companies trading at "relatively cheap" forward P/E. But simultaneously, valuation multiples for many companies might compress as the market pulled forward expectations.
If I said market pricing is usually wrong, that would be naive (arrogant). I'm inclined to believe prices contain a ton of signal. It's my (or any investor's) job to disprove that baseline. By the way, I do also think short-term markets are becoming less efficient. But most of the time, "cheap" companies are cheap for a reason. Most companies that get expensive usually fail to deliver on those forward expectations. So, this tension always exists when assessing forward returns at any point in time.12
Cognition Matrix
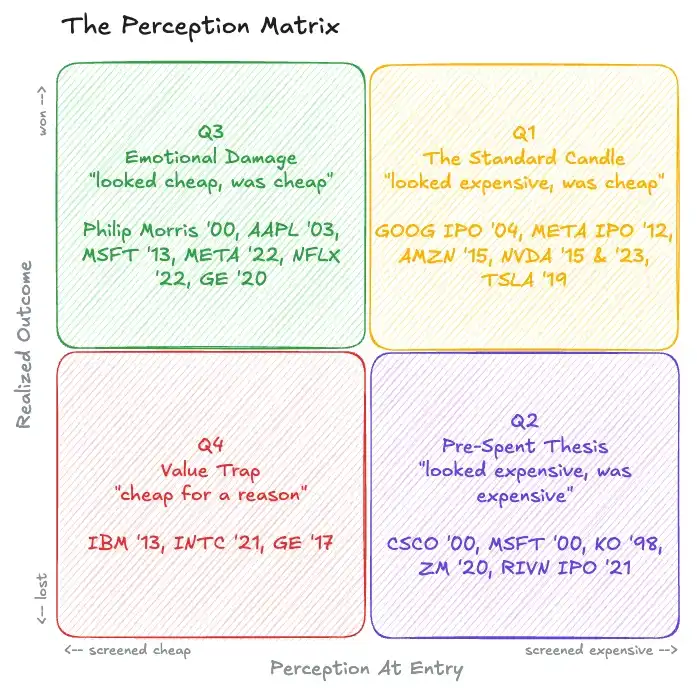
Quadrant 1 (Q1): Looked expensive at the time, was actually cheap in hindsight.
Quadrant 2 (Q2): Looked expensive at the time, was indeed expensive in hindsight.
Quadrant 3 (Q3): Looked cheap at the time, was indeed way too cheap in hindsight.
Quadrant 4 (Q4): Looked cheap, and was cheap for a reason. Classic value trap.
The most interesting thing about this broad framework might be that companies can be timestamped. I mean, you can take the same enterprise and place it in this matrix (we'll do that later). Depending on the point in time, it falls into different quadrants. Watching how companies move between quadrants is illuminating. Microsoft at 60x in Dec 1999 and Microsoft at 10x in 2013, obviously the same ticker, but should absolutely not be placed in the same quadrant.
Another obvious point: the outcome axis measures what you paid. That's completely different from how the company executed. This is something many in the crypto community should now understand deeply (hopefully). These quadrants express the gap between embedded expectations and future actual delivery.13
We'll come back to this later.
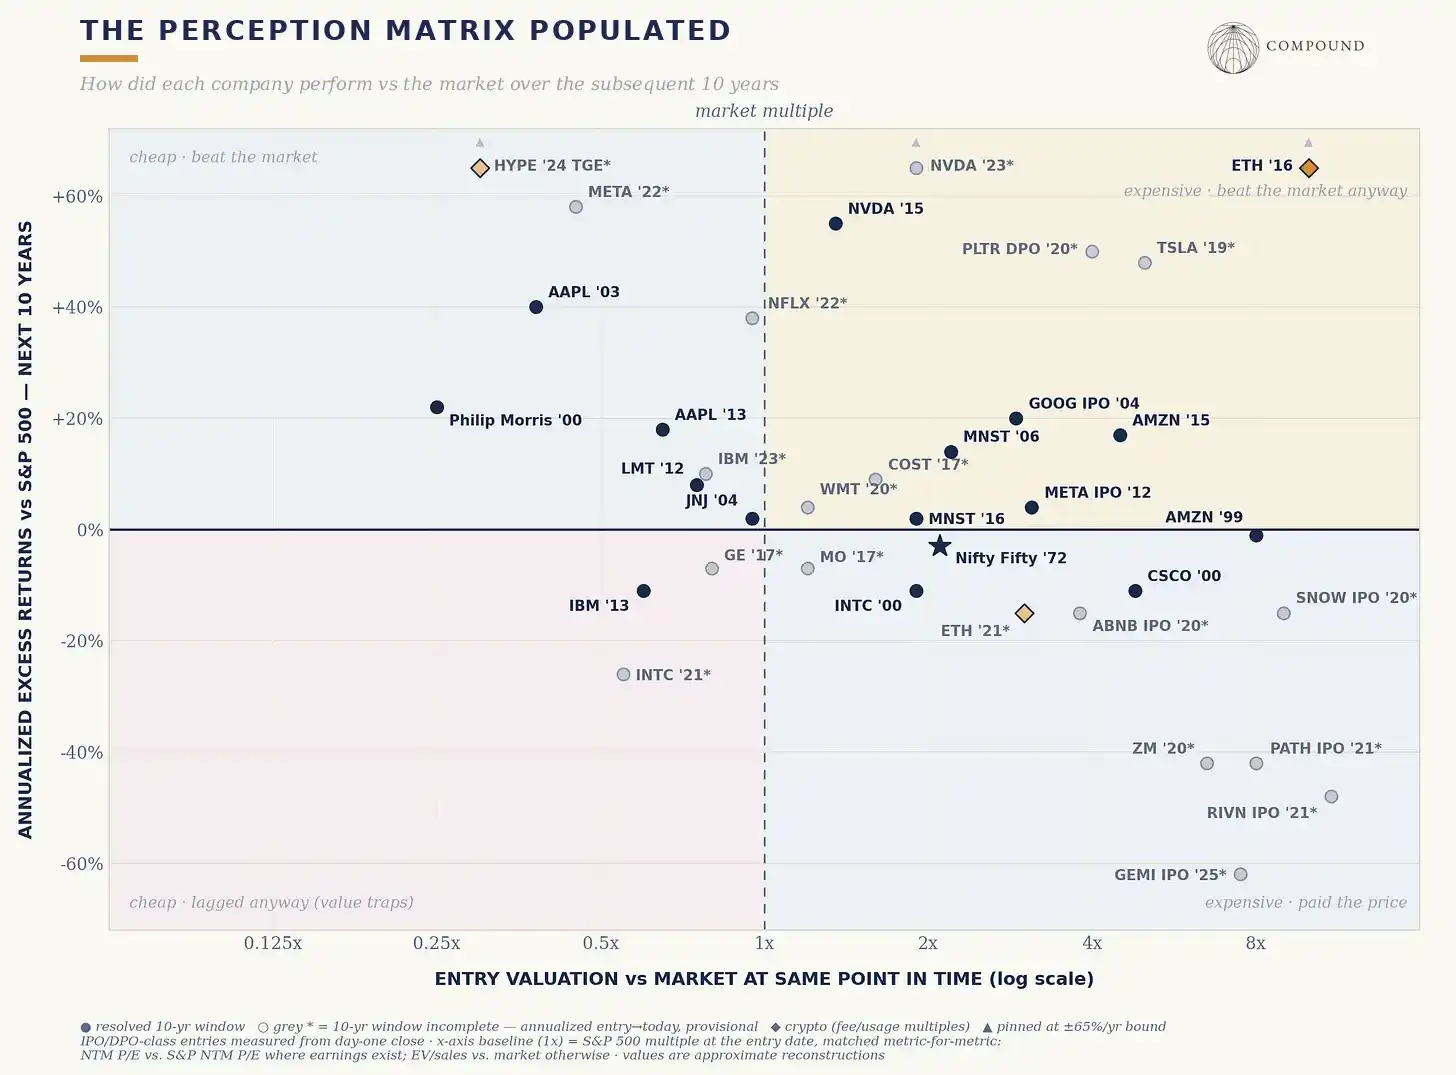
This chart is worth you staring at for a while, first to get familiar with what it shows, and to form your own first impressions. I selected a cross-industry sample of companies, clearly skewed toward tech. But I also designed a little game where you can see historically broader companies.
We could sit here all day contrasting companies clustered in similar locations. Cisco in 2000 and Amazon in 2015 are both in the far right tail of expensive. One was a 25-year round trip, the other has outperformed the market (a historic bull run) by ~8% per year. Nvidia in 2015 and Intel in 2000, around the median market valuation multiples of their time. The former outperformed the market by ~50% annually for a decade, the latter lost investors ~60% over the following 10 years.
What's in the Quadrants
A quick breakdown of each quadrant...
Q1: Looked expensive at the time, was actually cheap
This is the hot quadrant right now. Every VC wants you to believe their most important company is in this quadrant. Some certainly are, we'll see together which ones in the future. But rising Silicon Valley influence means we should examine what this implies for asset pricing structures.
If 15-20 years ago, tech optimists had far less voice, could there have been massive opportunities to benefit by holding assets priced based on underestimated growth assumptions? If we were in the middle of a transition from atoms to bits, having a significantly earlier read on software adoption than consensus was a huge edge. But as that belief system spreads and more capital allocators shift to a "growth is stronger than you think" attitude, at some point expectations become too high. Or at least, the requirement to see those growth expectations materialize immediately becomes unreasonable.
My take is that there will be fewer companies in this specific quadrant than in the past, and correspondingly more in the second quadrant.
This space is so fascinating because the best companies of all time cluster here. Often this seems to happen when a business fundamentally changes state.
Amazon in 2015. Tesla in mid-2019. As recently as Nvidia in May 2023.14
Then there's a special batch of companies whose hallmark is looking expensive for over a decade straight, yet proving to be outrageously cheap in hindsight all along.
HEICO – sells replacement jet parts. Valued at 25-40x earnings for nearly two decades, multiples usually reserved for hyper-growth. But compounded ~20%+ for decades.
Old Dominion – trucking company, valued at 25-30x while peers are ~10-14x. ODFL is up ~20x since 2012 as margins and network density kept improving.
Constellation Software – obviously recently hit hard by the software selloff. But this company is up 200x in public markets, traded at 30-40x FCF for the past decade.
Monster Beverage – perhaps the greatest modern stock, in my view.
The consistent theme here is that for businesses with long reinvestment runways and high incremental returns, consensus often systematically applies a mean reversion prior to the valuation multiple (i.e., compression from 35x to 25x), always keeping it one step behind the underlying earnings compounding (provided the reinvestment machine keeps converting, of course).
Quadrant 2: Looked expensive, was indeed expensive
Intuitively, as AI destroys previously protected margins for certain specific companies, many will slide here. Cisco is the archetype. The internet thesis was right, Cisco executed well: revenue grew from ~$12.5B to $57B, net income surpassed the 1999 peak by 2003, earnings compounded ~14% annually through the 2000s. Yet the stock didn't reclaim its March 2000 high until December 2025.15
This area often fills with directionally correct theses, just with attached prices that pulled forward a lot of future reality. Microsoft in 2000 is a milder version of Cisco, but 60x multiple compressing to teens cost shareholders an entire decade of returns. Coca-Cola is the non-tech version of the same story.
The 2020-2021 cohort of companies was a carnival of this shape. Snowflake. Zoom. Beyond Meat. Peloton. And many more. Generalizing slightly, the common error here is failing to interrogate the entire chain of correlation. We get swept up in the rhythm or scale of the market and its future.
"The internet will be big" (correct) – does not equal "Cisco is worth buying at 130x expected earnings"
"Remote work is permanent" (partly correct) – does not equal "Zoom is worth buying at 60x"
"Perps will eat CEX volume" (correct) – does not equal dydx will win the category
At least there's a signal here: if the bullish logic mainly revolves around category thesis, and the valuation defense vaguely points to TAM, that's far from analytical. Someone in the room has to ask: what's already priced in.
Quadrant 3: Looked cheap at the time, and was indeed way too cheap.
Honestly, probably the least interesting for most readers. But weirdly, cigarettes are back now, and relevant again. From the S&P 500's inception (1957) to 2003, the best-performing stock was Philip Morris. Yet the best time to buy was at the hate peak during the litigation disaster, when the company fell to ~6-7x earnings (while yielding ~9% dividends). Essentially priced to die.
This spot is hard to play because many of these companies are either boring – cash flows roughly stable, arithmetic of capital return is attractive. But you need to be incredibly precise about what catalyst pushes marginal buyers in.
Apple in 2013 – ~10x earnings (and that's before netting cash). Because people decided iPhone was a hardware cycle destined for commoditization. Einhorn (then Icahn) made the now-obvious-seeming argument: retention & ecosystem lock-in, and the balance sheet could buy back massive amounts of shares.
Microsoft in 2013 – for a while people thought it would become the next IBM
Exxon in 2020 – kicked out of the Dow (lol), priced for some accelerating final decline scenario. Since then, it's up nearly 5x vs the company that replaced it in the Dow (Salesforce).
Meta in 2022 – mentioned some earlier
I think companies that ultimately land here might have another shape, one related to a kind of despair. Philip Morris perhaps fits (at peak "smoking kills" sentiment), but others like AMD, Domino's, Carvana. Solana in late 2022 is another example. Even Hyperliquid at TGE looked exceptionally cheap.
For this group, the consensus error seems to be the market extrapolating a temporary emotional state into some new fundamental reality. Could be various, but in these examples it's revulsion (tobacco, oil) and trauma (FTX blowup, Meta throughout 2022). In a sense, it might also be the most susceptible to career risk; if holding these makes you feel embarrassed in front of others, that might be a signal.
Quadrant 4: Looked cheap, and was cheap for a reason.
Many examples of this. IBM in 2013 is the modern archetype. Revenue declining year after year, brutally, buybacks that attracted many investors were just management using shareholder money to fight gravity. Intel in 2021 is similar. Countless articles have been written about this dynamic, so I won't dwell.
Unpacking All This
This goes back to the earlier formula:
Expected Return ≈ Fundamental Growth × Change in Valuation Multiple (× Dividends collected along the way)
Each entry in the matrix is some tension between the first two terms. Over shorter horizons, the valuation multiple term dominates variance, which is why markets feel purely narrative-driven. But as we extend the time horizon, the fundamental term takes over.
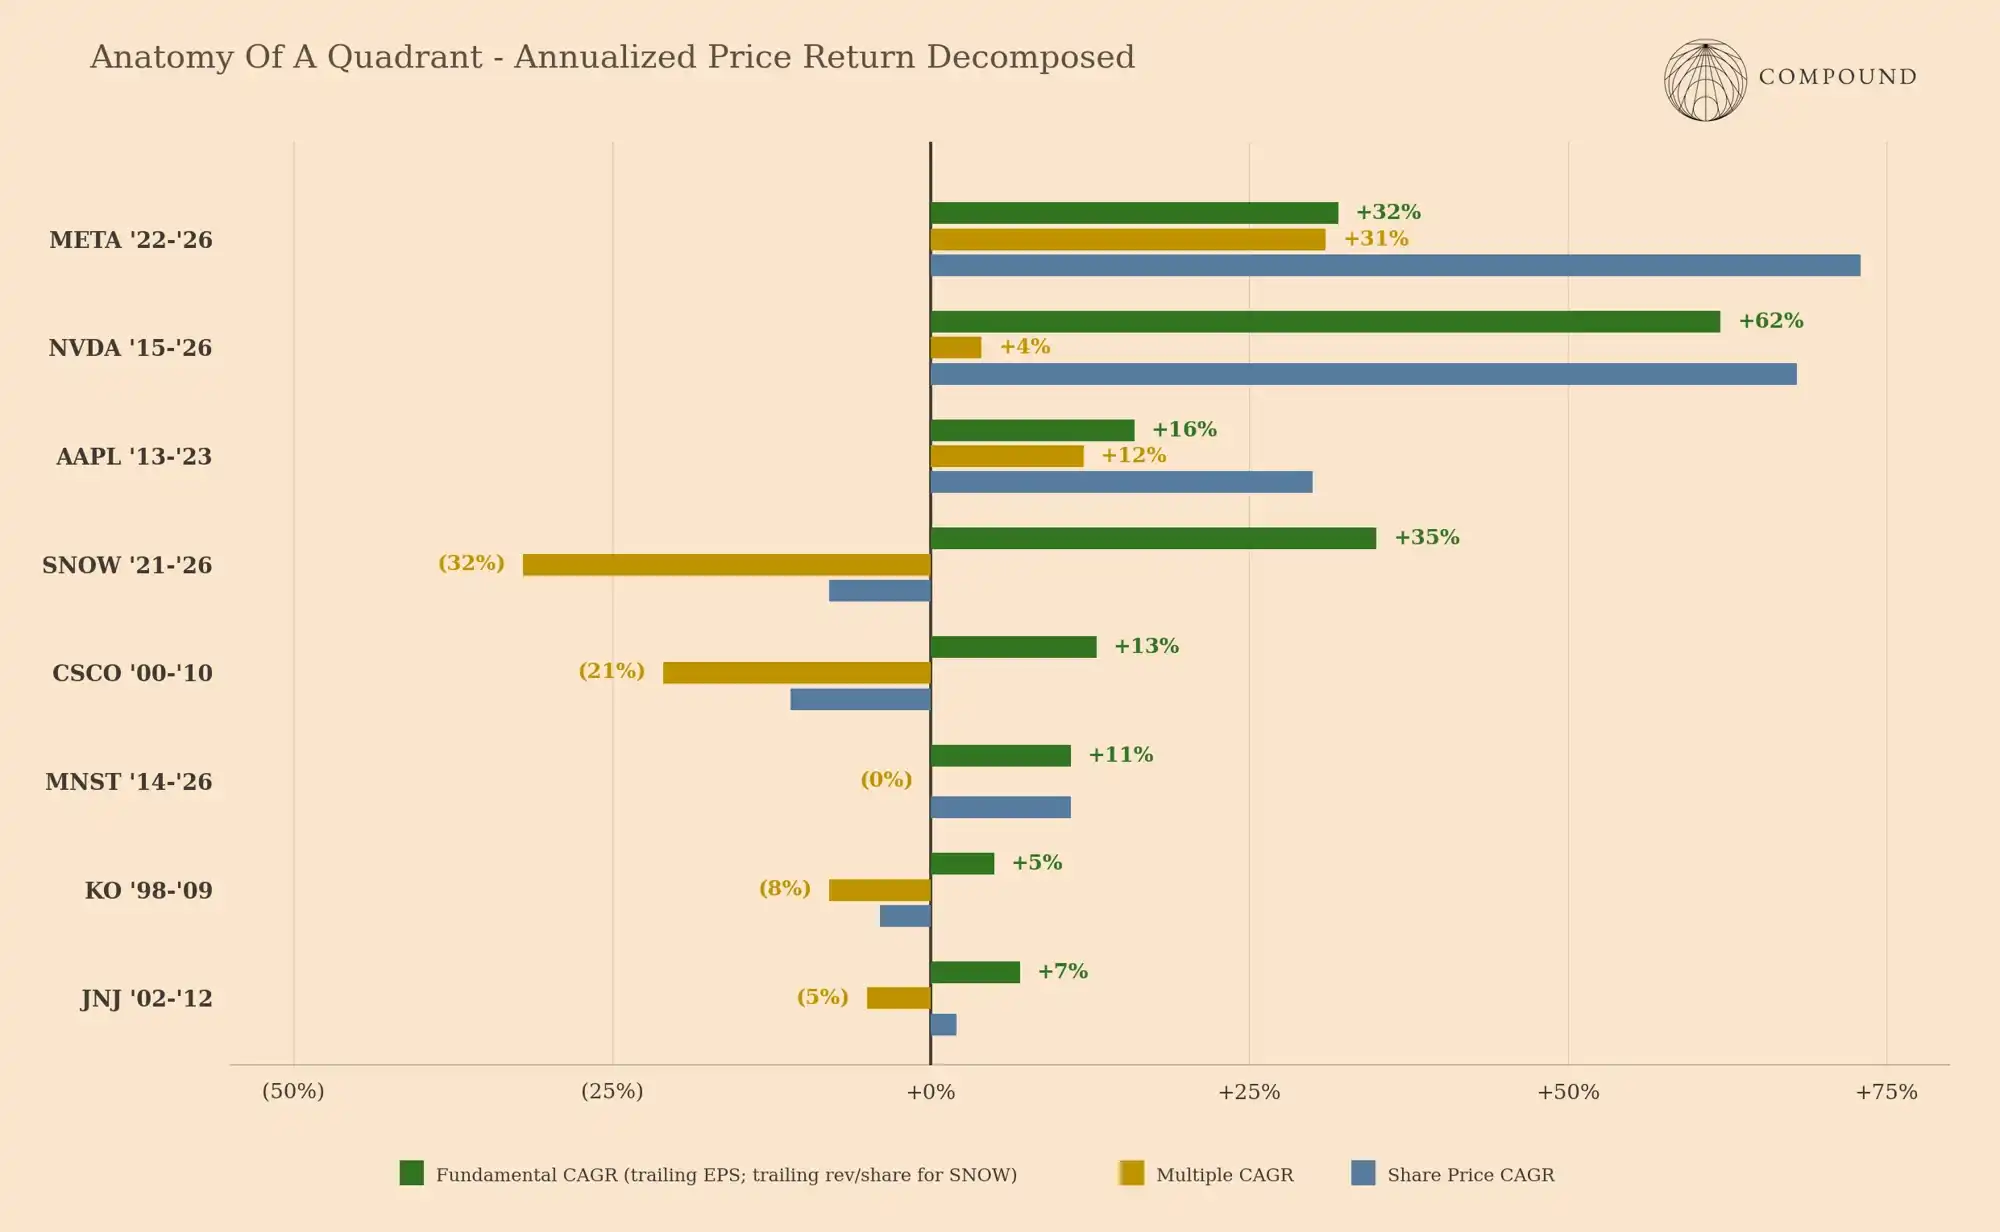
Some observations:
I don't think the cluster of pure multiple victims (like Cisco & Microsoft around 2000, Snowflake & Zoom around 2021) is coincidence – the fundamental bar is positive, but multiple contraction is severe, just means the entry price had pulled forward these and more.
NVDA '15 is the purest earnings story on this chart
Double plays happen when you get fat excess returns (Apple '13, Microsoft '13, Meta '22), earnings growth plus valuation re-rating
Coca-Cola and J&J are fairly brutal flatliners, while the equity market was compounding far above them
Though, it's worth noting that even with persistent multiple compression, an asset can still win if underlying long-term earnings growth continues to pay the "de-rating" toll.
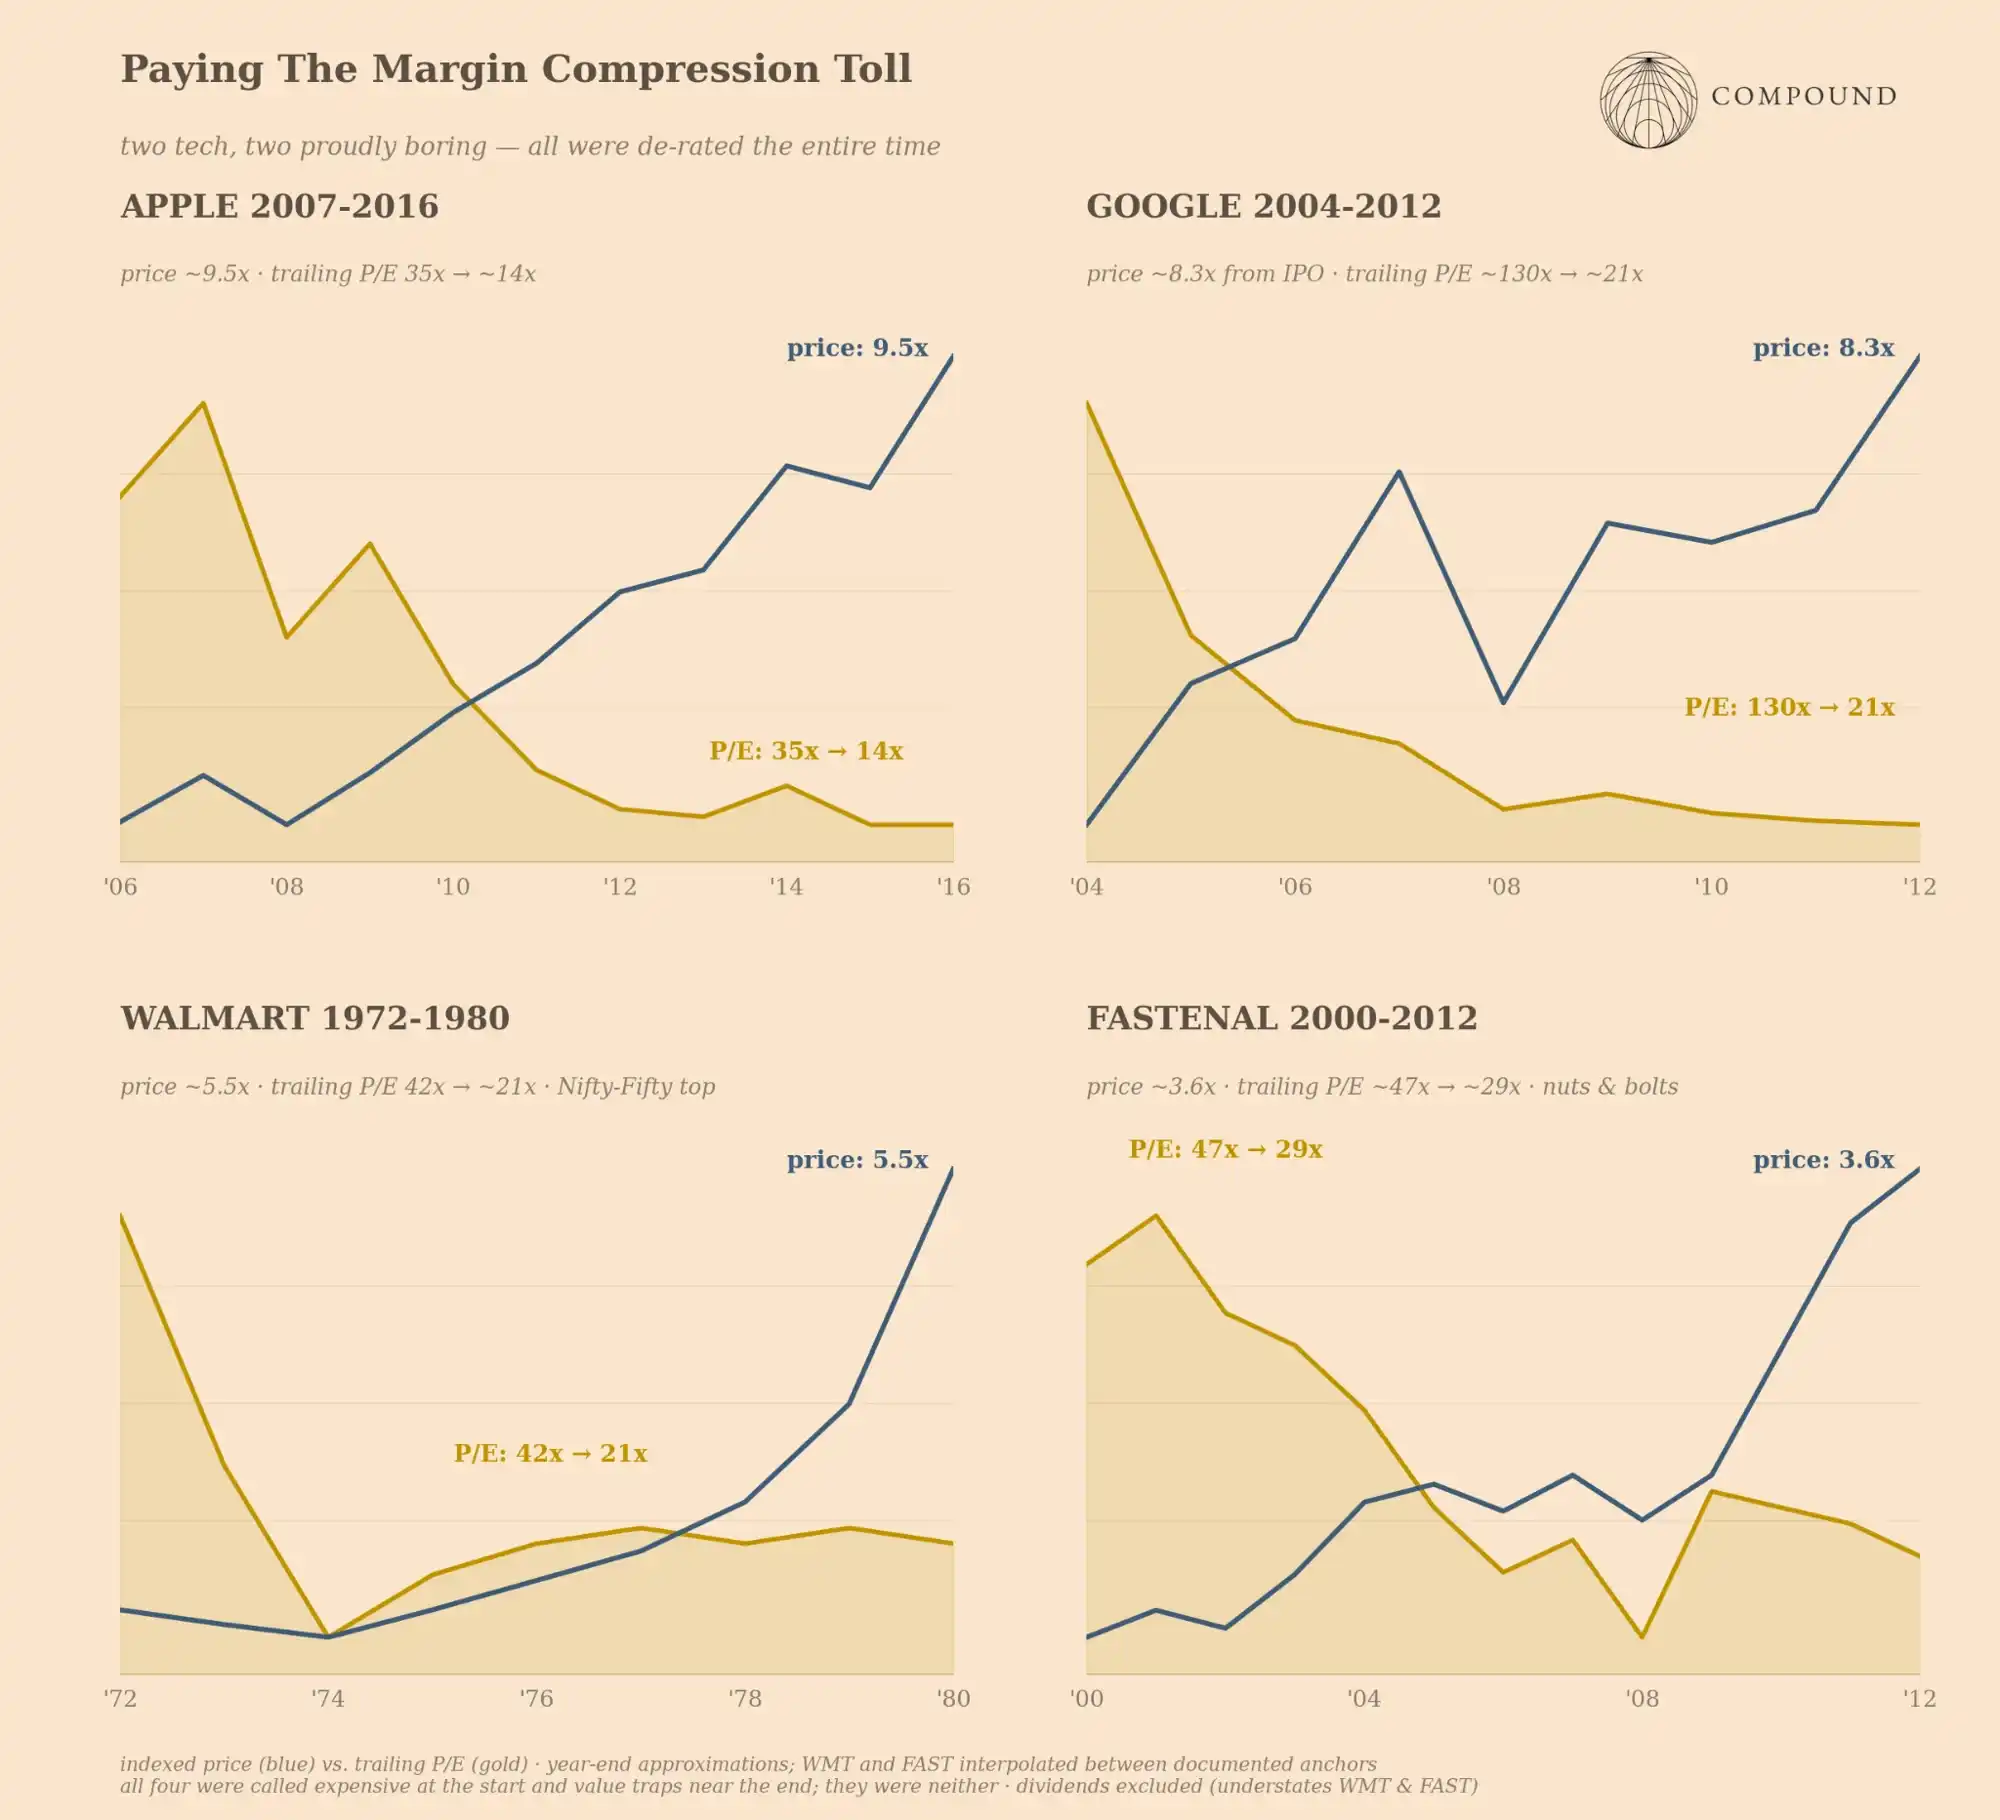
A final point worth reiterating is that the common error for each archetype is failing to unpack the two variables in the multiple, just in different forms. Two archetypes make directionally opposite errors on duration, i.e., underestimating long runways or long declines. Two archetypes make directionally opposite errors on quality attribution, like misattributing category quality to the wrong asset, or smearing an emotional stain on a "clean" asset.
Will This Continue?
I actually think this accelerates. There's a view that with fewer humans making decisions, plus access to near-infinite data, markets are becoming more efficient. I don't buy it. If anything, markets are becoming less efficient, the world more turbulent. This gap between perception and reality isn't an artifact of past market eras. I'd be surprised if this gap doesn't widen over the next 5-10 years.
Market composition has shifted toward businesses with more opacity in fundamentals and growth than ever. Widget factories are a world apart from the business models we see now (and will see). Today, due to top-heavy concentration, even the index itself inherently has longer duration.
The convection engine I wrote about before almost manufactures these Q2 and Q3 companies at industrial scale. Rotating narratives mean whoever is in the eye of the current storm can overshoot in both directions. Each cohort maturing births a new batch of these.
AI simultaneously kills cheap versions of jobs and elevates prices for "real" or harder ones. Everything screenable (multiples, comps, filings, call sentiment) has been commoditized. Windows to capture alpha via data-driven approaches shorten rapidly each time. But if we hypothetically assume everyone has the same perfect readable layer, then all advantage comes from decisions and judgment around the unreadable layer.
Private markets are absorbing a larger share of some of the most extreme cases among these. These things aren't continuously priced, so the multiple debate is temporarily hidden.
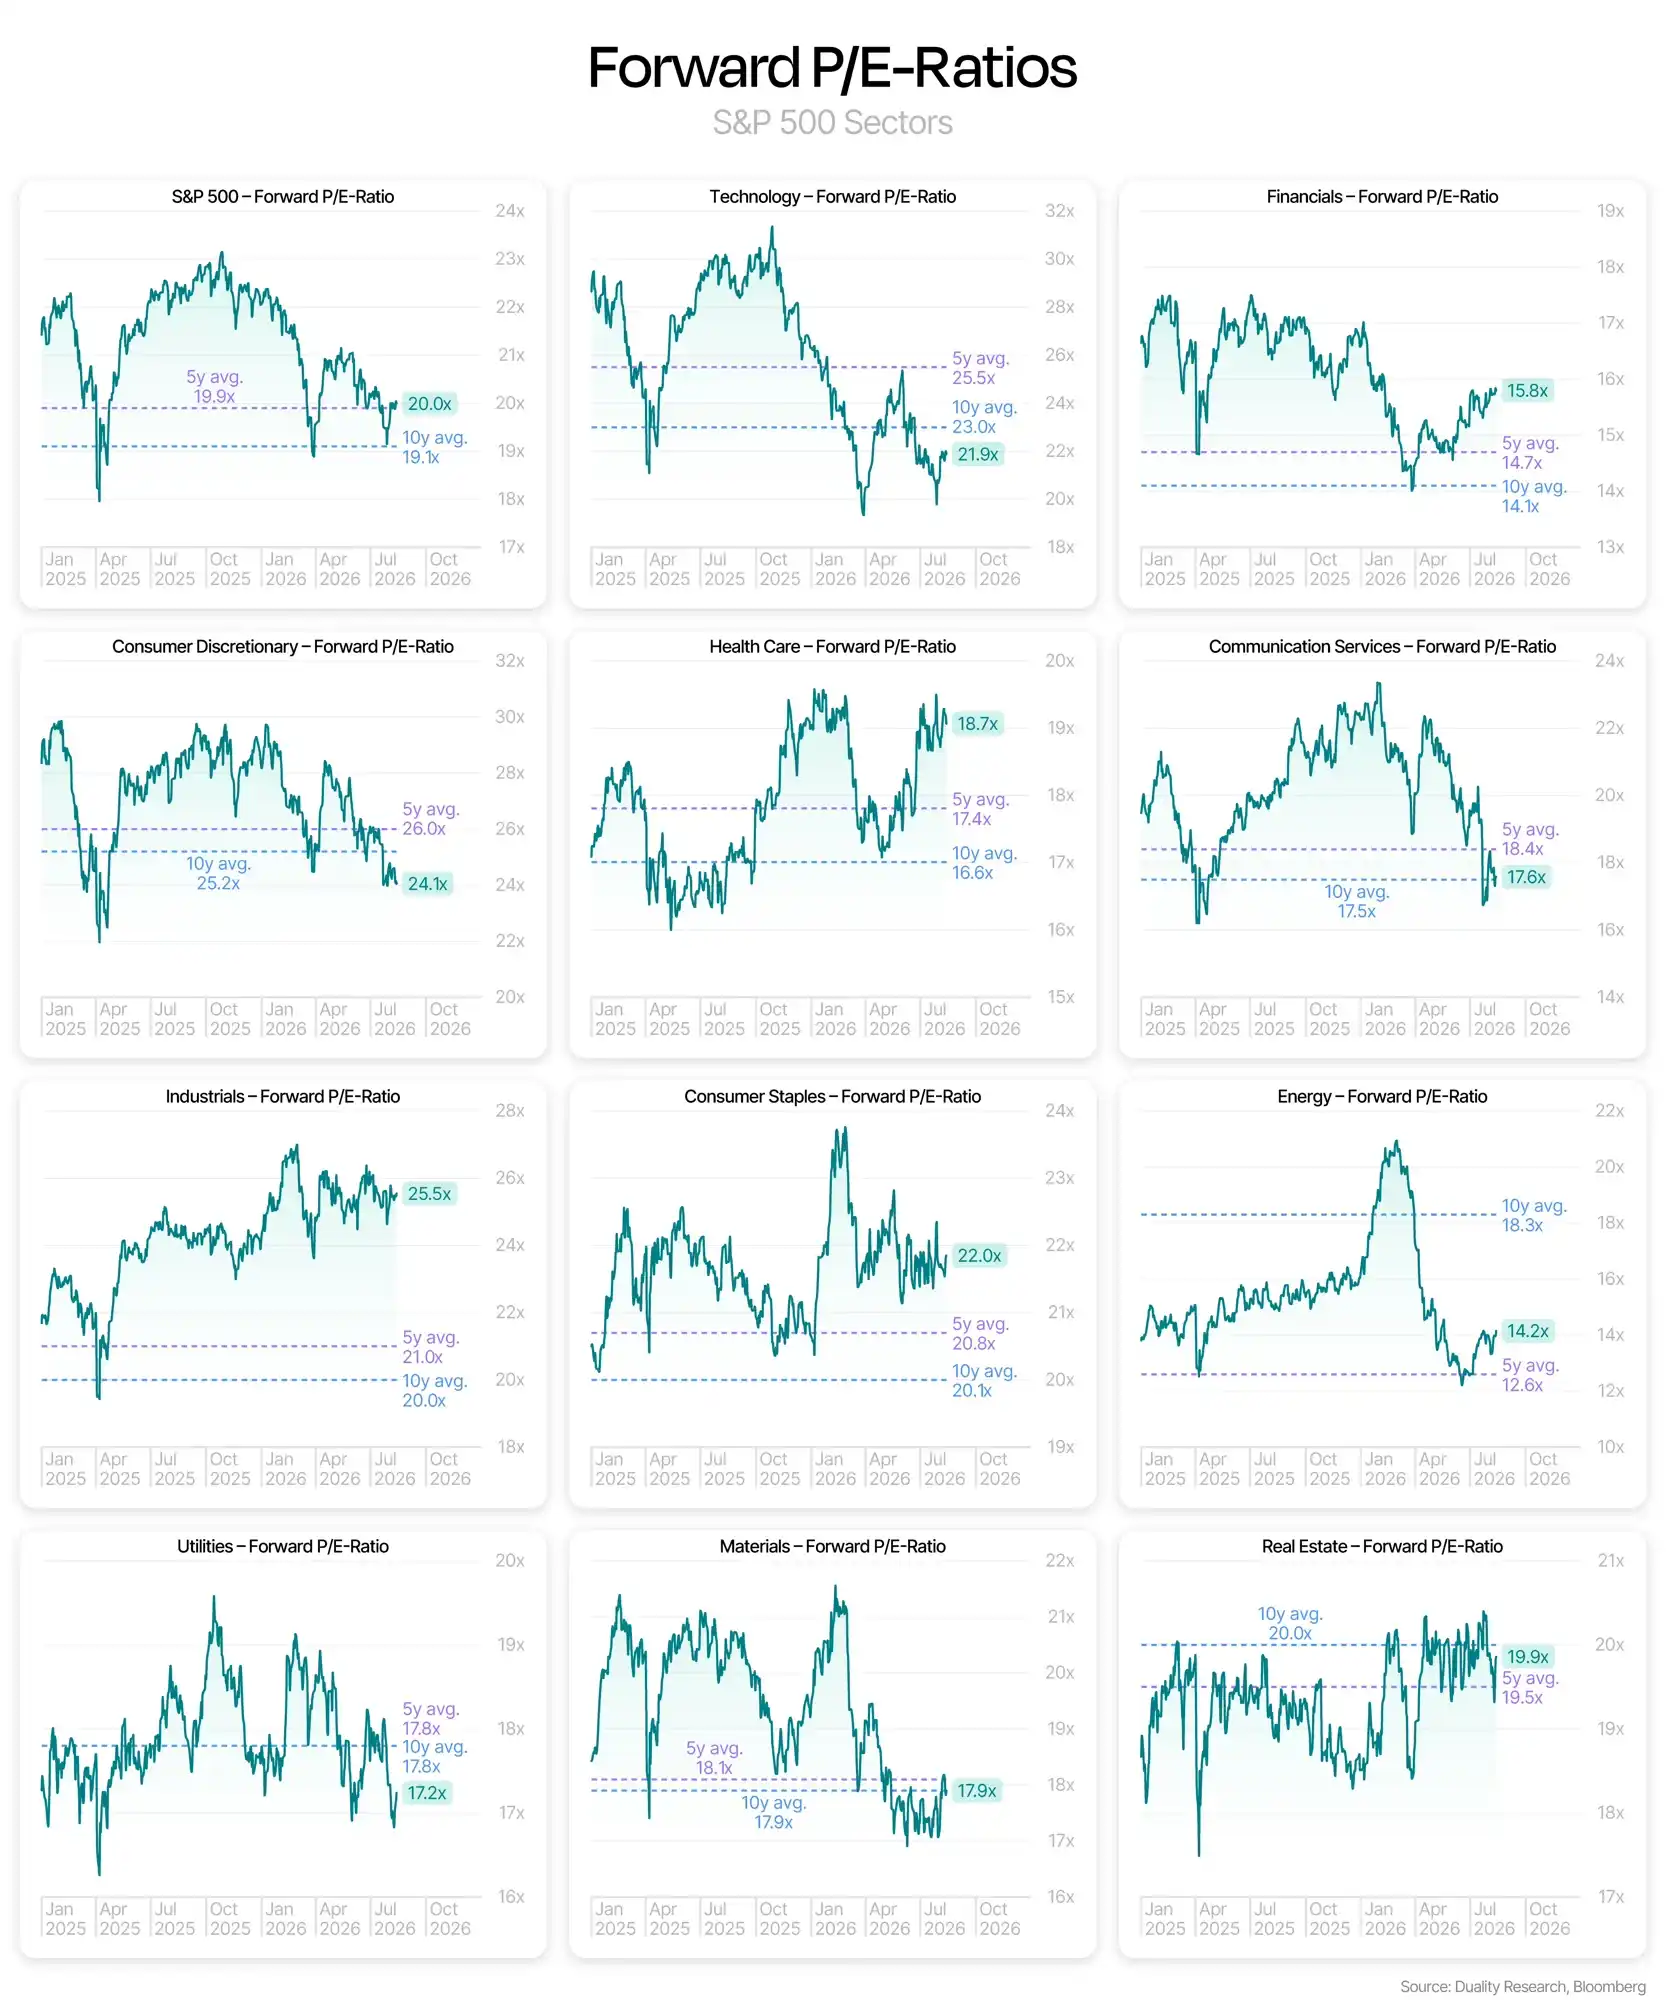
There are many reasons why now is a unique moment. But even as I write this, I'm inclined to say: "In today's world, the biggest risk is thinking these companies look expensive, but they'll grow into and beyond current expectations." But I'm not sure that actually holds. Mainly because, at least in public markets, these companies aren't historically expensive on valuation.16 These companies' earnings grew at almost unthinkable speed, so we actually saw multiples decline.17 That's the good news.
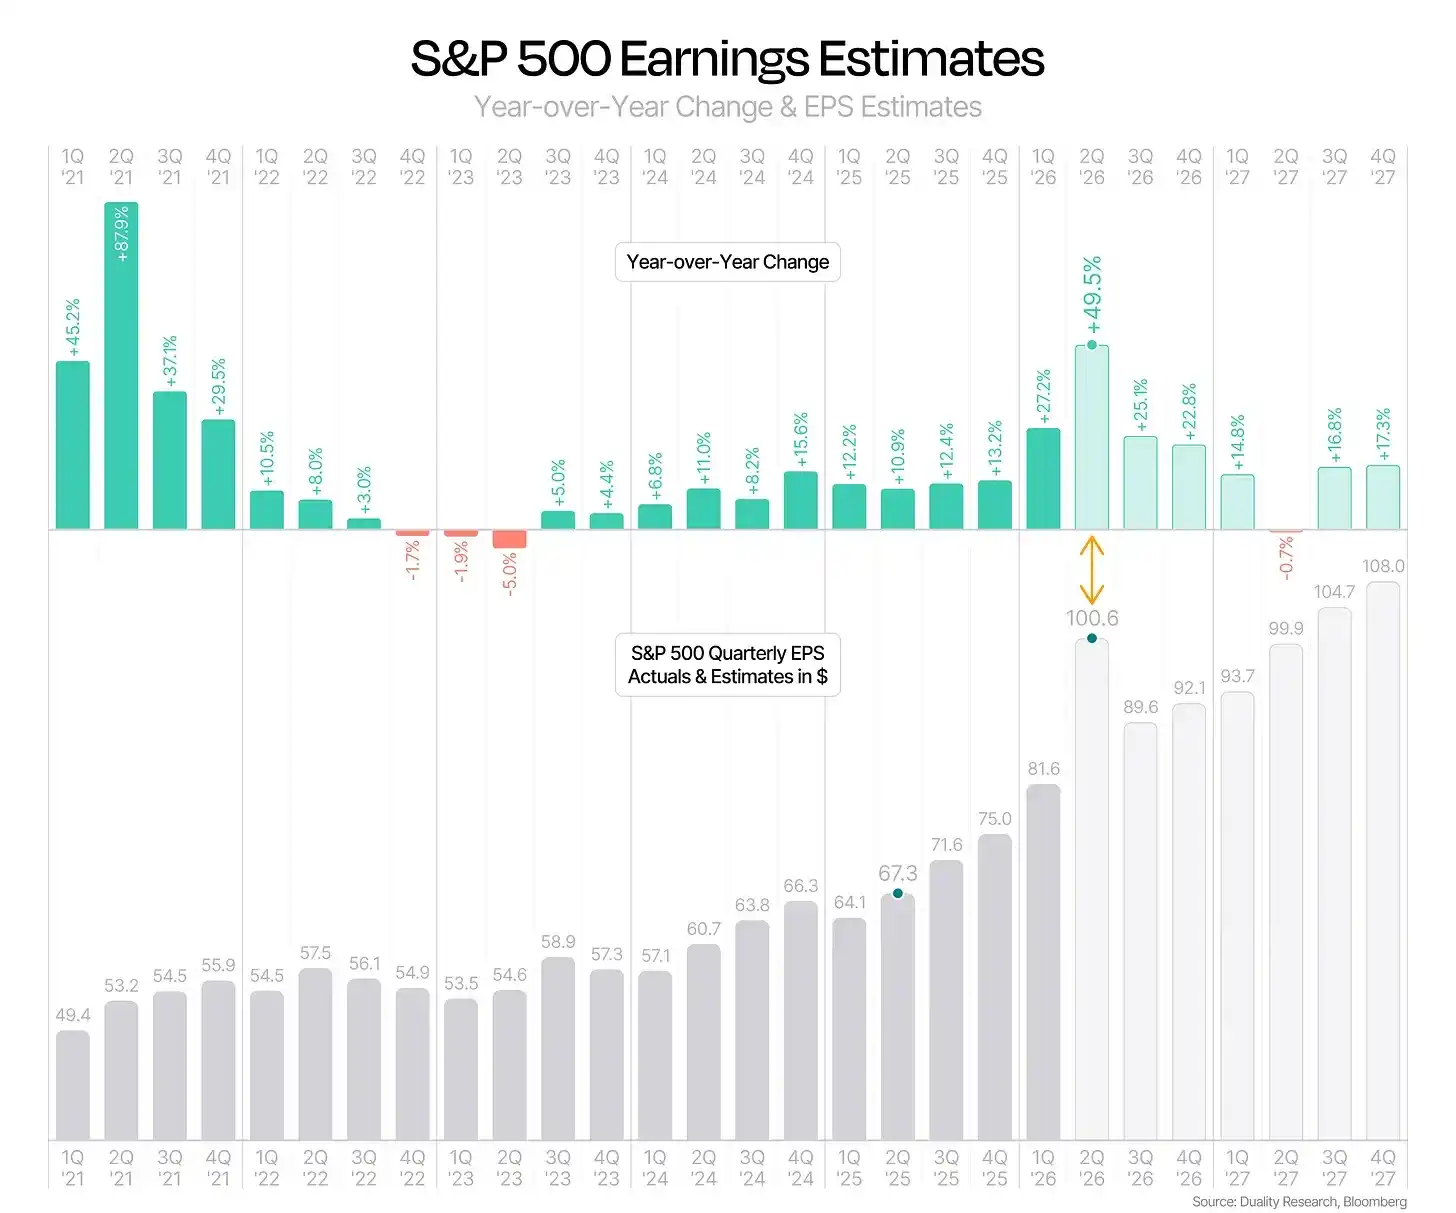
The bad news is, what if we're past peak growth? In a world where growth is slowing, would you expect multiple expansion? Do you really believe we're on the cusp of sustained 8% GDP growth? Do you know the last time that happened in US history? Will this time be different? I'm being deliberately provocative here, because reality is complex, and I think it will continue to be so. There's a lot happening out there besides AI.
Every prominent founder, investor, media brand, and philosopher has an incentive to perpetuate a narrative: taking valuation risk (i.e., Q1) is a necessary part of the new game today. It keeps money flowing. It lets people say things like "we're democratizing intelligence." It raises the stakes in the ultimate chicken game. But it also tilts the board toward momentum investing. That's a much more fragile game when we're talking about physical world constraints and supply chains, not SaaS businesses. There's immense leverage and long-duration assumptions embedded throughout this complex system. Even a slight hiccup in timing or scale ripples heavily through the chain.
It's possible everything works. That would be the ideal. But whether we get euphoria or dystopia, the path-dependent nature of markets means, looking back 5 or 10 years from now, we will almost certainly laugh at how [some] company looked at [some] forward multiple. The only question is what kind of laugh that will be...
Thanks for reading Semi-Conscious Thoughts. Subscribe if you want more. Don't if you don't.
Thanks to mike, jmo, and BR for feedback helping clarify thoughts.
Disclaimer:
The content on this site is for educational and informational purposes only. Anything above does not constitute an offer or solicitation to buy or sell securities or equity. It is not a substitute for professional advice. Investing involves risk, including potential loss of principal.
1. Intrinsically brighter, meaning they actually are brighter, regardless of how they look from Earth.
2. I'm exaggerating a bit because fundamentals for most large tech have been excellent.
3. Holds true in the US and 12 out of 13 broad international markets.
4. Ken French database
5. Most famously Ben Graham and Warren Buffett. Buffett famously pioneered the tradition of investors making annual pilgrimages to Oklahoma to hear from Oz.
6. Not a coincidence that when asked about moats in this emerging world, Sam starts with the idea of scale: "Superior intelligence can migrate from any product to any other product. Network effects still have competitive advantage. Economies of scale and the ability to make the cheapest compute cluster still have competitive advantage."
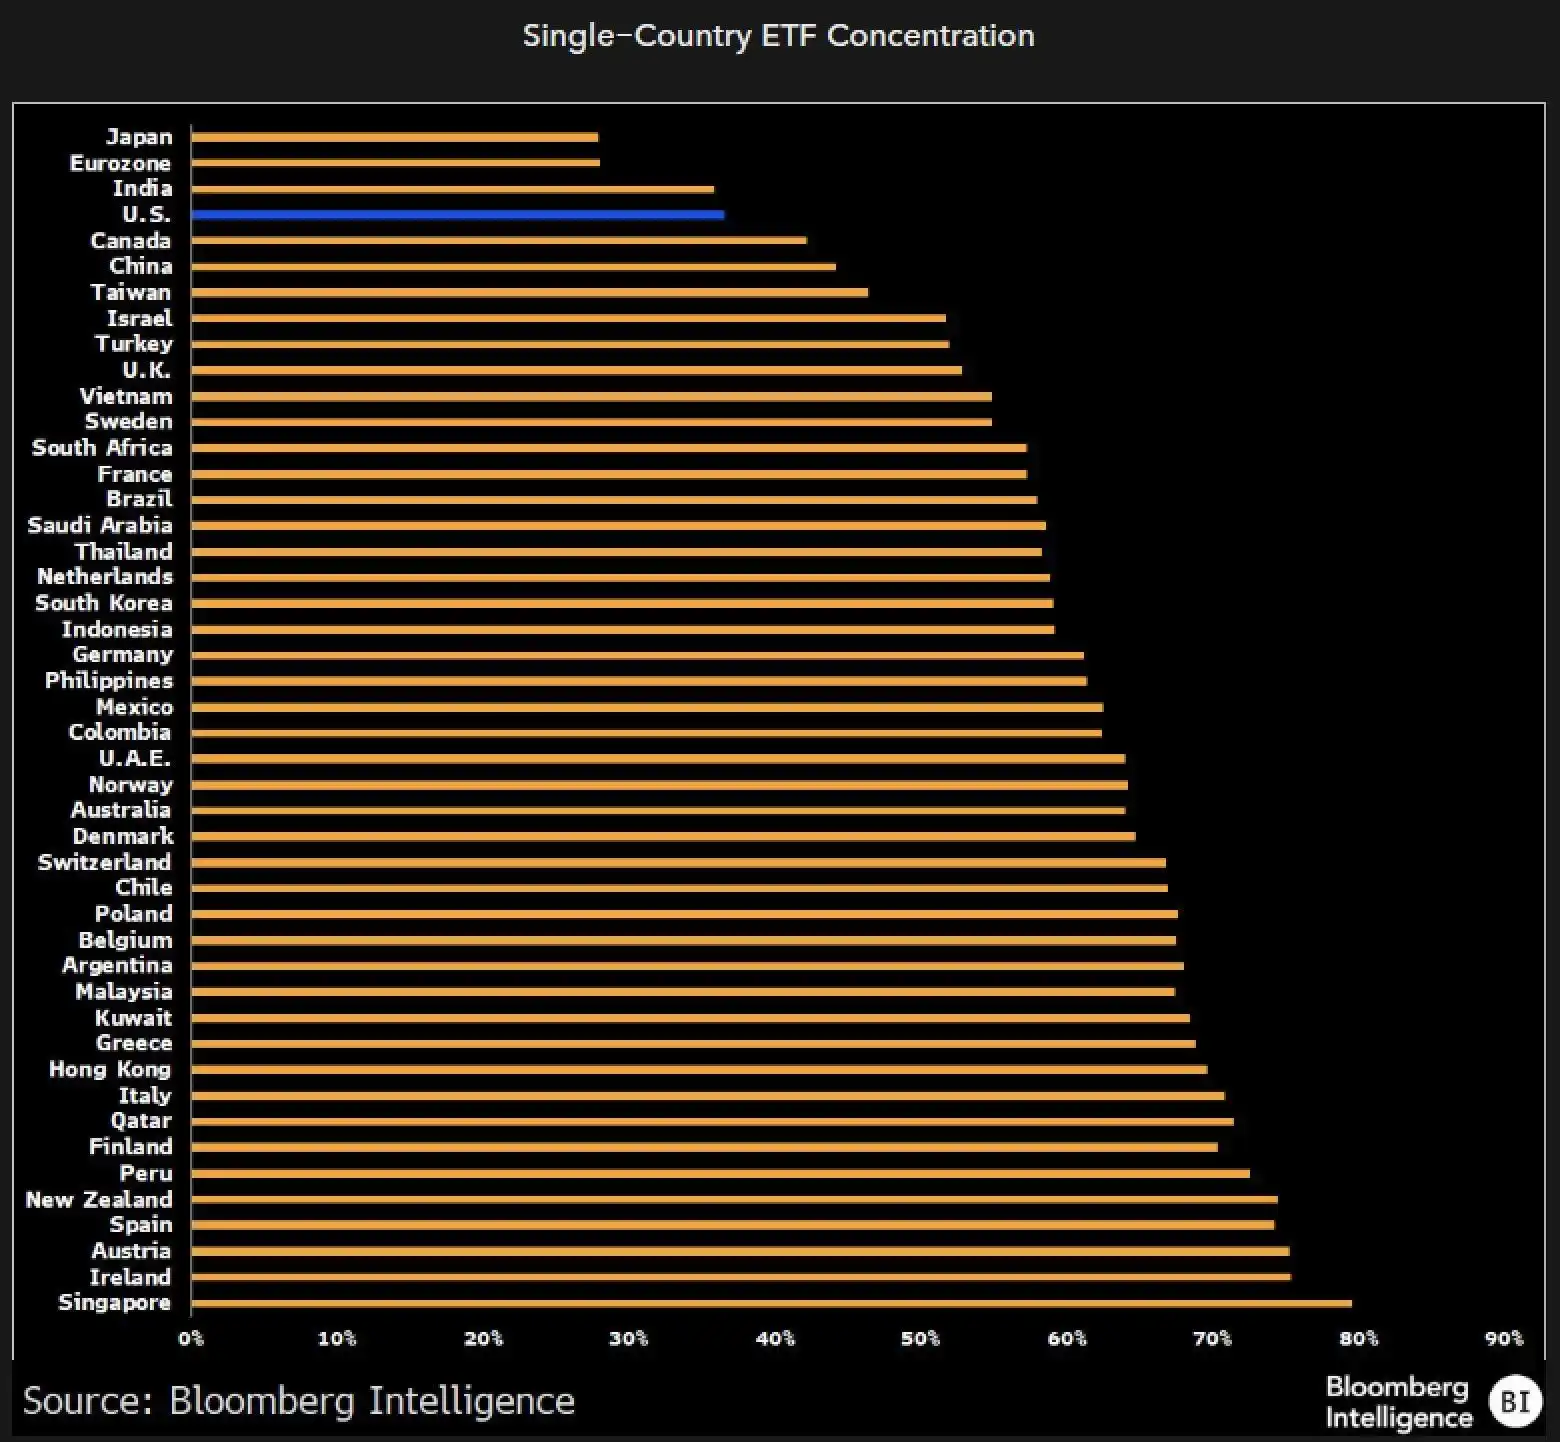
7. One caveat is there's a point where, despite growth, the market discounts multiples of these mega companies due to the law of large numbers. I think we've seen this with NVDA.
8. A bit dated now.
9. It's a bit funny that everyone agrees with the 80/20 rule, but we don't see companies firing >50% of employees each year.
10. Here are two related tweets I found relevant to this broader discussion.
11. Of course it's easy now to say you should have just held NVDA over the past 15 years, but that's the point. In 15 years people will say "you should have just held ____".
12. This is also why we see tops often form around "good" news and bottoms around "bad" news.
13. After it first gave blowout DC guidance, the stock doubled, and static multiple looked insane.
14. Even then, market cap was ~40% of bubble peak.
15. I'm generalizing.
16. NVDA basically went sideways for two years from July 2024 to last month, despite executing as well as anyone could ask.