Author: Frank, PANews
In the world of cryptocurrency, what can happen in 15 minutes? For most people, it's just the formation of a candlestick; but for participants in Bitcoin short-term prediction markets, it often means "a single round determines life or death."
Recently, the PANews analysis team conducted a full data review of recent Bitcoin 15-minute rise/fall prediction markets. In a massive database covering approximately 3 days, 291 short-term markets, and a total of 1.05 million transactions, we saw more than just cold numbers—we witnessed a raw game of algorithms versus human nature.
This is not a playground where one can get rich by luck, but a folded world dominated by 3.6% algorithmic robots.
Retail Lottery Center: The Bustling Ant Market
If you only look at the macro data, this market appears incredibly lively.
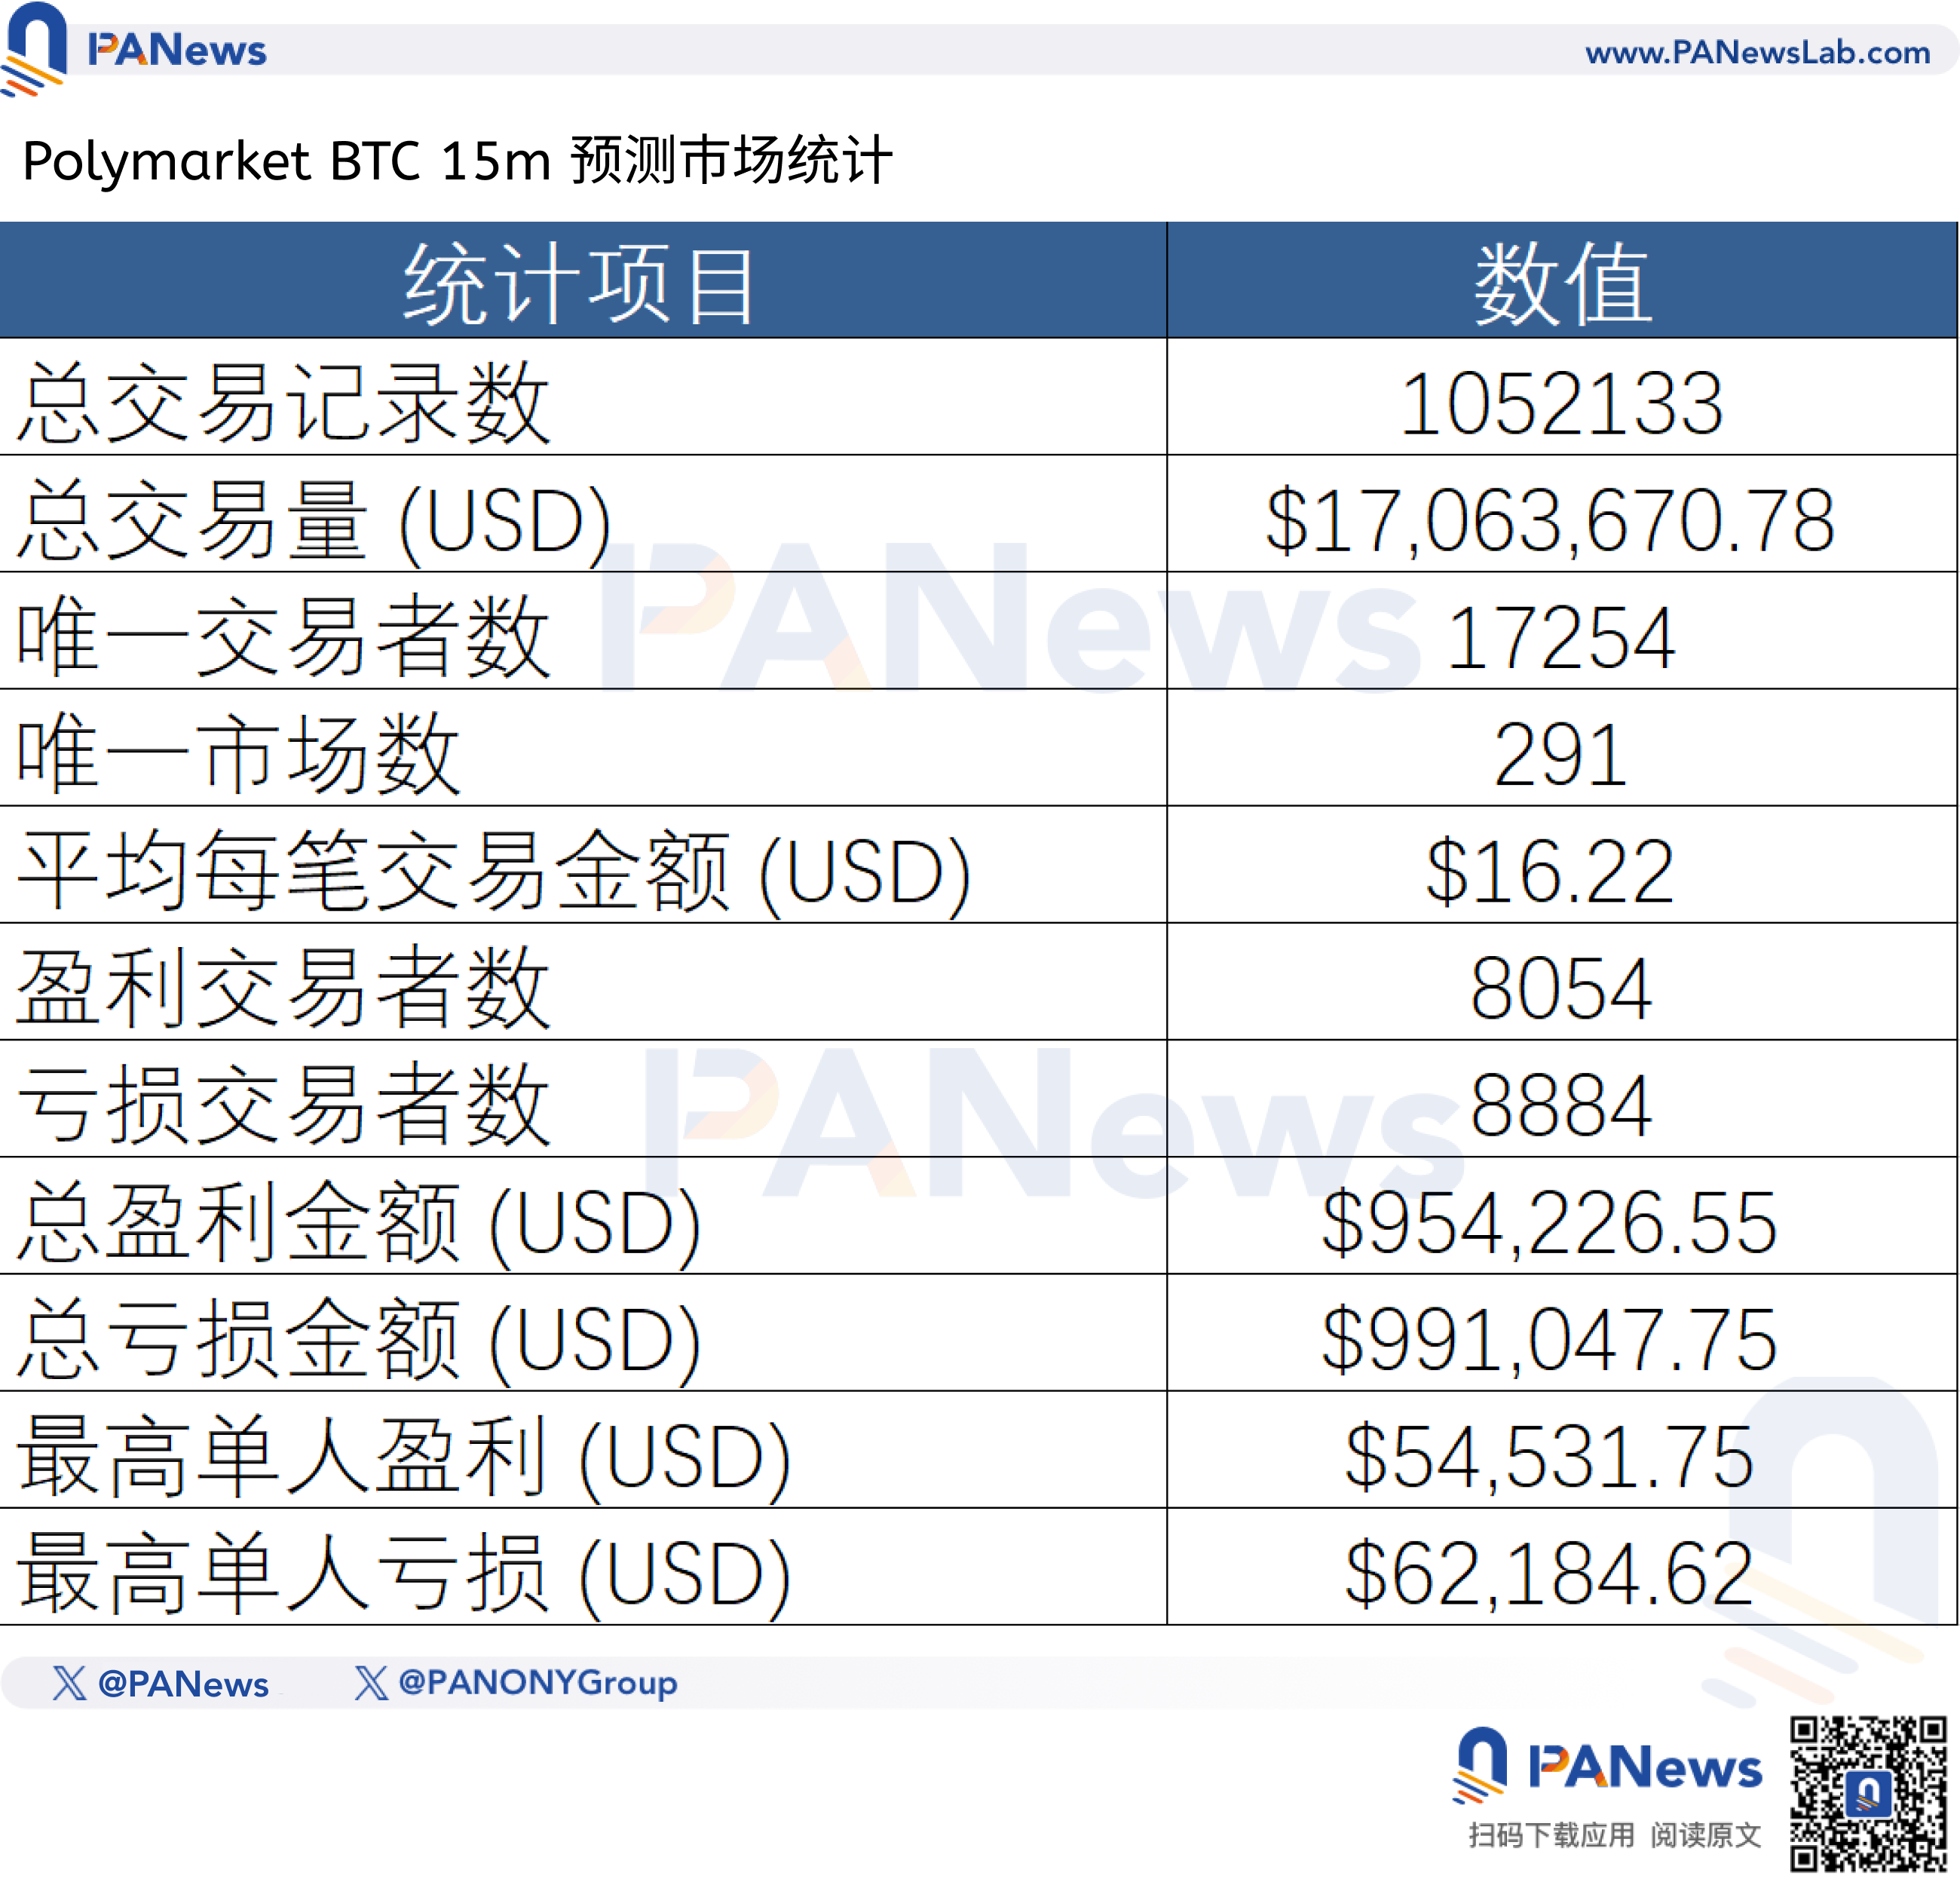
During these 3 days, the BTC 15-minute prediction market generated a total of 1.05 million transactions, with a total trading volume of approximately $17 million. The average trading volume per market was about $58,600. Of course, in terms of trading volume, the scale of the crypto prediction market is still relatively small, far from matching the trading volume of traditional crypto markets.
During this period, a total of 17,254 unique addresses participated in trading in this market. The average number of unique trading addresses per market was 881. The average single transaction amount was $16.22, indicating that the market primarily consists not of institutional battles, but of high-frequency "lottery ticket buying" by thousands of retail investors.
Among them, 8,054 addresses were profitable, while 8,884 unique addresses incurred losses. The ratio of profitable to loss-making participants was close to 1:1.1. The market did not show a "one-sided slaughter"; most losers only suffered minor losses, creating the illusion that "it's still playable," which retained a large number of users.
However, the limitations of market depth were also exposed. Data shows that the highest-profit address earned a total of $54,531, while the address with the largest loss lost $62,184. This data indicates that the liquidity depth of the market limits the upside for large players—it's difficult to make millions of dollars in a single trade here because the counterparty's pockets aren't deep enough.
The median entry point for all addresses was 0.544, indicating that buyers generally entered the market with confidence in "rising" or "falling." However, the median exit point was 0.247. This means the vast majority of active selling was "panic selling," with an average loss of about 50% per trade. It also shows that retail investors often cannot hold onto profitable positions but frequently operate on losing ones, ultimately returning their chips to market makers at low prices.
Robots vs. Real Users: 3.6% of Machines Rule the Market
If散户 are playing psychological games, their opponents are conducting a cold, dimensional strike. The data analysis results mercilessly reveal: in this market, manual traders are facing comprehensive suppression by algorithms.
First, from the results, robot addresses indeed completely outperformed real users in terms of data.
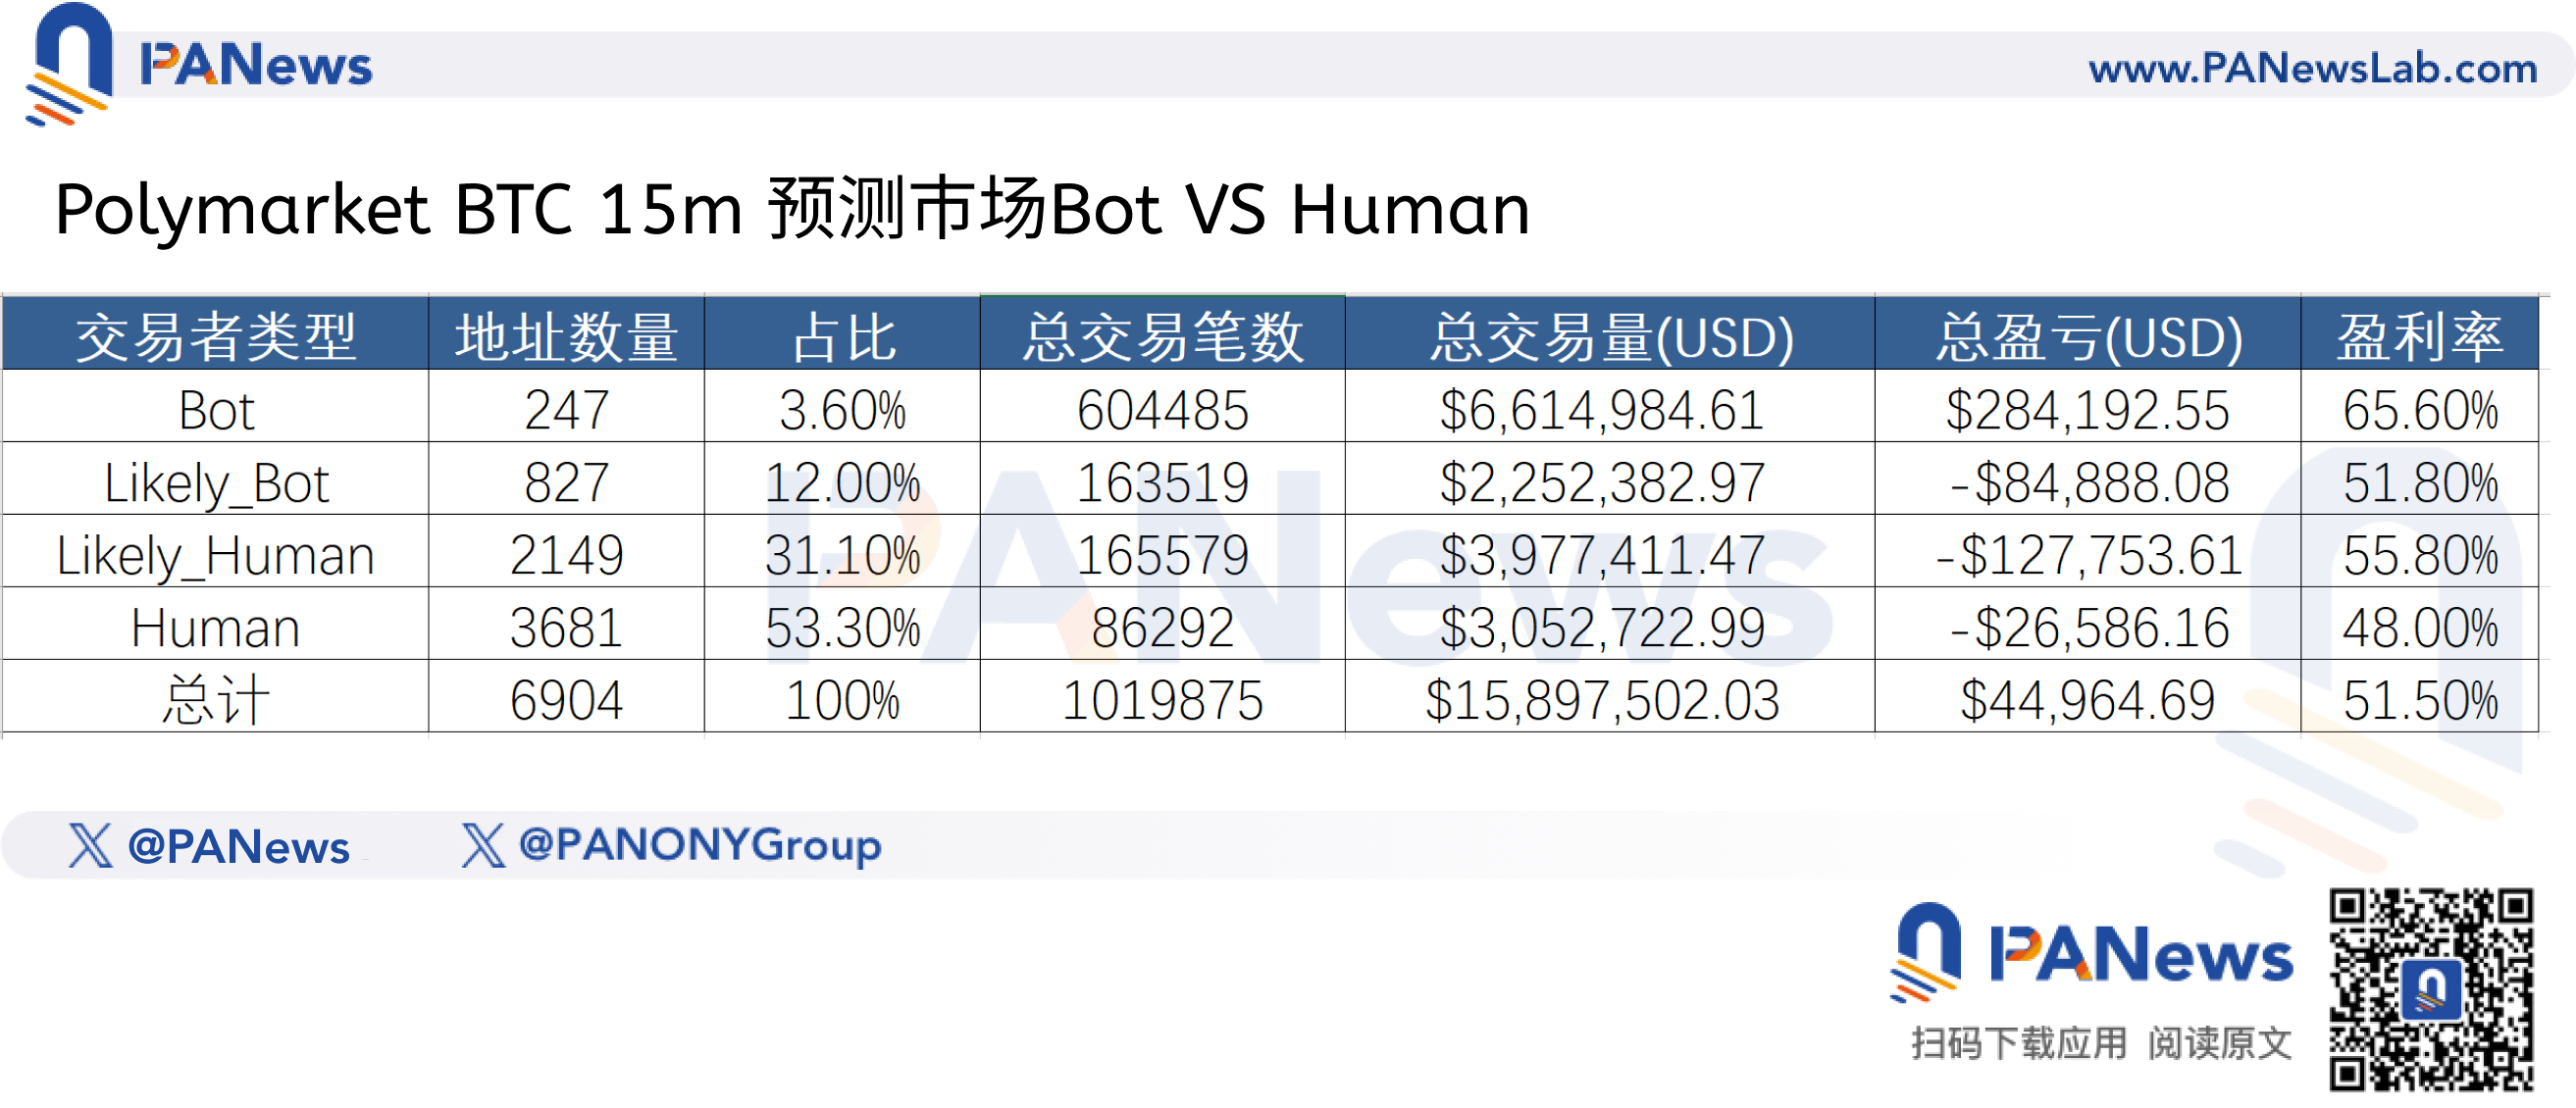
Although these robot addresses are extremely few in number—only 247, accounting for only 3.6%—they contributed over 600,000 transactions, accounting for more than 60% of the total. This shows that a tiny minority of algorithms dominate pricing power and liquidity, while the vast majority of散户 serve as consumables providing funds.
In terms of transaction amount, the ratio between robots and real users is relatively close.
Additionally, robots have a significant advantage in profits. Pure robot addresses had a total profit of approximately $284,000 over these three days, while addresses categorized as robot-like, human-like, and purely human trading all had overall negative returns. Among them, real traders had an overall profit/loss of -$154,000. Every penny of excess profit in the market essentially transferred from the pockets of real users to the accounts of algorithms. Manual trading faces an insurmountable gap when competing against high-frequency algorithms.
In terms of win rate, robot addresses also performed better, with an average win rate of about 65.5%, while real users had a win rate of only 51.5%.
From this perspective, the analysis results show that in crypto short-term prediction markets, a state exists where machines harvest real users, and manual trading results face a huge gap compared to high-frequency robots. From another angle, it also corroborates a result: optimizing algorithms can achieve excess returns in prediction markets.
Decrypting Smart Money: "Fast" is Poison, "Accurate" is the Antidote
However, if you think writing a script and running a robot will guarantee easy money, you are sorely mistaken. Among the list of top earners, we found a counterintuitive phenomenon: intense differentiation also occurs in the world of robots; "high frequency" does not equal "high profit."
Take the address 0x5567...a7b1 as an example. It was the address with the highest number of transactions among all addresses. It conducted over 33,700 transactions in total, averaging over 67 transactions per hour. But its profits were relatively meager, only $4,989, averaging a mere $0.14 per transaction.
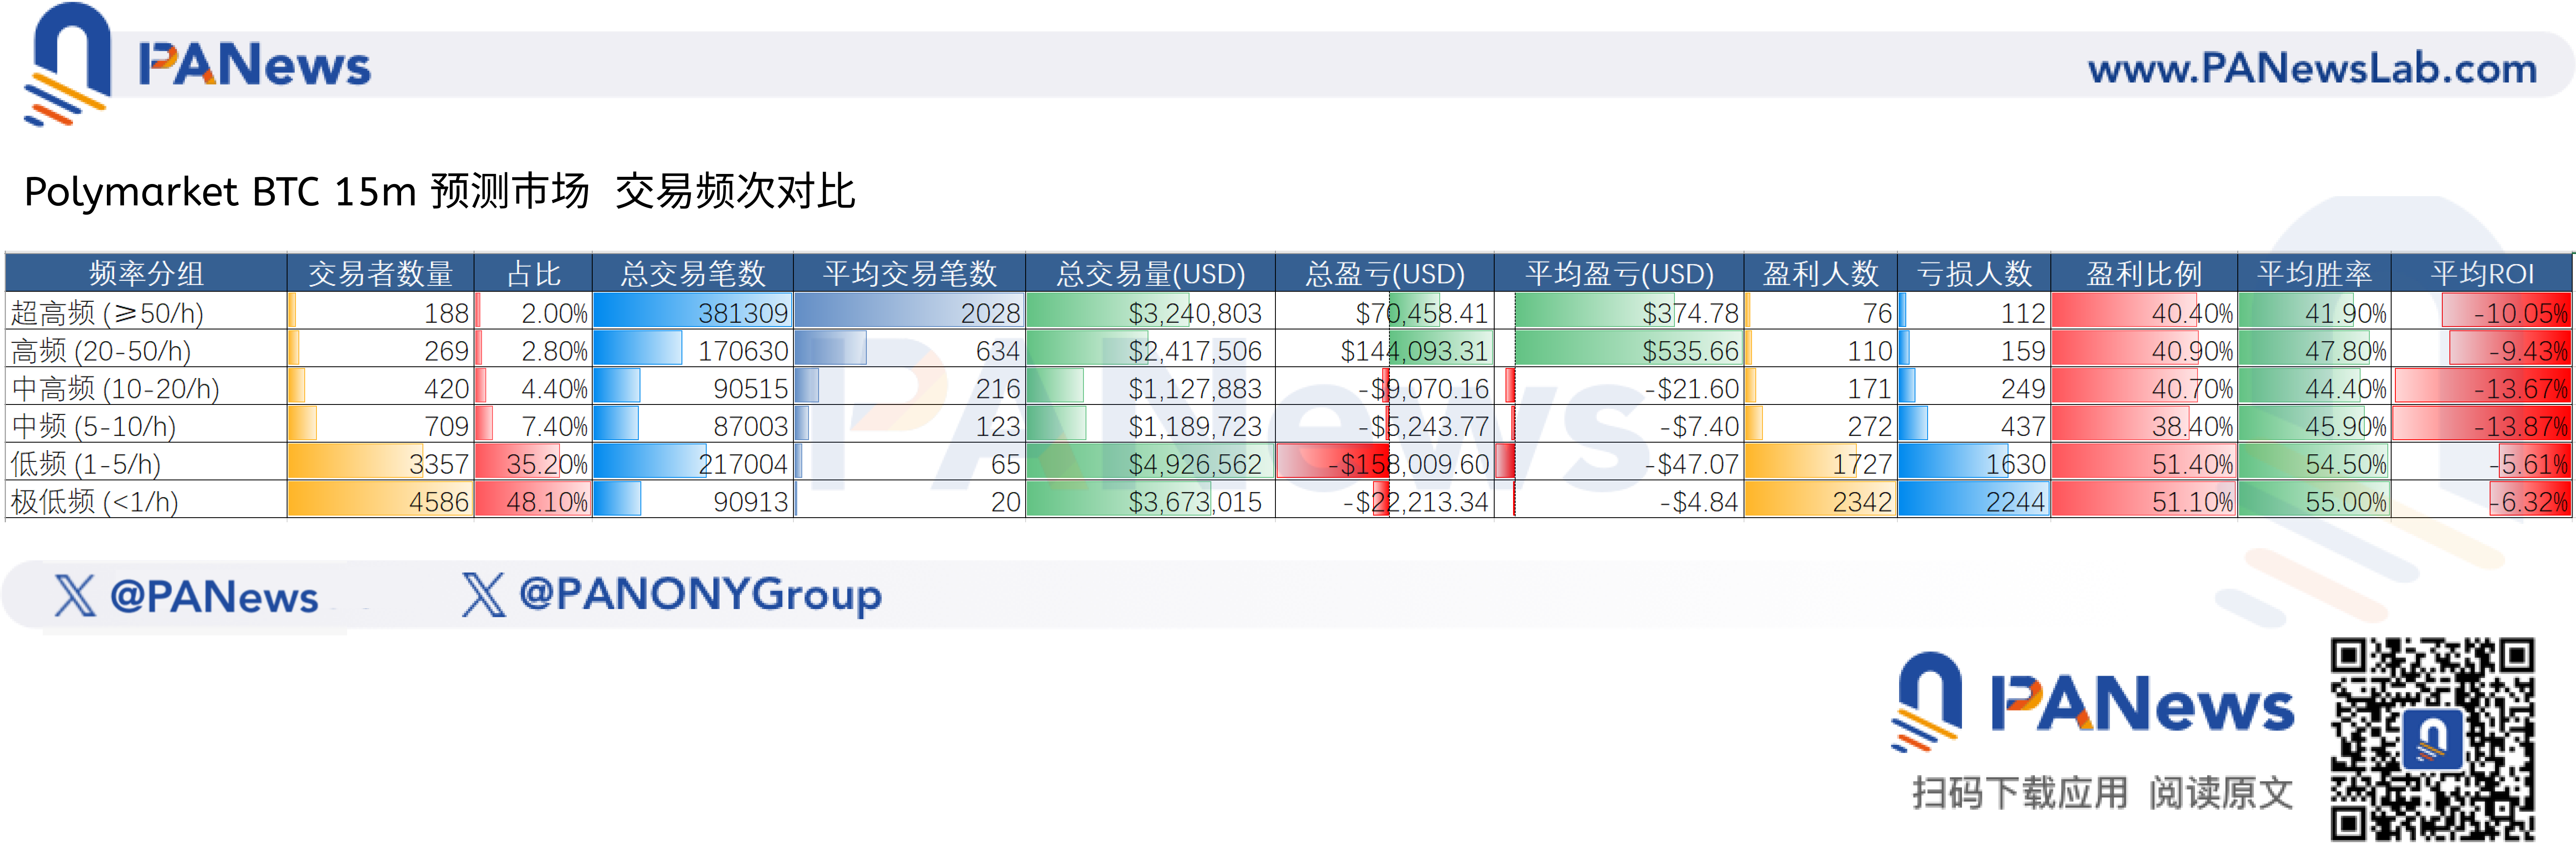
This is not an isolated case. Data shows that among ultra-high-frequency addresses conducting over 50 transactions per hour, only 40% were profitable, and the average return rate for the group was even -10%. Under the pressure of gas fees, slippage, and extremely fierce competition, robots blindly pursuing speed ultimately just work for the miners.
Now consider another case. The address 0x0ea5...17e4 is also a robot address, and its profit ranked first among all addresses. However, its transaction frequency was not that high, averaging only 22 transactions per hour, and it only participated in 61% of the markets. This means this address's trading logic did not involve placing orders every second; instead, it traded based on specific screening conditions, only entering the market when those conditions were met. This address achieved a win rate of 72% and a profit of approximately $54,500.
Risk Control Becomes the Lifeline for Human Traders
Additionally, for human traders, the data also leaves a glimmer of hope.
We found that very low-frequency trading addresses (less than 1 transaction per hour) had an average win rate of 55%, far exceeding those blindly scalping high-frequency robots. This shows that, without top-tier algorithm support, human manual judgment based on market sense and logic can achieve a higher win rate than algorithm-based robots.
But where do humans lose? The data给出的答案是: risk control.
Low-frequency traders (1~5 transactions per hour) had an average loss per trade of about $47, the highest among all address categories. Human traders often correctly predict the direction, but human weaknesses make them hold on stubbornly when wrong and exit too early when right. Ultimately, the "small profits, big losses" profit-loss ratio became the biggest curse for human traders in this market.
1.05 million transaction records, $17 million in flow, reveal a brutal truth:
The Bitcoin 15-minute prediction market is not an ATM for散户; it is a food chain where top-tier algorithms harvest inferior algorithms, and inferior algorithms, in turn, harvest humans.
For ordinary participants, the advice from the data is extremely冷酷: either evolve into a top sniper with a 72% win rate, or become an extremely restrained low-frequency hunter. Beyond that, any frequent operation, any attempt to compensate for technical gaps through "diligence," will ultimately only make you a part of the profit provided to this vast ecosystem.