Audiera ($BEAT) is showing renewed strength following a sharp correction after its June peak above $11.40. The token recently gained momentum, rising 36.79% in the last 24 hours and 40.28% over the past seven days. Currently, $BEAT is trading around $3.65, with a market cap of approximately $1.13 billion.
The recent recovery reflects improving market sentiment as buyers return after weeks of consolidation. Furthermore, technical indicators suggest that $BEAT has regained strength, although traders remain cautious about short-term volatility and key resistance levels ahead.
Technical Forecast for $BEAT Shows Improved Bullish Structure
The daily chart of $BEAT/USDT shows a gradual recovery phase after the previous decline. The token is currently trading above its major exponential moving averages, signaling improved medium-term strength.
The 20-day EMA at $2.91 has risen above the 50-day EMA at $2.65. Moreover, both averages remain above the 100-day EMA at $2.19 and the 200-day EMA at $1.69.
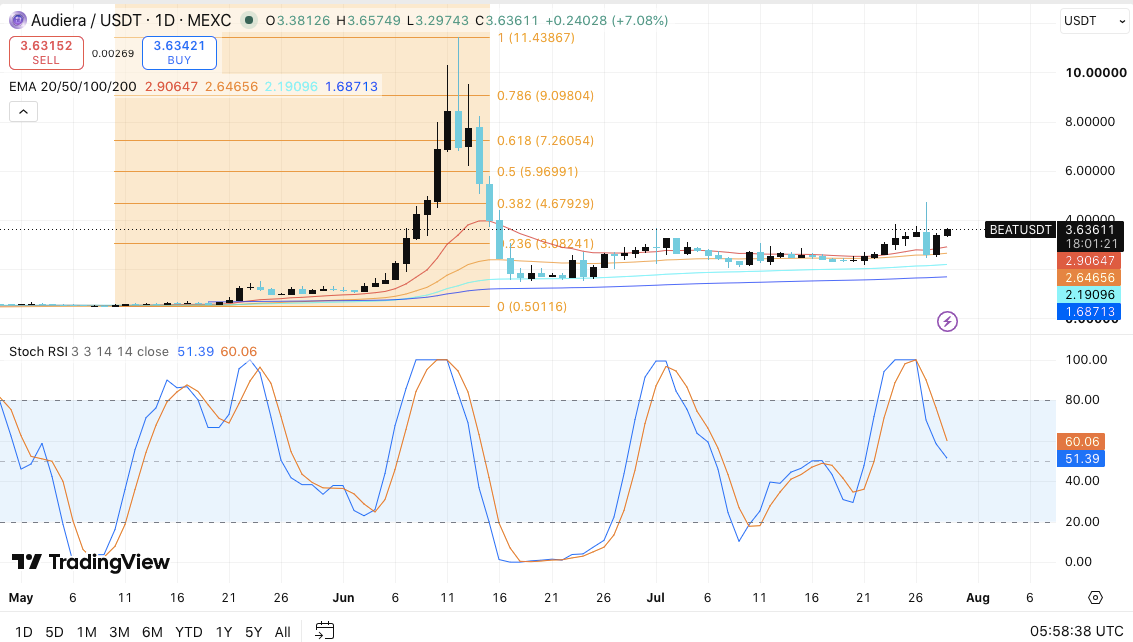
This moving average alignment indicates that buyers have regained control. However, $BEAT still needs sustained buying pressure to confirm a full trend reversal. The first major resistance lies at $4.68, which coincides with the 38.2% Fibonacci retracement level. A breakout above this zone could open the path to $5.97 and $7.26.
Furthermore, the $7.26 level represents a significant test for the bulls, as it could confirm a stronger recovery. If momentum is sustained, $BEAT could eventually challenge the resistance zone between $9.10 and $11.44. This area contains previous highs and could attract increased selling activity.
Support Levels and Market Momentum
The short-term outlook for $BEAT largely depends on whether buyers can defend key support areas. The $3.08 level, associated with the 23.6% Fibonacci retracement, remains the first support zone. Additionally, the 20-day EMA at $2.91 provides another layer of defense for the current bullish setup.
A drop below $2.91 could weaken market confidence and expose the token to further decline. Consequently, traders may view the 50-day EMA at $2.65 as the next crucial defensive level.
The Stochastic RSI has started to decline from overbought territory. This suggests that short-term momentum may weaken following the recent rally. Therefore, $BEAT may undergo consolidation before attempting another upward move.
Derivatives Activity Stabilizes After June Volatility
Audiera's open interest data shows significant shifts in trader positioning over recent months. During the rally in early June, open interest surged above $350 million as leveraged traders increased their exposure. This rise reflected strong speculative interest during $BEAT's explosive price movement.
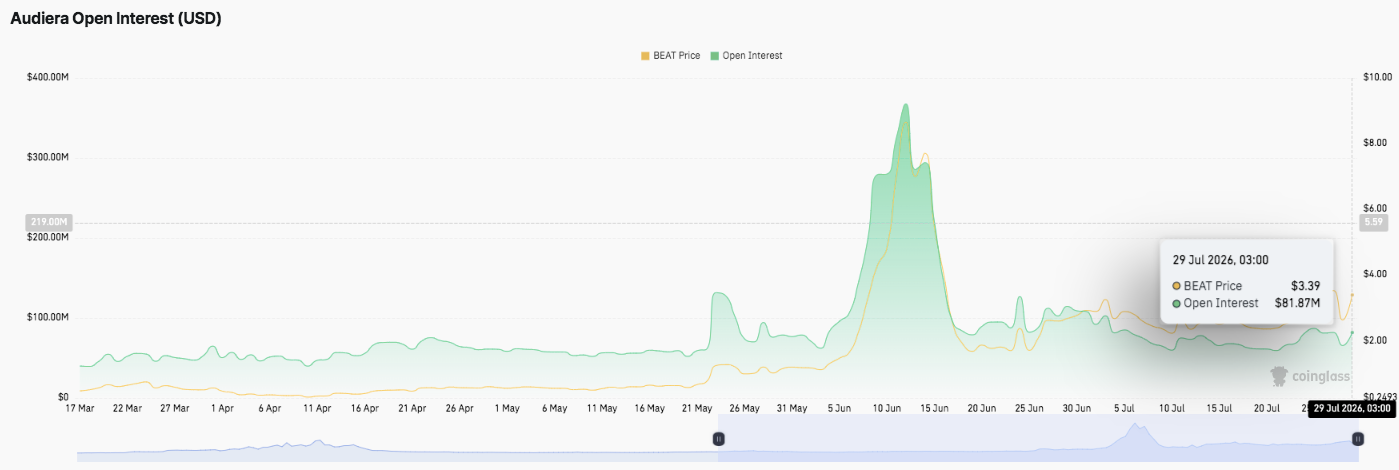
However, open interest sharply declined following the market reversal. The drop indicates widespread position unwinding and reduced leverage among derivative traders. Since mid-June, open interest has stabilized between $60 million and $120 million.
The latest figure is around $81.87 million, while $BEAT trades around $3.39. This points to a more balanced derivatives market without excessive leverage buildup. Importantly, stable open interest could provide a healthier foundation for future price movements.
Spot Flows Indicate Renewed Investor Interest
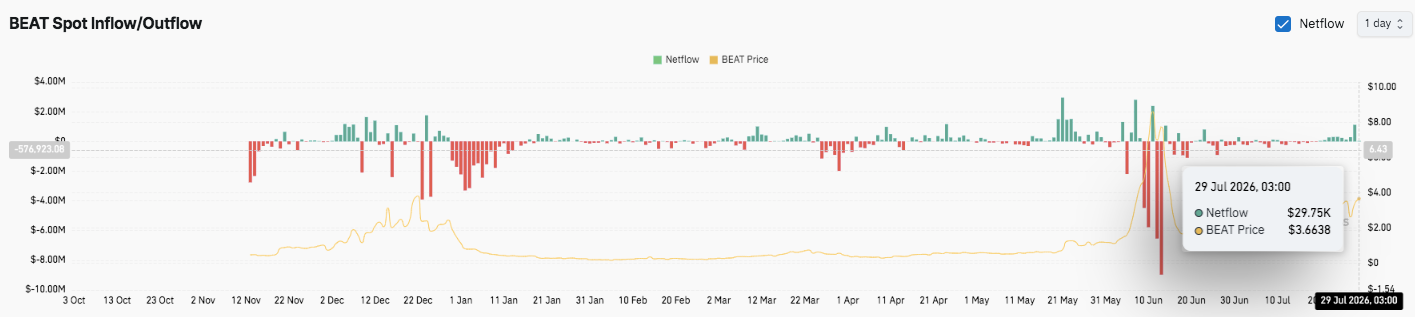
$BEAT's spot inflow and outflow data reveal mixed but improving investor activity. Previous periods recorded significant outflows, indicating profit-taking after the strong rally. Additionally, several large spikes in inflows and outflows occurred during volatile trading sessions in June.
Recently, market activity has become more balanced, with net flows turning slightly positive. The latest data shows an inflow of approximately $29.75 thousand, suggesting renewed accumulation among investors.
Audiera Price Technical Overview
Key levels remain clearly defined for Audiera ($BEAT) as the token attempts to extend its recovery following the June correction.
Upside Levels: $4.68 remains the immediate resistance zone, followed by $5.97 and $7.26, which align with key Fibonacci retracement levels. A decisive breakout above $7.26 could reinforce bullish momentum and open the path to $9.10 and the previous high zone around $11.44.
Downside Levels: $3.08 represents the first major support zone, followed by the 20-day EMA at $2.91 and the 50-day EMA at $2.65. A deeper correction could reveal a broader support area between the 100-day EMA at $2.19 and the 200-day EMA at $1.69.
Resistance Ceiling: The $4.68 level remains a critical barrier for the bulls. A successful daily close above this zone would confirm intensifying buy-side pressure and increase the likelihood of a sustained recovery. However, failure to overcome this resistance could lead to consolidation around current support levels.
Will the Audiera Price Rise?
Audiera's near-term direction hinges on whether buyers can maintain support above the $2.91-$3.08 area while building momentum towards the $4.68 resistance. The recent recovery, improved EMA structure, and balanced derivatives activity point to a gradual improvement in market sentiment. Additionally, modestly positive spot flows suggest renewed investor interest after the June sell-off.
If bullish momentum strengthens and trading volume increases, $BEAT could challenge $5.97 and $7.26 before targeting higher resistance near $9.10. However, losing the $2.91 support would weaken the recovery and increase the risk of a pullback to $2.65 or lower. For now, $BEAT remains in a crucial recovery phase, and technical confirmation coupled with sustained buyer participation will likely determine the next major move.
end-content