CoinW Research
On July 11th, NOXA, an early top-tier meme launch platform on Robinhood Chain, suspended new token issuance. Two days later, the original website became temporarily inaccessible; the static entry activated on July 14th only retained functions for browsing historical projects, trading existing tokens, and collecting creator fees. On July 15th, NOXA further announced it would no longer collect subsequent trading fees and would redirect all trading revenue to creators. As of this writing, its new issuance has not resumed.
The speed of NOXA's exit nearly matched its rise. After the Robinhood Chain mainnet launch, the platform quickly aggregated creators, traders, and fee revenue via CASHCAT. Attention and promotion from the official Robinhood team further reduced the cold-start cost for early native projects. NOXA cumulatively created over 60,000 tokens, with total fees approaching $12 million; however, after new issuance halted, project supply quickly shifted to entry points like Pons.family and Flap.
CoinW Research believes the launch platform landscape on Robinhood Chain has entered a stage of high supply but low conversion. Dune data shows that on July 16th, the entire chain saw 42,709 new tokens, with Pons.family and Flap accounting for 50.30% combined; as of this writing, only 18 tokens have a market capitalization exceeding $1 million, primarily originating from NOXA and Virtuals. The issuance entry points have shifted to Pons and Flap, while high-market-cap projects are still concentrated on platforms that generated wealth effects in the previous phase. Following NOXA's exit, no new absolute leader has emerged. Future rankings will primarily depend on factors like effective graduation rates, million-dollar token production, and market cap retention.
1. NOXA's First-Mover Advantage Did Not Form a Stable Barrier
NOXA's transition from leader to suspension spanned a very short market cycle. The platform's rise depended on being the first entry point, representative projects, amplification by Robinhood's official support, and buyer attention; when new projects stopped entering, this growth loop also halted.
1.1 How CASHCAT Helped NOXA Establish Its Initial Advantage
Robinhood Chain opened its public mainnet on July 1st. The network utilizes the Arbitrum Platform, supports low-latency confirmation of about 100 milliseconds, and is compatible with EVM development tools. Uniswap v2, v3, v4, and UniswapX were integrated at mainnet launch, allowing developers to directly deploy token contracts, establish public liquidity, and quickly enter trading paths via wallets and aggregators.
NOXA connected token creation directly with Uniswap v3 single-sided liquidity. New projects entered public pricing from the first trade, creators could earn pool trading fees, and manual pool creation and subsequent migration steps were reduced. Before other launch platforms had formed stable products, this process was the first to meet the new token issuance demand on Robinhood Chain.
NOXA's initial advantage wasn't solely due to its product mechanism. CASHCAT connected Robinhood's early brand narrative, on-chain community, and short-term trading demand. Attention and promotion from the official Robinhood team further amplified project exposure, community trust, and inclusion in trading tools. Subsequent price and trading volume growth then funneled attention back to NOXA: creators wanted access to existing buyers and leaderboard traffic, and traders gradually viewed NOXA as a key entry point for discovering new tokens on Robinhood Chain. Representative projects, official support, and platform traffic thus formed a mutually reinforcing cold-start loop.
1.2 Suspension Cuts Off New Project Supply, But Existing Assets Remain Operational
NOXA attributed the suspension of new issuance to bot replication and the proliferation of low-quality tokens. After the original domain went offline, the team migrated the historical interface to an ENS entry point. Existing projects can still be browsed and traded, and creator fees can still be collected. The fee adjustment on July 15th further confirmed the platform's contraction direction: NOXA stopped collecting subsequent trading fees and redirected all revenue to creators, effectively preserving historical contracts and trading channels while abandoning ongoing monetization on the platform side. For existing projects, tokens and liquidity pools remain operational; for NOXA, the growth loop consisting of new projects, platform revenue, and leaderboard updates has been interrupted.
This illustrates that a launch platform's traffic loop relies on continuous supply. The platform must not only continuously introduce projects but also maintain leaderboards, integrate trading tools, and consistently output content to the market. Once new projects stop entering, creators lose their channel to the original buyer network, and traders shift to platforms that are still updating.
1.3 NOXA Exposed Three Shortcomings of Early Launch Platforms
First, representative projects can rapidly amplify platform traffic but also increase the platform's dependence on a single asset's performance. CASHCAT helped NOXA establish market recognition, but when the representative project declined, the platform suspended issuance, and market sentiment weakened simultaneously, trading volume and user attention also declined in sync.
Second, continuous operation itself has become a core competitive capability. If a platform halts its core business during the most active market phase, creator expectations regarding fee collection, contract maintenance, and product continuity will be affected. Platforms with leadership potential need to demonstrate they can filter low-quality projects during supply peaks while maintaining contracts, front-end, and project services.
Third, official support is a key variable for cold starts but cannot replace a platform's independent growth. NOXA's early explosion showed that attention, brand synergy, and channel promotion from the official Robinhood team can significantly improve the exposure efficiency of native projects. Subsequent platforms, besides refining issuance and liquidity products, need to strive for content distribution, activity coordination, and infrastructure integration; more importantly, they must translate temporary support into sustained project supply, genuine buyers, and repeatable market distribution capabilities.
2. Over 42,709 New Tokens in a Single Day, Only 18 with Market Cap Over $1 Million
2.1 Over 40,000 in One Day, Where Are the Million-Dollar Tokens Concentrated?
Dune data shows that on July 16th, Robinhood Chain saw 42,709 new tokens. Among these, Pons.family created 11,547, accounting for 27.04%; Flap created 9,935, accounting for 23.26%; together they created 21,482 tokens, accounting for 50.30%. The remaining platforms collectively created 21,227 tokens, accounting for 49.70%. Pons and Flap remain the two primary issuance entry points, together accounting for slightly over half of the chain's total. However, as of the time of this report update, only 18 tokens across the entire chain have a market capitalization exceeding $1 million.
Table 1: Token Issuance Scale and Million-Dollar Token Output of Major Launch Platforms on Robinhood Chain
| Platform / Scope |
Issuance Volume |
Tokens with Market Cap >$1M |
Issuance Share |
Market Cap Outcome & Assessment |
| Pons.family |
11,547 tokens |
1 |
27.04% |
Only $PONS made the list; market cap output concentrated on a single project. |
| Flap |
9,935 tokens |
0 |
23.26% |
Second in issuance volume, but no projects in the million-dollar list. |
| NOXA |
New additions stopped |
10 |
— |
55.56% of chain total; highest number of million-dollar tokens. |
| Virtuals |
Dashboard does not list daily volume separately |
5 |
— |
27.78% of chain total; second-highest number of million-dollar tokens. |
| Bullmarkets |
Dashboard does not list daily volume separately |
1 |
— |
5.56% of chain total |
| Bowfun |
Dashboard does not list daily volume separately |
1 |
— |
5.56% of chain total |
| Entire Chain |
42,709 tokens |
18 |
100% |
Million-dollar tokens remain highly concentrated in a few platforms. |
Table 1 shows that issuance share and market cap results have formed two separate rankings. Pons and Flap together contributed 50.30% of new tokens on July 16th, but the latest million-dollar list is still dominated by projects from NOXA and Virtuals; Pons currently mainly relies on its platform's namesake token for its high-market-cap sample, while Flap has 0 projects with a market cap over $1 million. The issuance entry points are shifting to Pons and Flap, but tokens with market caps over $1 million are still primarily concentrated on platforms like NOXA and Virtuals.
2.2 Pons Leads in Issuance Volume, But Bot Activity Exists
Pons's public page shows approximately 21,454 tokens still in the bonding curve stage, 110 graduated tokens, and a cumulative creation of about 21,564 tokens. Based on this, the raw graduation rate for Pons is estimated at about 0.51%. However, among the 110 graduated tokens, only $PONS made it to the current million-dollar list, representing about 0.91% of graduated projects and 0.0046% of all created projects.
Simultaneously, on-chain data confirms suspected bot activity within the Pons ecosystem. Here, "bot activity" primarily refers to automated accounts repeatedly executing operations like creating tokens, buying tokens, authorizing trading routers, selling tokens, and collecting referral fees, causing the token creation count and on-chain transaction volume in platform statistics to increase rapidly within a short time.
Here are two verifiable addresses:
Address one: 0x7DE5b9C86D2B47607A2962043bB165f7BEFeB06b
Address two: 0x7D22d3Dd32F00848A54eBE00c00a9082A18D4E66
Taking a larger-scale operation on July 17, 2026, as an example, VLAD (contract address: 0x91e2ce85c223CD55b0Cf76Ca668a0e61ed696C6b) was created by the Pons launch contract. At 00:23:51, 00:24:58, and 00:26:06, the two addresses above consecutively bought VLAD three times in the same second, with identical amounts of 0.033333333 ETH each. Each address cumulatively invested about 0.1 ETH, with the two addresses together investing about 0.2 ETH.
At 00:31:09, the two addresses sold all their VLAD in the same second after authorizing the transaction. Address one sold about 5,694,114.656 VLAD, receiving 0.101688749 WETH from the pool, and actually received 0.100671862 ETH after router fees. Address two sold about 5,707,289.584 VLAD, receiving 0.106254208 WETH from the pool, and actually received 0.105191665 ETH.
Additionally, on July 17th, address one and address two successfully called the Pons launch contract 896 times and 886 times respectively, creating 1,782 tokens in total, with each creation transaction investing a fixed 0.0015 ETH.
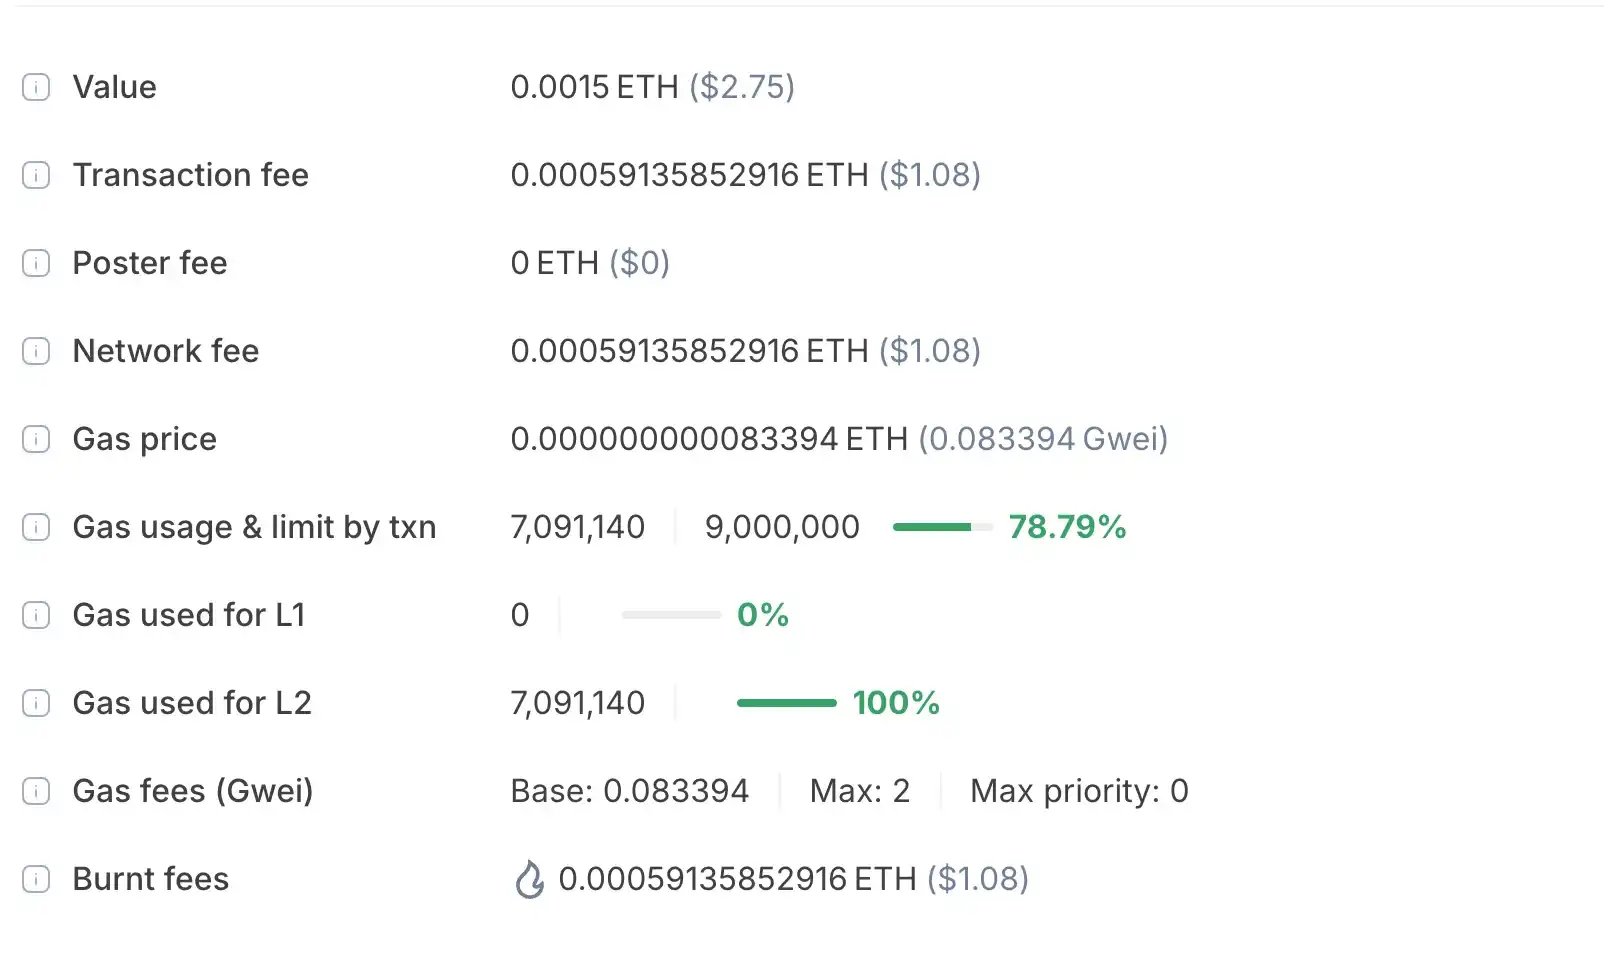
The large volume of standardized creation records, coupled with two addresses buying three times consecutively in the same second with identical amounts and liquidating in the same second, does not align with the characteristics of independent manual user operations. It can be concluded that these operations were executed in batches by bots or automated scripts. Such activity inflates Pons's issuance volume and transaction count while incorporating many tokens lacking follow-up operations into the graduation rate. Therefore, it can be judged that there is relatively obvious bot activity within Pons's issuance data.
2.3 Flap's Graduation Rate and Market Cap Conversion Still Need Verification
Flap once set a record with approximately 22,000 tokens issued in a single day on July 14th. On July 16th, its creation volume dropped to 9,935 tokens, accounting for 23.26% of the chain's daily issuance, making it the second-largest launch platform after Pons.
Dune statistics show that only 18 tokens on Robinhood Chain have a market cap exceeding $1 million, with the majority of slots still occupied by platforms like NOXA and Virtuals. Although Flap rapidly expanded its issuance scale, it has 0 million-dollar projects. This indicates its current advantage is primarily concentrated in the creation entry point and project distribution. Whether it can translate this issuance scale into high-market-cap projects requires observing the market cap, liquidity, and organic trading retention of graduated tokens.
2.4 Overall Assessment: Sustained Market Cap Output Determines Platform Ranking
Pons's strengths are its issuance scale, platform namesake representative token, and strong intra-chain attention. Its weaknesses are a raw graduation rate of only about 0.51%, bot activity in creation data, and million-dollar market cap output primarily concentrated on $PONS. Flap's strengths are protocol reusability, external distribution, and rapid expansion of project supply. Its weakness is having 0 million-dollar projects. In comparison, NOXA and Virtuals currently do not hold an advantage in new issuance, yet their projects occupy many slots on the million-dollar market cap list, indicating that representative projects, genuine buyers, and sustained post-graduation operations are more decisive for long-term attention than creation volume alone.
Therefore, when evaluating launch platforms going forward, priority should be given to observing the number of million-dollar tokens and their daily retention rate, followed by observing the median market cap, liquidity, and independent buyer count of graduated projects, then observing the effective graduation rate after removing bot-created batches, and finally the raw issuance volume. According to this framework, Robinhood Chain has not yet formed a new leader capable of fully replacing NOXA. Pons and Flap lead in new issuance entry points, but neither has produced many high-market-cap projects.
3. The Liquidity Downstream for Launch Platforms: Why Uniswap Benefits
3.1 Launch Platforms Compete for Creation Entry, Uniswap Hosts Public Liquidity
Launch platforms like Pons and Flap mainly compete around creation cost, curve parameters, creator revenue share, project discovery, and external distribution. However, once tokens meet graduation conditions, liquidity typically migrates to Uniswap or other public trading pools. Klik directly establishes Uniswap v4 pools, Bankr organizes v4 liquidity via Doppler, while Flap, Pons, and hood.fun migrate liquidity to Uniswap or other DEXs after projects meet set conditions. Launch platforms handle token creation and early user acquisition; Uniswap handles post-graduation public pricing, trade execution, and liquidity hosting.
NOXA's suspension further illustrates this division of labor. After NOXA stopped new token issuance, historical projects can still circulate via Uniswap and other trading interfaces. The launch platform front-end can stop updating, but the established public liquidity pools remain callable by wallets, trading bots, and aggregators, allowing tokens to continue trading independent of the original launch entry point.
This division gives Uniswap a growth path relatively independent of individual platform rankings. Market share among launch platforms may change rapidly, but as long as new projects continue using Uniswap v3 or v4 to establish public liquidity, Uniswap gains more tradable assets, in-pool volume, and liquidity provider fees. The more fragmented the issuance entry points, the greater the market's need for a liquidity layer callable by multiple platforms, wallets, and aggregators—this is Uniswap's main advantage on Robinhood Chain.
3.2 CCA Extends Uniswap Further into the Token Issuance Phase
Launch platforms typically direct liquidity to Uniswap upon token creation or graduation, while Continuous Clearning Auctions (CCA) extend Uniswap further into the initial issuance phase. Issuers can set sale quantity, auction duration, settlement asset, and fund use. Participants submit budgets and maximum willingness-to-pay prices, with orders gradually participating in clearing over the remaining blocks. After the auction ends, the system can automatically establish a Uniswap v4 pool at the market-clearing price, connecting token distribution, initial pricing, and secondary trading.
CCA and one-click launch platforms serve different project types. One-click platforms emphasize low barrier to entry, rapid creation, and community propagation, better suited for high-frequency, narrative-driven meme coins. CCA is more suitable for projects seeking to publicly sell a fixed token amount, reduce front-running impact, and form an initial price through open bidding. Robinhood Chain thus forms two issuance paths: one-click launch platforms handle high-frequency community creation, while CCA handles relatively standardized public auctions. Both types of projects can ultimately enter Uniswap's public liquidity system.
TRASH is an early hot project on Robinhood Chain issued via CCA. As of now, its fully diluted valuation is approximately $759,000, with about 2,350 holder addresses, 24-hour trading volume around $7.1 million, and daily trading volume about 9.4 times its fully diluted valuation. This data indicates that CCA can concentrate orders and generate high volume in a short time, but high turnover also means early prices are susceptible to short-term capital influence.
Thus, Uniswap's benefit path on Robinhood Chain can be divided into two: launch platforms direct graduated projects and public liquidity to Uniswap, while CCA integrates the initial distribution, price discovery, and initial pool establishment of some projects directly into the Uniswap system. Both paths increase asset count, trading volume, and fee generation, but whether these fees translate into protocol revenue and UNI value depends on whether protocol fees are enabled and how fees are ultimately distributed.
3.3 Comparison with Hyperliquid: Similar Trading Fees, Different Value Capture
Uniswap and Hyperliquid have different product structures. Uniswap is centered on multi-chain spot automated market making and permissionless liquidity, while Hyperliquid primarily uses an order book matching system, covering perpetual contracts and spot trading. A direct comparison of market share or product superiority is not suitable, but their trading fees over the past 30 days are relatively close, allowing observation of how fees are distributed among liquidity providers, market makers, protocols, and tokens under different trading structures.
Table 2: Uniswap vs. Hyperliquid 30-Day Fees, Revenue, and Value Capture Comparison
| Metric |
Uniswap |
Hyperliquid |
Comparison |
| Trading Fees |
$61.435M |
$62.193M |
Difference ~1.2% |
| Protocol Revenue |
$3.946M |
$44.306M |
Hyperliquid ~11.2x Uniswap |
| Protocol Rev. / Trading Fees |
~6.4% |
~71.2% |
Significant difference in fee retention structure. |
| Liquidity / Market Maker Compensation |
Liquidity providers receive most trading fees, bearing capital lock-up and impermanent loss. |
Market makers profit from spreads, hedging, and maker rebates; HLP has separate allocation. |
Different potential for protocol fee retention. |
| Token Value |
Protocol fees enter TokenJar contract, converted by searchers to form UNI burn. |
Fees allocated to HLP, Aid Fund, and deployers; Aid Fund buys and burns HYPE. |
Hyperliquid's path more direct; Uniswap depends on governance execution & liquidity retention. |
Over the past 30 days, Uniswap generated approximately $61.435 million in trading fees, while Hyperliquid generated about $62.193 million—a difference of only ~1.2%. During the same period, Uniswap's protocol revenue was about $3.946 million, compared to Hyperliquid's ~$44.306 million, the latter being about 11.2 times the former. Their protocol revenue as a percentage of trading fees is approximately 6.4% and 71.2%, respectively. The fees paid by traders are similar in scale, but the proportion entering the protocol-controlled path differs significantly.
This difference stems first from liquidity compensation. Uniswap's automated market maker structure requires liquidity providers to continuously commit capital and bear price volatility, position inefficiency, and impermanent loss. Therefore, most trading fees must be allocated to liquidity providers. Taking the Uniswap v2 protocol fee rate as an example after activation, traders pay a 0.30% fee, of which 0.25% goes to liquidity providers and 0.05% to the protocol—the protocol receives one-sixth of the total fee.
Hyperliquid uses an order book structure. Professional market makers can profit from bid-ask spreads, inventory management, cross-market hedging, and maker rebates, relying relatively less on trading fee compensation. This allows more fees to enter allocation paths like HLP, the Aid Fund, and deployers, with the Aid Fund using relevant funds to buy and burn HYPE.
Therefore, the difference in the protocol revenue-to-trading-fee ratio primarily reflects the distinct allocation of fees under the two trading and market-making structures. Hyperliquid can direct a higher proportion of fees into the protocol and HYPE value path; Uniswap must prioritize ensuring liquidity provider returns to maintain open liquidity and trading depth. Uniswap can expand network value through asset and volume growth, but whether UNI receives corresponding value return still needs observation.
3.4 UNI Value Capture Still Awaits Protocol Fee Implementation
Robinhood Chain has already brought significant trading growth to Uniswap. According to DeFiLlama data, the chain contributed approximately $23 million in trading fees to Uniswap over the past 30 days, making it the single network contributing the highest fees to Uniswap, yet the corresponding protocol revenue remains $0. At this stage, this growth primarily manifests as new assets, trading volume, liquidity provider fees, and expansion of the public liquidity network. UNI holders have not yet received direct value return from this growth.
The direct cause of this discrepancy is that protocol fees are not yet enabled on Robinhood Chain. The Uniswap community has proposed extending the protocol fee mechanism to its v2, v3, and v4 deployments on this chain. The relevant governance proposal concluded on July 15th, receiving about 12.953 million votes in favor, with 0 votes against and 0 abstentions. However, proposal passage only represents preliminary community consensus; formal on-chain voting and cross-chain execution are not yet complete.
According to the proposal, protocol fees for v2 and v3 on Robinhood Chain will be activated via independent on-chain proposals, while v4 will be included in the first batch of multi-chain activation proposals. After formal proposal passage, governance messages need to be sent from the Ethereum mainnet to Robinhood Chain and executed before protocol fees begin accruing on the chain. This path can convert a portion of trading fees generated on Robinhood Chain into UNI token value, but the final effect is still subject to two factors: first, whether existing liquidity and aggregator integration can be maintained after protocol fee activation; second, whether high-market-cap projects can continue generating genuine volume. Protocol fees reduce the fees received by liquidity providers; if the rate setting affects pool depth, protocol revenue growth may also be limited.
In summary, market cap conversion for launch platforms on Robinhood Chain remains low, but the few successful projects concentrate volume and public liquidity into Uniswap, making it a structural beneficiary of the launch market expansion. Current benefits primarily reside at the level of asset count, trading scale, liquidity provider income, and the public liquidity network. Only after protocol fees complete formal governance and cross-chain execution, and trading volume and liquidity remain stable, will this growth further translate into protocol revenue and UNI token value.
Conclusion
Robinhood Chain has entered a phase of high-frequency token issuance. On July 16th, the entire chain saw 42,709 new tokens in a single day, with Pons and Flap together creating 21,482, accounting for 50.30%. Dune data shows only 18 tokens with a market cap exceeding $1 million. This indicates that the token issuance rate far outpaces the growth rate of genuine capital and user demand. The bottleneck for platform competition is shifting from creation tools to post-graduation market cap and liquidity retention.
At this stage, raw issuance volume only reflects a platform's capacity to host token creation and cannot alone indicate project quality. Bot-driven batch creation inflates issuance volume and broadens graduation rates, and the graduation thresholds set by platforms only prove projects have obtained initial funding and liquidity. More comparative metrics are the effective graduation rate after removing identified automated addresses, the number of million-dollar tokens and their daily retention rate, and the median market cap, liquidity, and natural buyer count of graduated projects. Only when projects continue attracting independent buyers after crossing the graduation threshold can a platform form stable wealth effects and user retention.
From the current landscape, Pons leads in issuance volume, but its raw graduation rate is approximately 0.51%, and on-chain samples show bot-driven batch creation and synchronized trading, meaning part of its issuance volume and transaction count may deviate from real user demand. Currently, the primary project from Pons in the million-dollar list remains its platform namesake token, showing clear concentration of market cap output on a single project. Flap is more complete in external distribution and protocol reusability but has 0 million-dollar projects. Meanwhile, NOXA and Virtuals still occupy most positions on the high-market-cap project list, indicating that the user base and wealth effects formed by historical representative projects have not yet been replaced by new issuance scale. Therefore, after NOXA's exit, Robinhood Chain still lacks a new leader that simultaneously leads. Future attention should focus on metrics like effective graduation rates, token market cap, and retention rates.