Original | Odaily Planet Daily (@OdailyChina)
Author | Wenser (@wenser 2010)

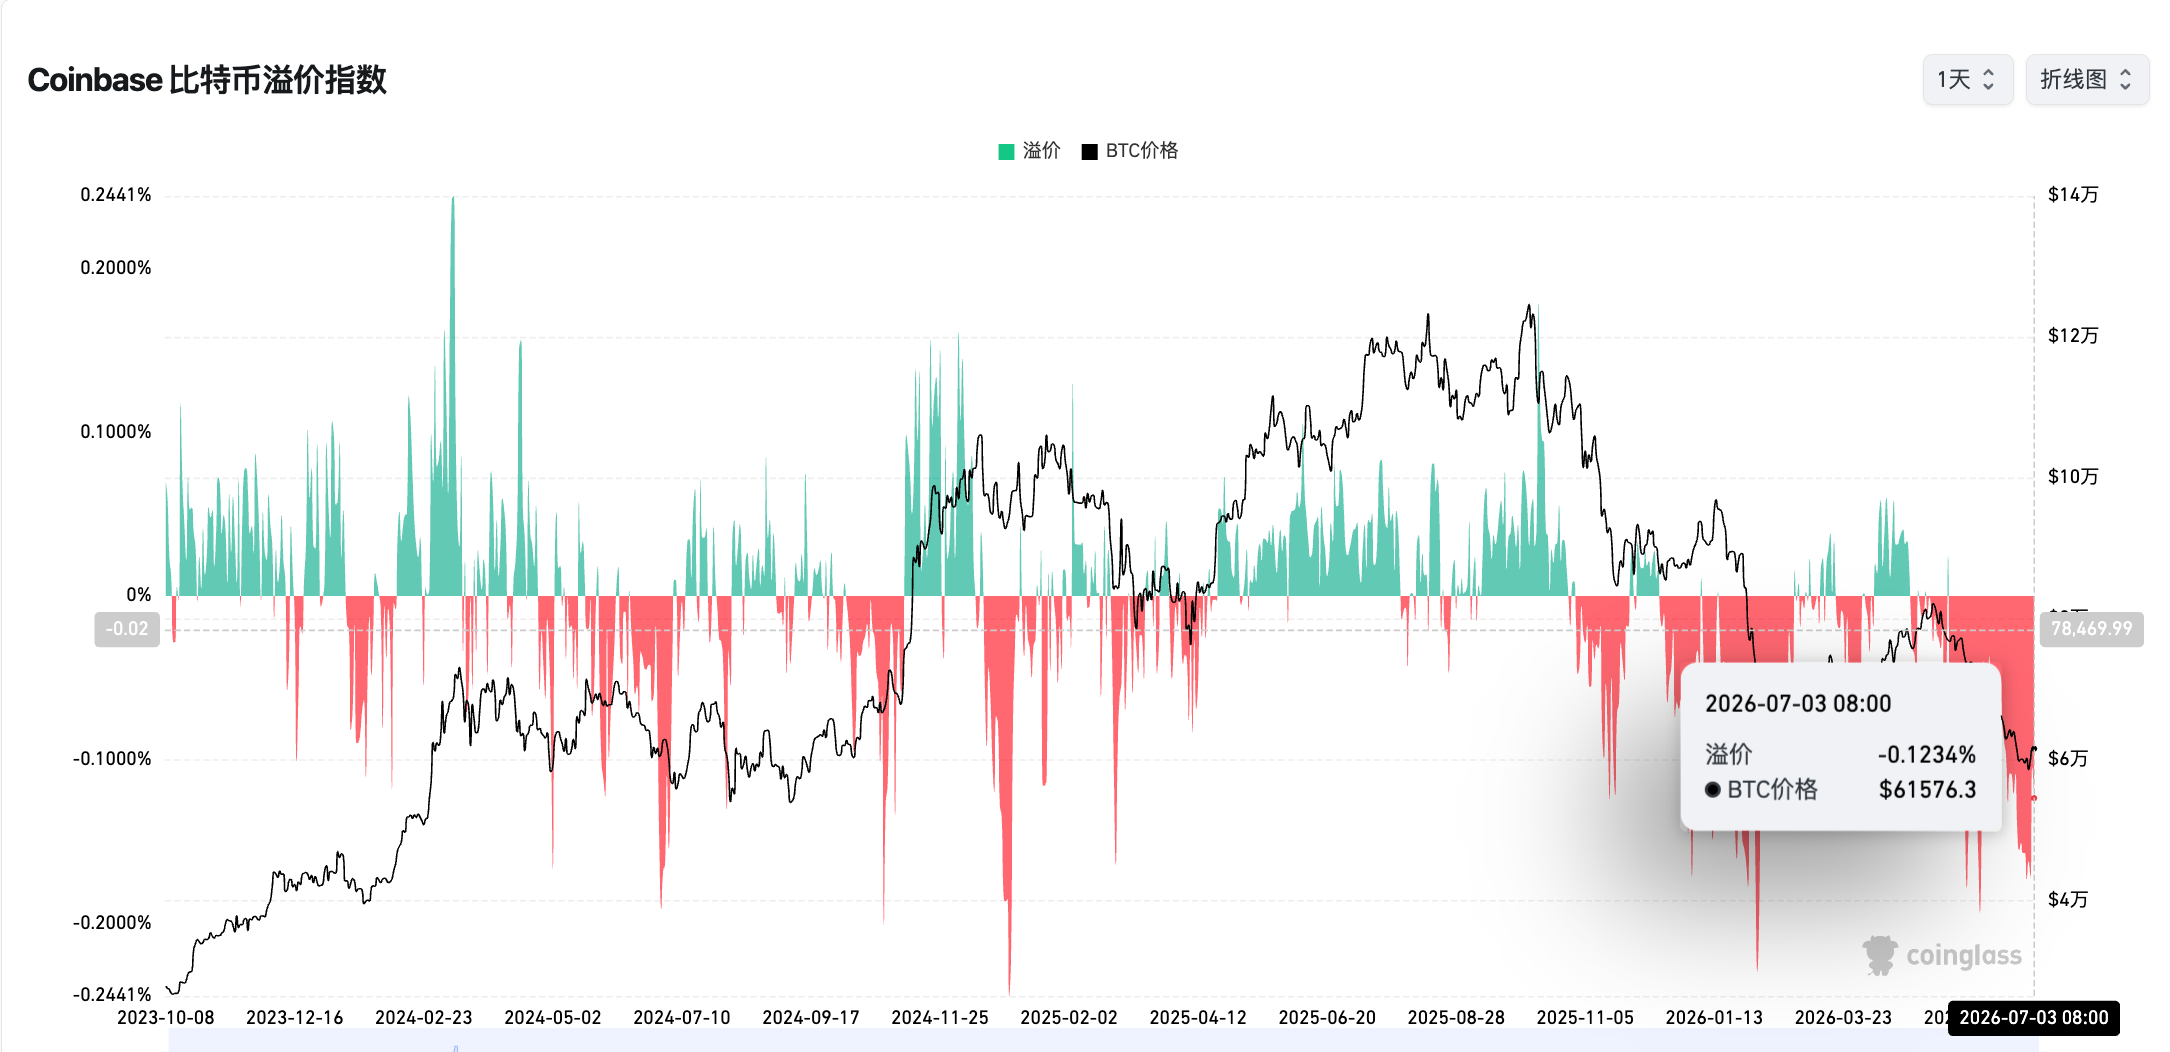
According to Coinglass data, from May 19th to today (July 3rd), the Coinbase Bitcoin Premium Index has been in a "negative" state for 46 consecutive days, setting a new record for the "longest consecutive negative" streak. Previously, this index was in negative premium for 40 consecutive days from January 16th to February 24th this year, setting the longest "consecutive negative" record since the launch of this indicator, surpassing the approximately 30-day consecutive negative premium during last year's "October 11th crash" period.
Considering that BTC and ETH have recently fallen below key levels such as $58,000 and $1,600, the specific timing for the end of the bear market remains unclear, and for many, the waiting is particularly excruciating.
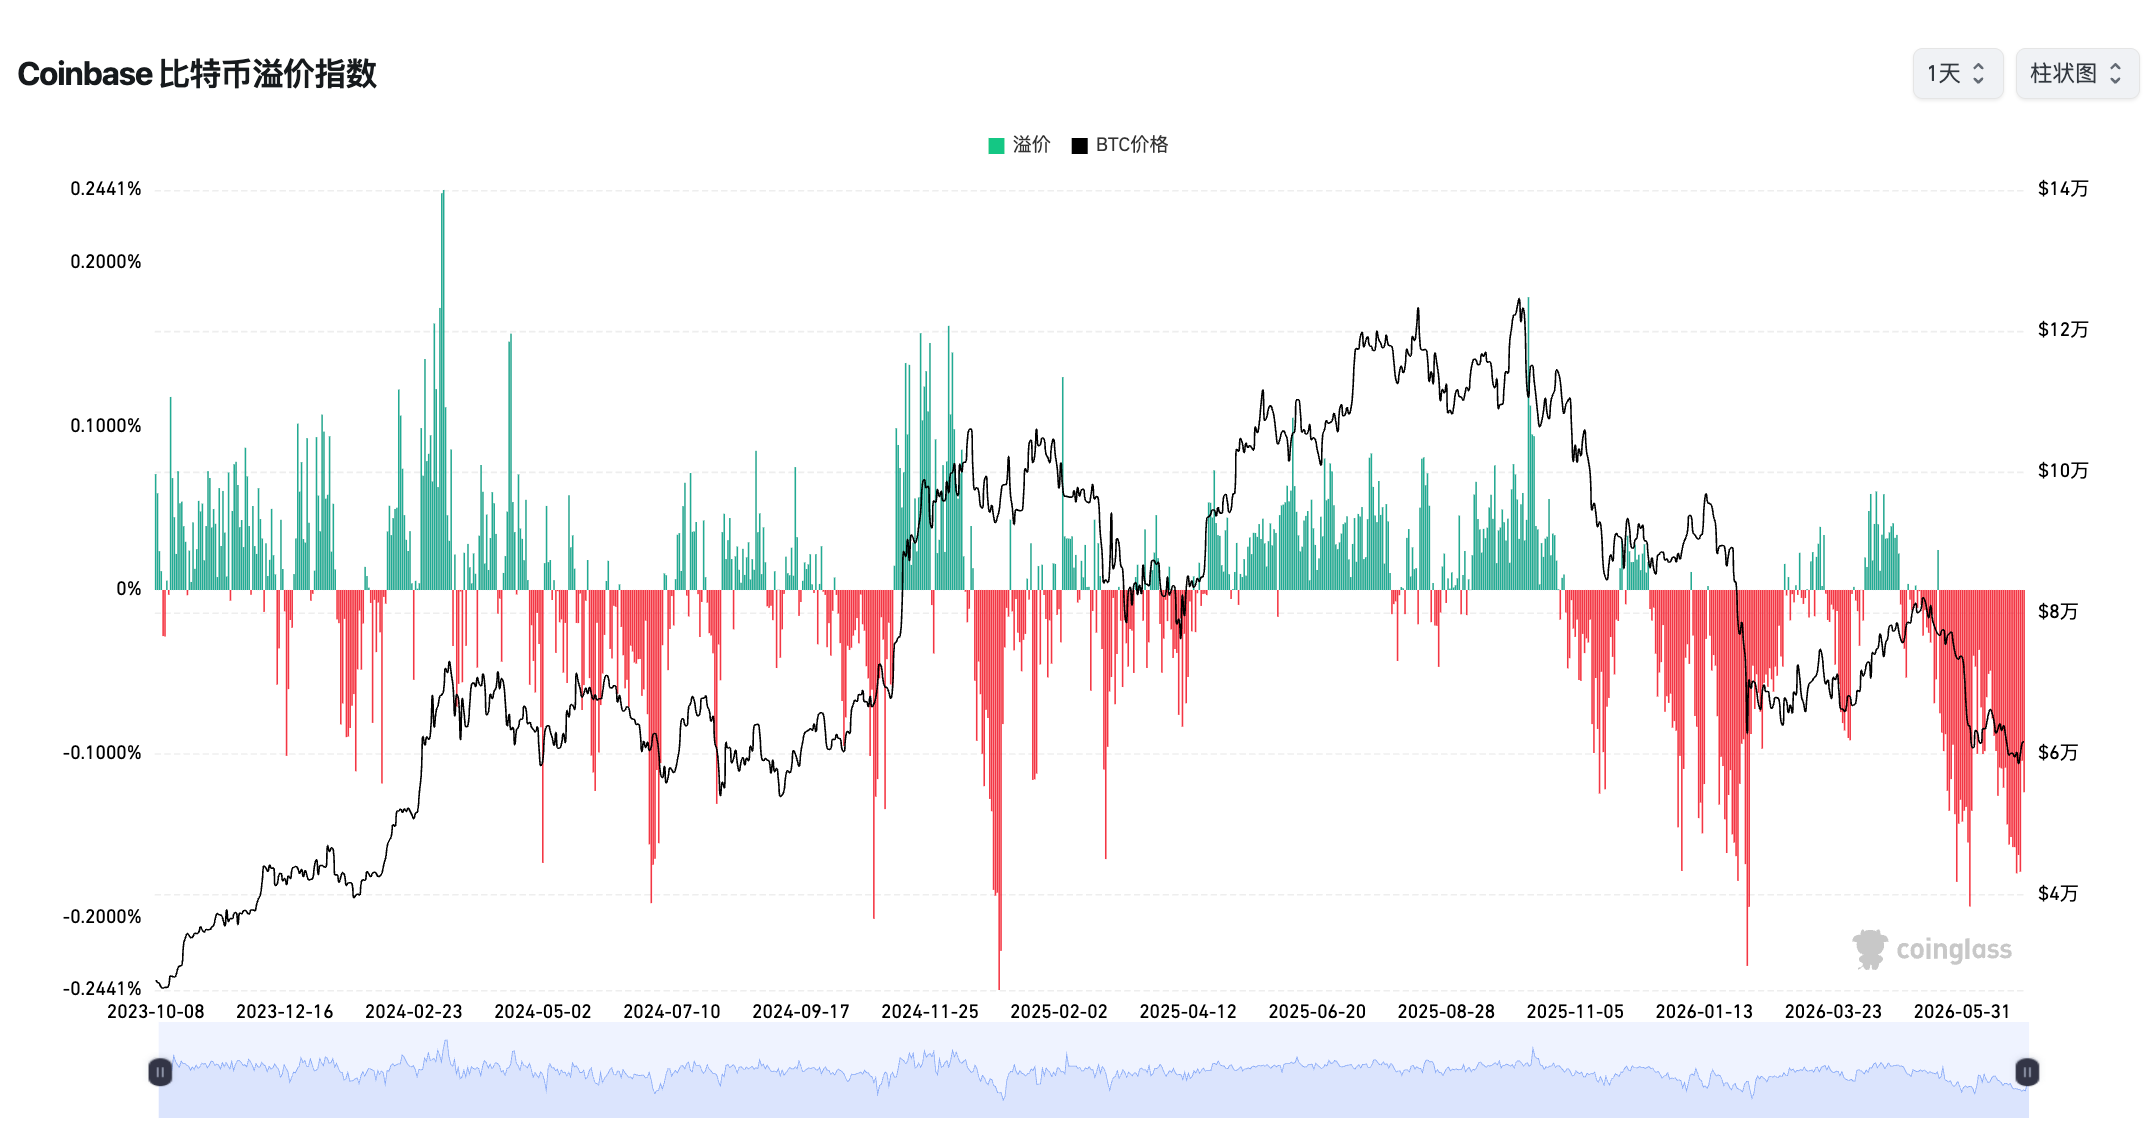
Coinbase Bitcoin Premium Index Overview
Major Catalyst for the BTC Plunge: Strategy Sells Bitcoin to Survive, Expanding the Loss-Making Group
In late May and early June, the largest BTC treasury company and crypto concept stock leader, Strategy, sold BTC again after a 3-year hiatus. This transaction involving only 32 BTC quickly triggered widespread panic in the crypto market, like the last straw that broke the camel's back. Prices of mainstream coins like BTC, ETH, and SOL subsequently plummeted.
Compounded by factors such as continuous net outflows from Bitcoin spot ETFs and sustained bleeding in the crypto market, the shadow of the crypto bear market once again looms over everyone in the industry.
Bear Market Begins: BTC Had Its Worst Single-Week Performance Since 2022 in Early June
In the first week of June, Bitcoin once fell below $60,000, marking its worst single-week performance since the collapse of FTX exchange in 2022. Over the nearly 7 days leading up to June 7th, Bitcoin fell by a cumulative 16%, retracting over 50% from its all-time high of over $126,000 in 2025.
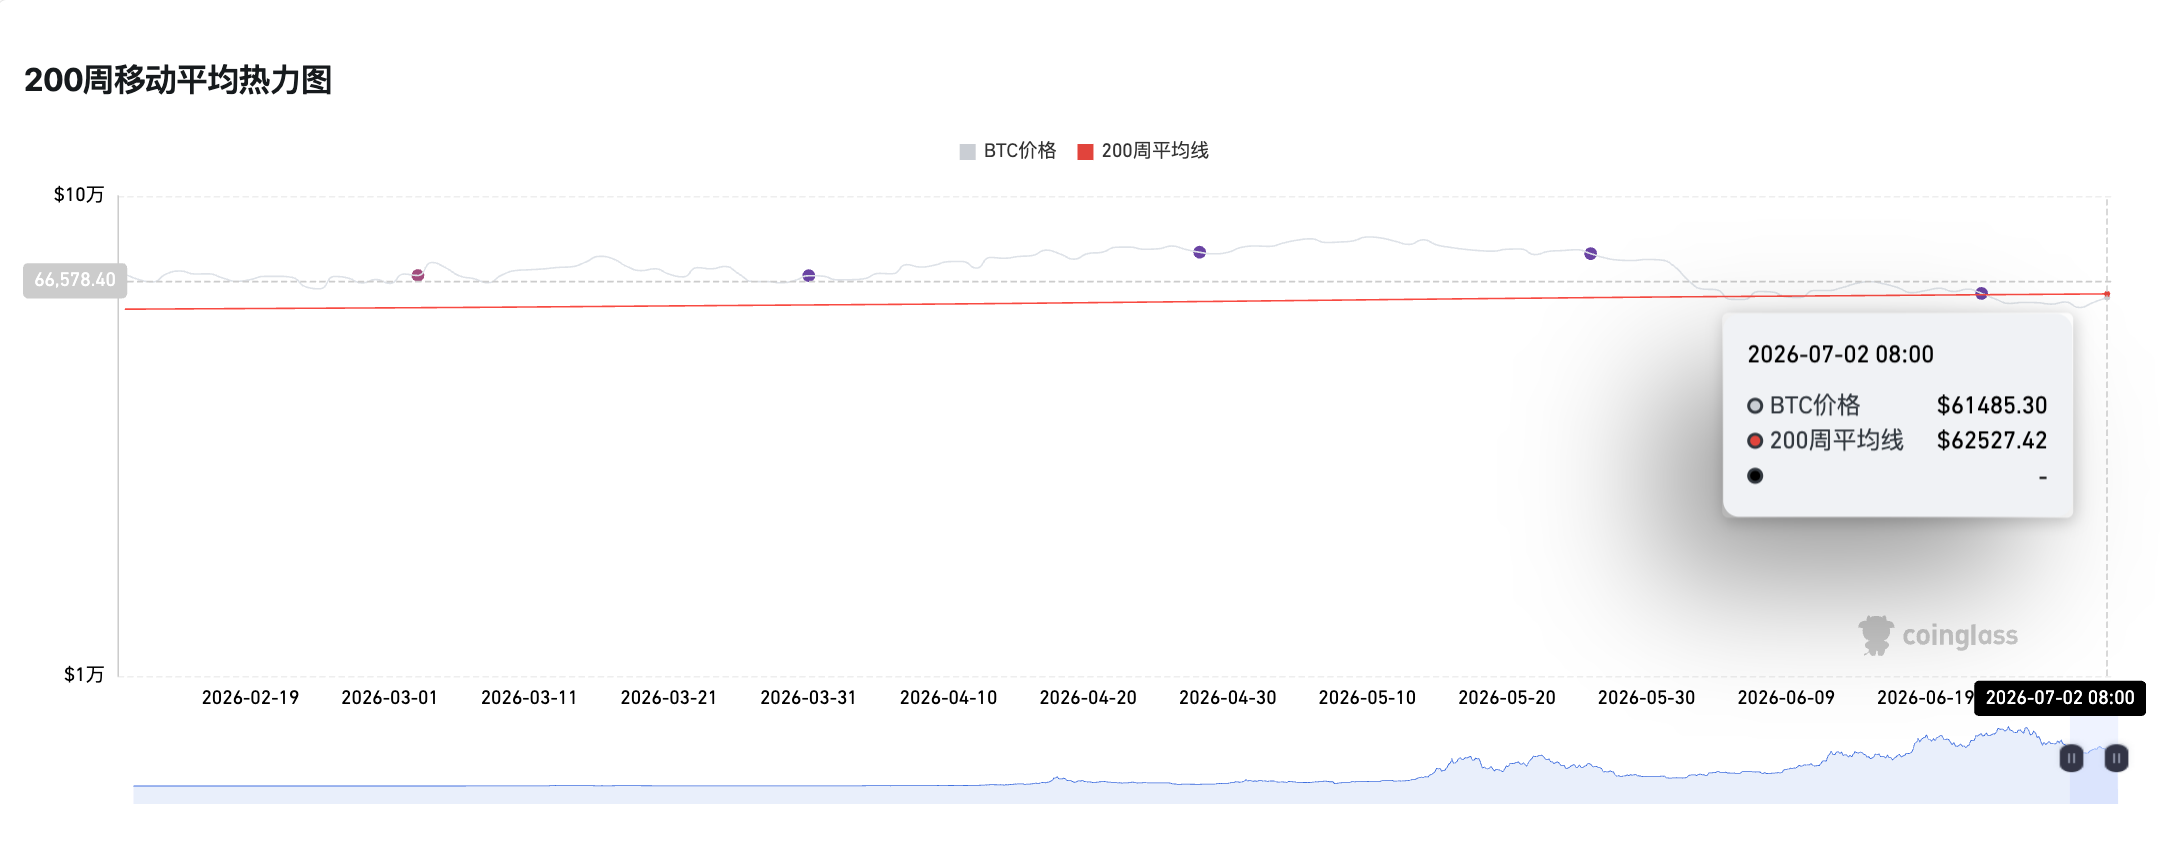
Data-wise at that time, US spot Bitcoin ETFs had recorded net outflows for 13 consecutive trading days, with cumulative outflows of approximately $5.5 billion. Simultaneously, Bitcoin's price fell below the widely regarded key support level of the "200-week moving average," further eroding market confidence.
Paul Howard, Senior Director at crypto trading firm Wincent, described the current market as a "silent bear market," believing that breaking below the 200-week moving average is an important confirmation signal that the market has entered a bear market phase.
Although BTC subsequently rebounded slightly to around $65,000, many market analysts warned at the time that the rebound might be unsustainable, and Bitcoin might not yet have hit the bottom of this cycle. Griffin Ardern, Co-founder of Primal Fund, stated that the market remains a considerable distance from the "real bottom."
In my opinion, if there was still hope for a significant rebound in BTC in May, Strategy's act of selling Bitcoin to survive directly shattered people's last shred of fantasy, symbolically raising the curtain on the "bear market confirmation."
Bear Market Continues: Predictions of Bear Market End by Various Institutions Proven Wrong
On June 11th, crypto research firm CryptoQuant published an article suggesting that Bitcoin might form a bottom around approximately $53,600, which is the current Bitcoin realized price, i.e., the average on-chain cost basis for all market participants. The report noted that in past major bear market cycles, Bitcoin typically bottomed near or slightly below the realized price.
On June 12th, BIT released its latest weekly report "Will the FIFA World Cup Mark the End of Bitcoin's Bear Market?". It posited that Bitcoin's current bear market trend is largely consistent with its outlook from early February 2026, and the predicted A-B-C correction structure has entered its final stage: after Wave A declined to the $60,000-$69,000 range, Bitcoin rebounded to the $80,000-$90,000 range, peaking around $83,000 before the rebound momentum gradually weakened.
BIT pointed out that the current Fear & Greed Index is nearing historically significant low regions, retaining some similarity to the bottom structure of the 2022 bear market. It maintains its previous view that the summer trading lull during the 2026 World Cup might mark the tail end of this Bitcoin bear market cycle.
On June 17th, crypto research company K33 stated that the supply of Bitcoin held by long-term holders has reached a new all-time high, suggesting the bear market might be nearing its end. It emphasized the significant decrease in old-coin reactivation activity in 2026; as of June 6th, only 218,421 BTC had been reactivated, indicating a substantial reduction in on-chain selling pressure. In contrast, by the same period in 2024, 1.18 million BTC had already been reactivated. K33 believes the decline in old-coin activity shows long-term holders have reduced willingness to sell, and patient participants are continuously absorbing supply.
However, soon after, BTC's further decline shattered the illusions of these viewpoints, and the bear market's march continues.
Bear Market Indicators: STRC De-pegs from $100, Losses Expand for BTC and ETH Long-term Holders
On June 18th, after falling below $95 earlier in the month, the price of STRC, the preferred stock issued by Strategy, fell below $90, closing at $89, marking its lowest daily close since its IPO and the lowest dividend-adjusted close since November last year.
Subsequently, STRC continued its downward trend, persistently de-pegging.
On June 26th, STRC's pre-market price once fell to $73, hitting a new historical low. Market focus then shifted to two events: first, the ex-dividend date on June 30th, with eligible holders receiving a $0.48 per share dividend on July 15th; second, the monthly dividend rate reset, where STRC's effective yield was approaching 15%, and investors expected Strategy to raise the dividend rate from 11.50% to at least 12% or 12.50%.
Three days later, on June 29th, Strategy announced a $1 billion Digital Credit Securities repurchase program; and launched a board-approved "up to $1.25 billion BTC Liquidation Plan." Its dollar reserves also increased to $2.55 billion through the implementation of various financing plans, enabling interest payments on preferred stocks like STRC. STRC's discount crisis was temporarily resolved, and its price rebounded above $80, currently quoted at $87.87.
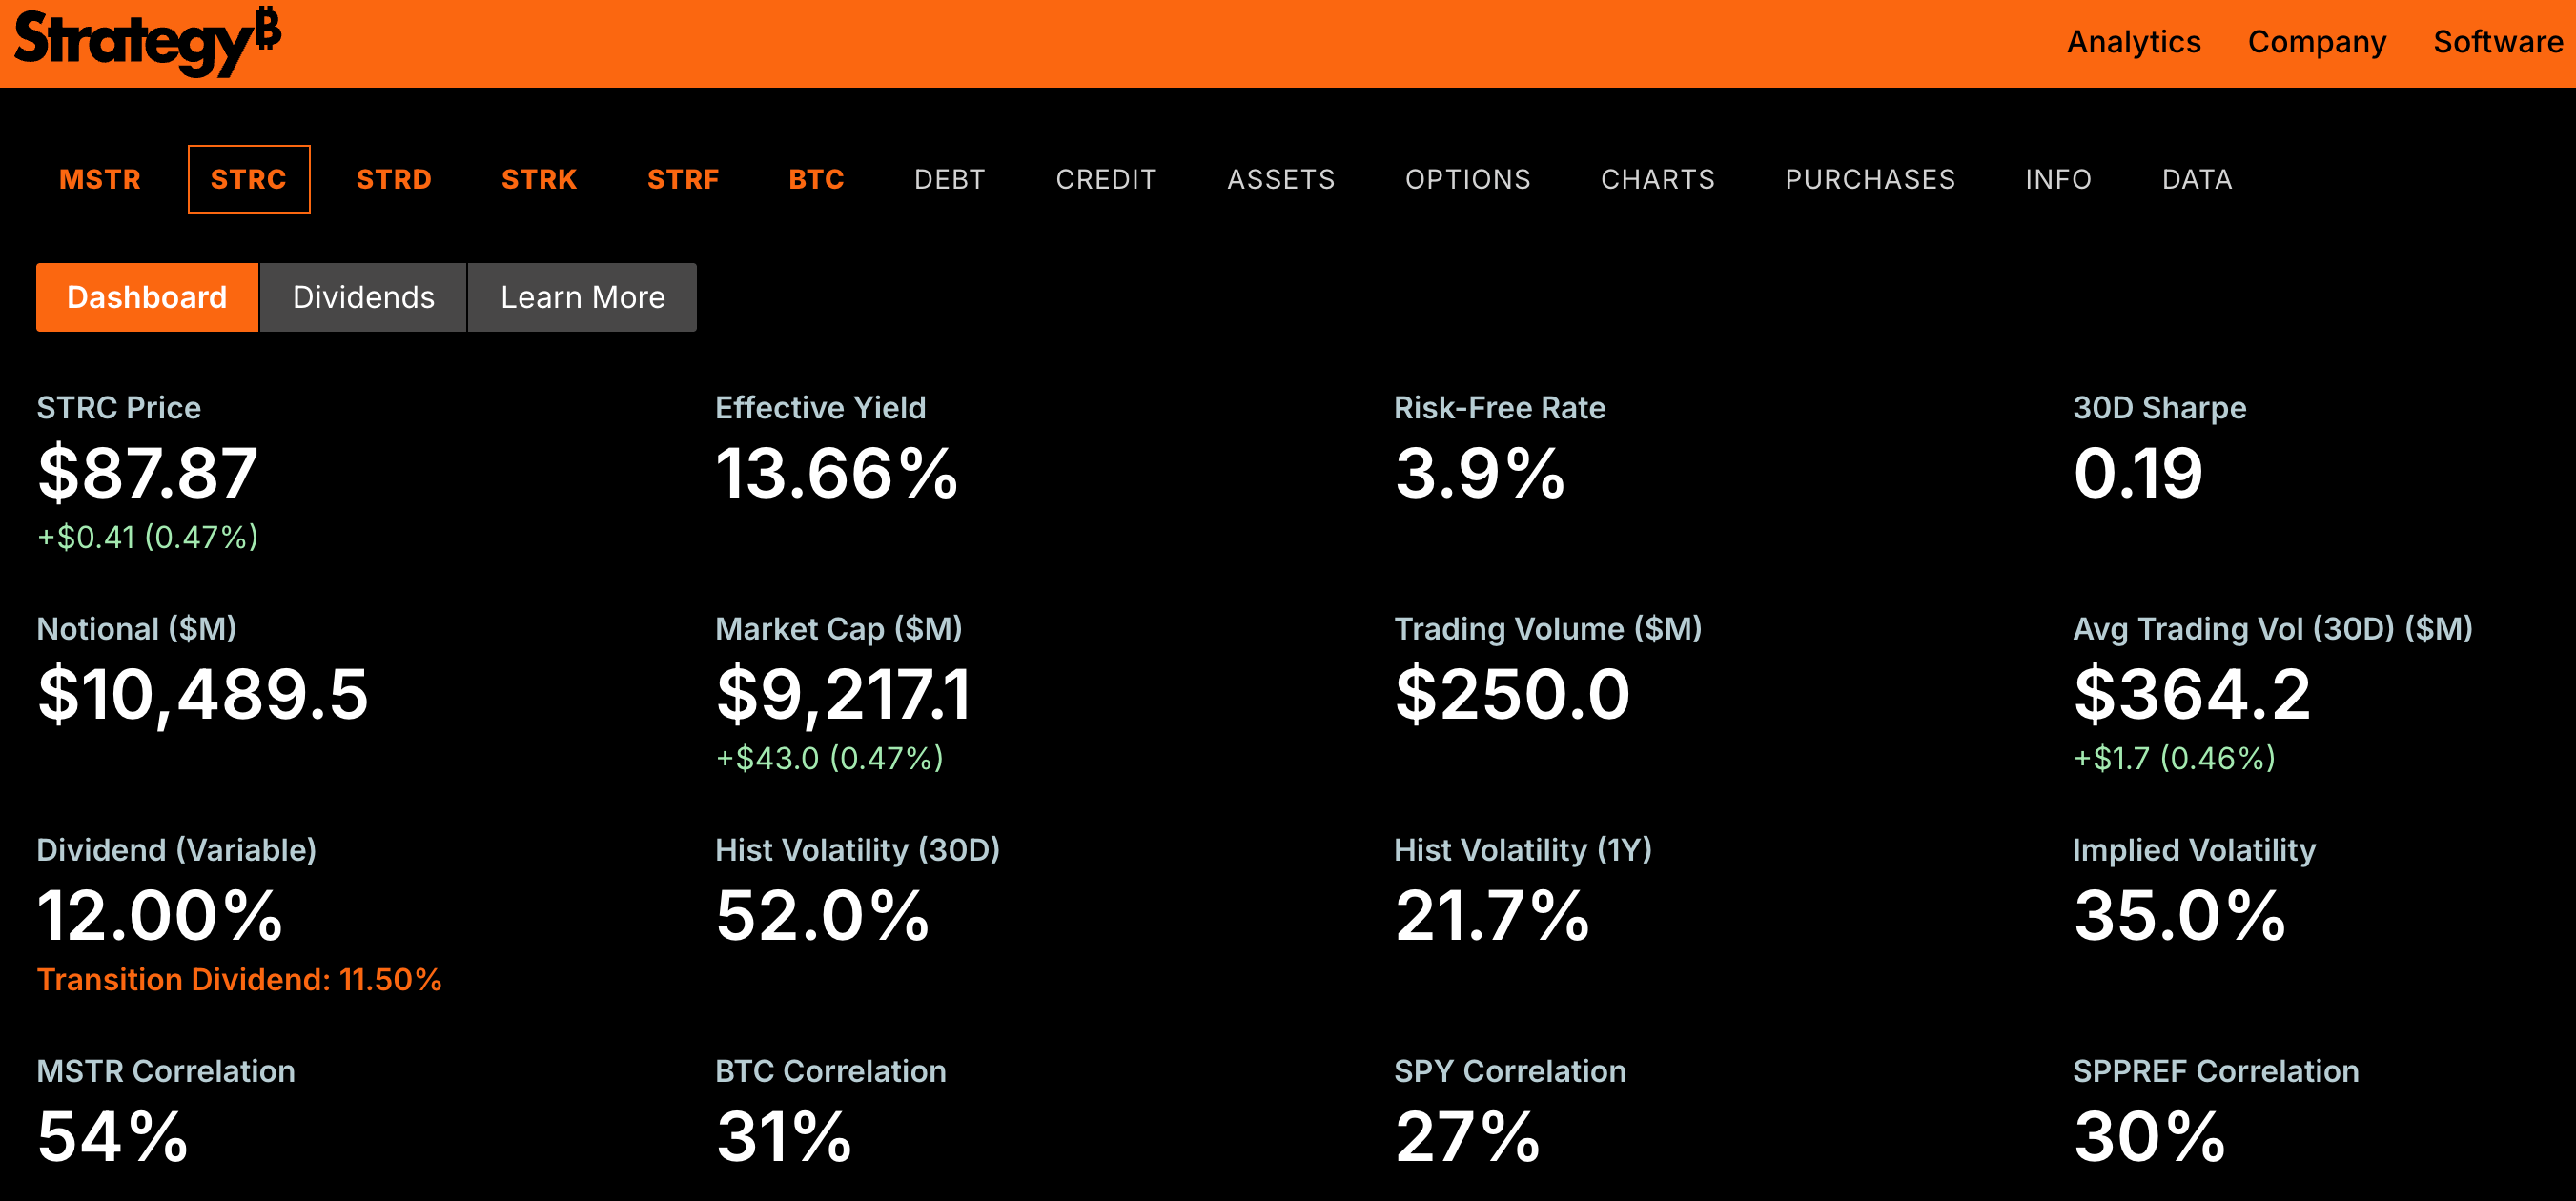
Source: Strategy Official Website
However, influenced by the continued decline of BTC and ETH, losses for long-term holders have further expanded.
On June 25th, Bitcoin once fell to around $59,100. The amount of BTC in a loss state reached 10.83 million, a new historical high, surpassing the previous bear market bottom peak of about 10.5 million. Long-term holders (holding for at least 155 days) held a record 14.8 million BTC (Odaily Planet Daily Note: Total circulating Bitcoin is approximately 20 million), with 37% of that in a loss state. The latest data shows that the amount of BTC held long-term has grown to 16.61 million BTC today, with the average holding cost falling to around $49,700.
According to data on June 26th, ETH whales have fallen into a loss, the first time this situation has occurred since 2019. Even during the 2022 bear market, the largest whales holding over 100,000 ETH remained profitable. Currently, the unrealized profit ratios for three categories of whale groups are all negative: -0.26 for the 1,000 to 10,000 ETH range, -0.21 for the 10,000 to 100,000 ETH range, and -0.05 for the over 100,000 ETH range. This state has persisted for several weeks.
On June 28th, Bitcoin UTXO data indicated that the ratio of loss-making transactions to profit-making transactions in the current market has fallen to the lowest level of this bear market cycle, showing investors are entering a clear "capitulation" phase. A similar low level last occurred during the deep stage of the mid-2023 bear market, when Bitcoin's price once fell to around $26,000.
Previously, due to the continuous price decline, ETH's market cap once fell below $185 billion, being surpassed by USDT. With the price rebounding above $1,700, ETH's market cap is currently quoted at $207 billion.
In summary, key indicators for the end of the bear market will be STRC re-pegging to $100, and BTC and ETH long-term holders exiting loss states.
Speculations on the Bear Market End Date: August or December?
Regarding the specific timing for the end of the bear market, there is currently no mainstream consensus. Here, we only refer to the views of some industry figures for reference.
Li Hua Yi: July-August Might Be a Good Opportunity to Bottom-fish
In late June, TrendResearch founder Li Hua Yi posted that the current situation represents the third wave of decline since October 11th. According to wave theory and cycle patterns, this is likely the final major decline for Bitcoin.
The market is most concerned about Bitcoin's bottom price this time, with the main factors being the US stock market and MicroStrategy. The Fed's concerns about CPI might trigger changes in rate cut or even rate hike expectations, leading to a sustained correction in US stocks. Secondly, past bear market tails often saw black swan events or blow-ups, which have not yet appeared this cycle and require close observation.
Calculating from Bitcoin's peak of $126,000, a 60% drop corresponds to $51,000, and a 66% drop corresponds to $43,000. Regardless, July to August should be the final period and the best time for bottom-fishing, even the most worthwhile operational opportunity in the next three years.
Jiang Zhuoer: BTC to Bottom Between $42K-$44K in October-December
On June 25th, BTC.TOP founder Jiang Zhuoer predicted that this BTC bear market will bottom at $44,016 on October 31st this year. Based on the pattern where mNAV leads the coin price to bottom by 6 months, he revised the bottom window to October-December 2026, with a bottom price range of $42,000 to $44,000.
He explained the logic behind it: Strategy's common stock MSTR's mNAV (stock price per share / BTC value per share ratio) has fallen to 0.72, approaching the low of 0.7 from the last bull market on May 11th, 2022. Considering recent market sentiment events like the significant de-pegging of STRC, this can be predicted as the lowest mNAV region for this cycle. However, the lowest mNAV does not coincide with the lowest BTC price. In the last cycle, mNAV bottomed at 0.7 on May 11th, 2022, when BTC was $31,017, while BTC bottomed at $15,476 on November 21st, 2022, when mNAV was 1.2, a six-month gap between them.
BTC Price Indicators: 4-Year Average Price, 200-Week Moving Average Heatmap
According to Coinglass data, the BTC 4-Year Average Price Index showed that from June 25th to June 30th, influenced by BTC falling below $59,000, the index once dropped to 0.95; currently, with BTC rebounding above $61,000, it has recovered to around 1.
According to the BTC 200-Week Moving Average Heatmap, BTC's price is currently roughly level with the 200-week average line, and has consistently stayed below it since June 23rd, possibly hinting at a price bottom.
Furthermore, returning to the Coinbase Bitcoin Premium Index mentioned at the beginning of the article, it currently remains at -0.123%. Judging from previous positive ranges, the index would only have a chance to turn positive if BTC's price rebounds to around $77,000.
In summary, in the absence of strong external positive catalysts, this bear market will likely last at least another 2-3 months. Late September to early October will be the critical window period to determine whether BTC can rebound.
Recommended Reading
4 Classic Bottom-fishing Indicators Completely Fail, Do 3 New Indicators Point to the Timing?