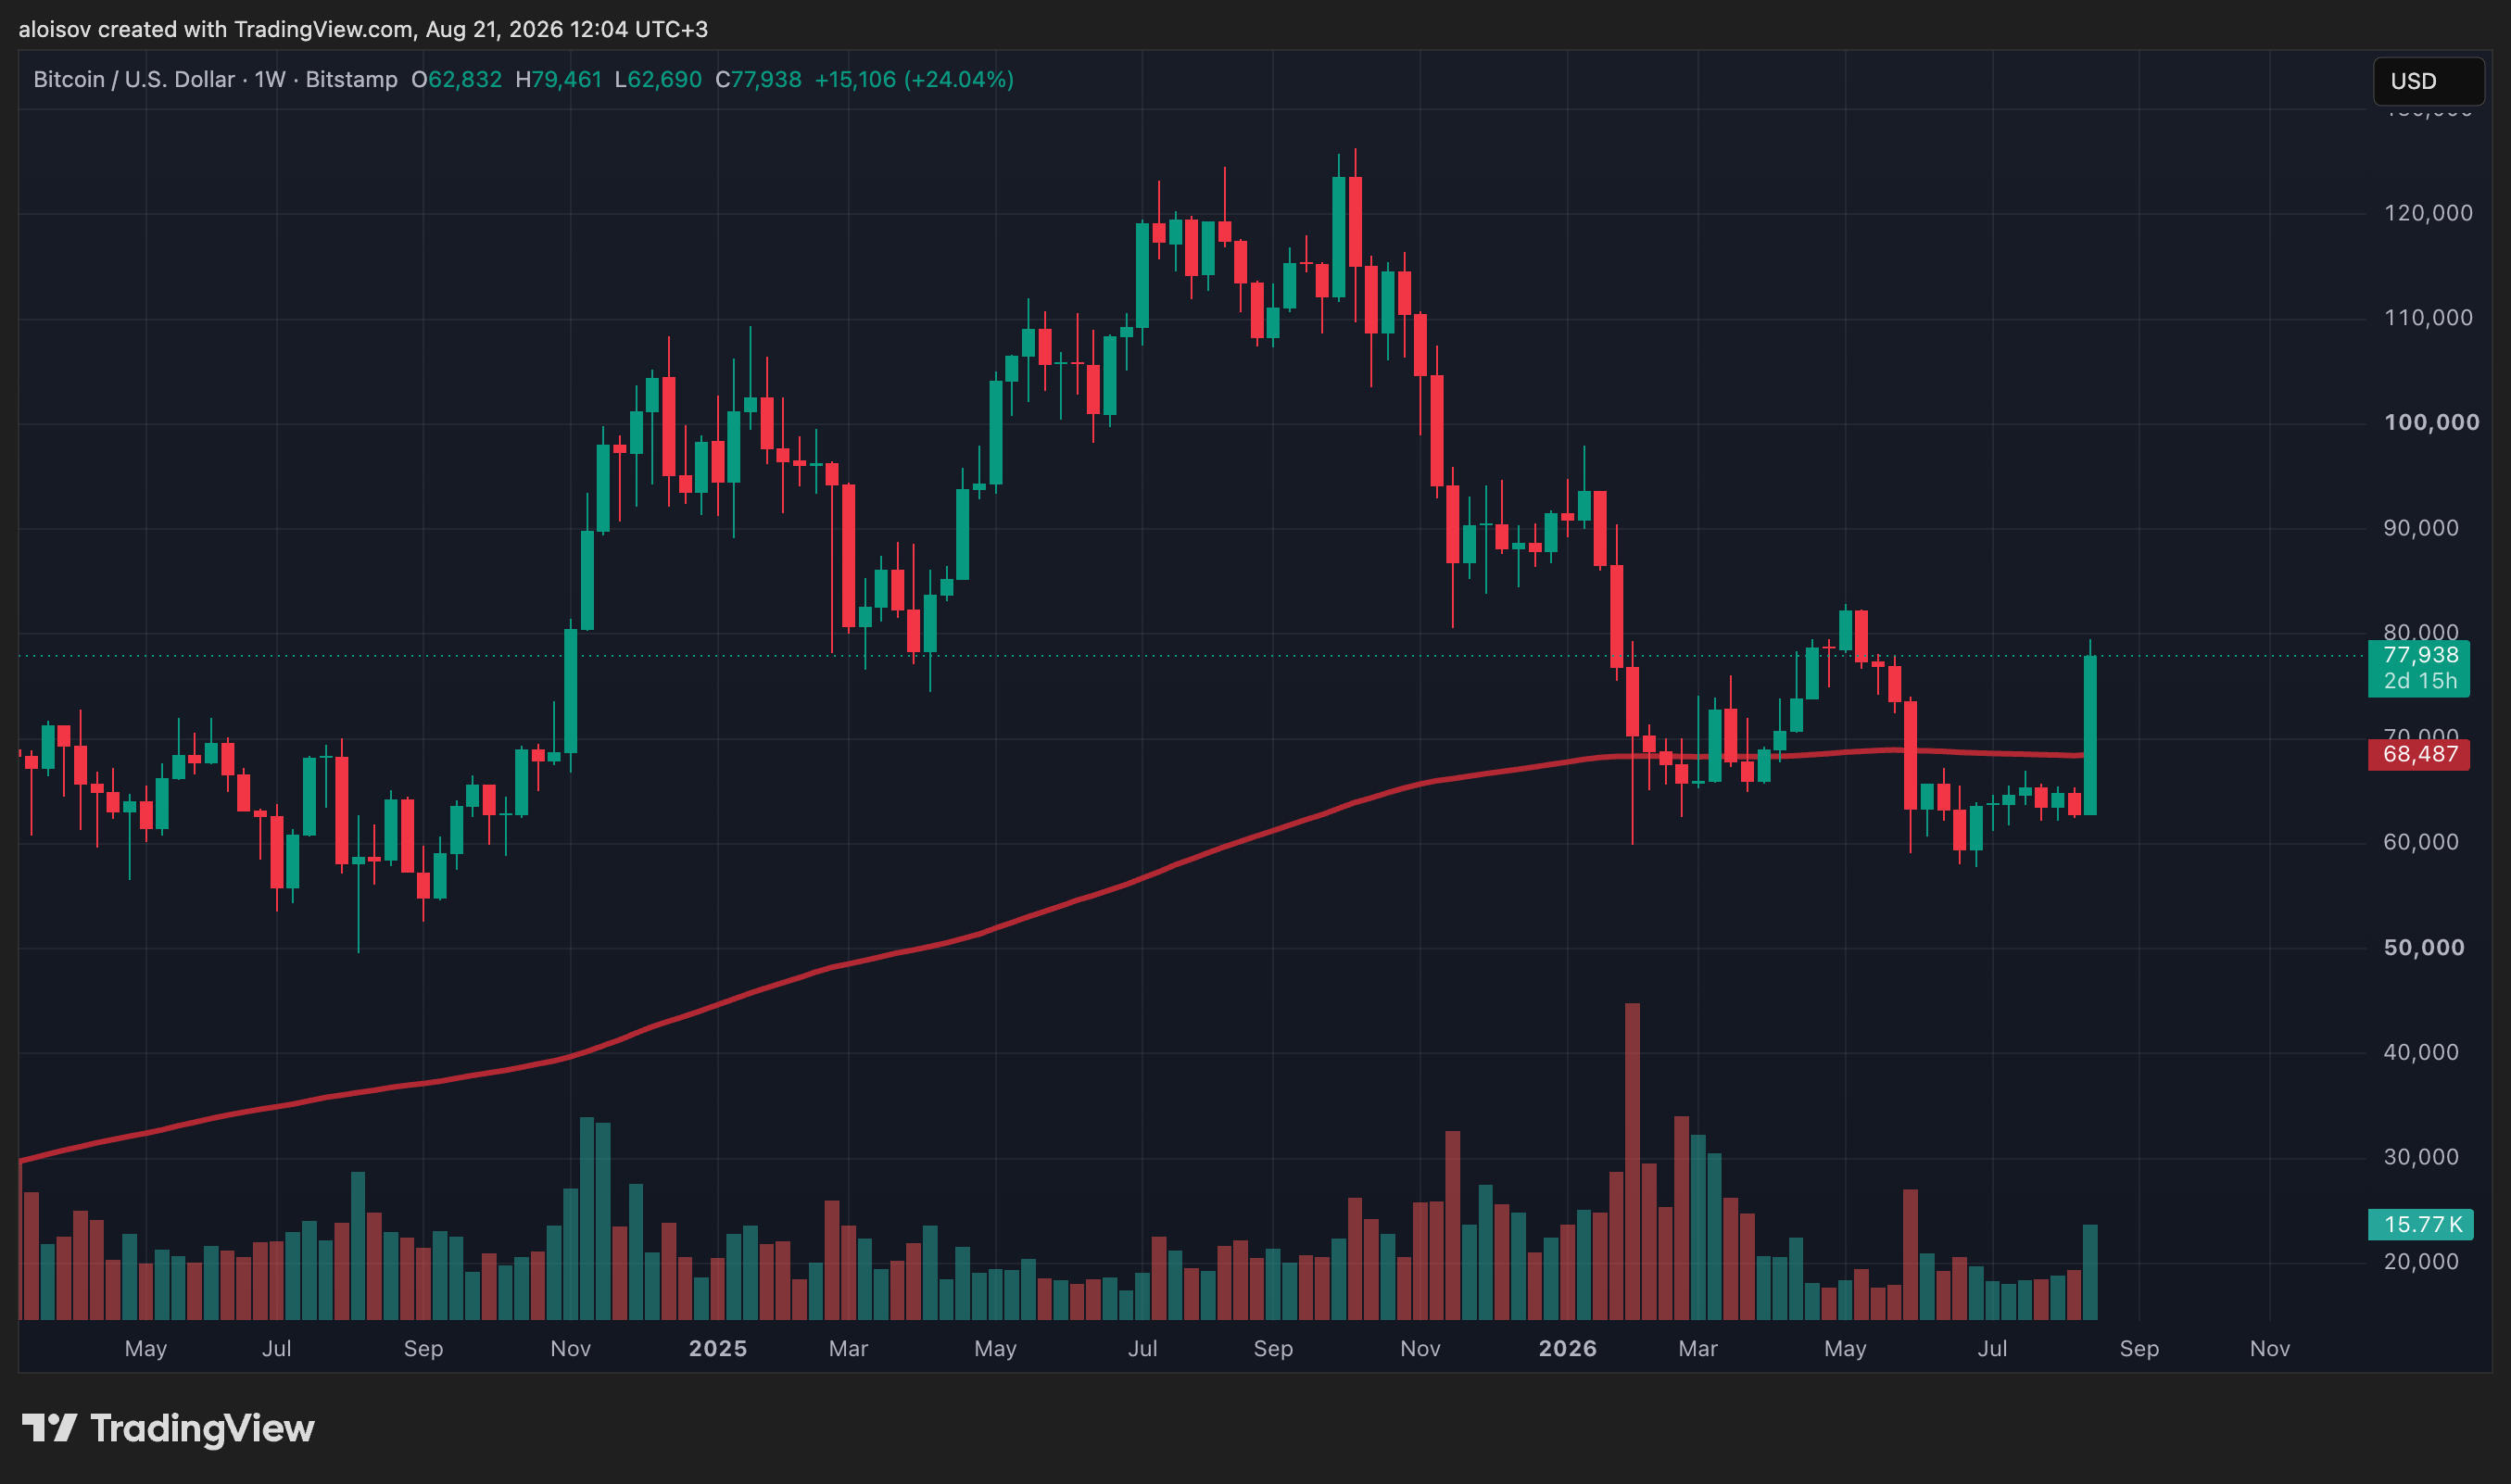
Bitcoin climbed above the $79,000 mark on August 21, marking a 25% increase since the beginning of the week. This move was accompanied by a massive liquidation of short positions and has become a topic of discussion among several analysts and traders on the social network X.
Short Liquidations Amid the Rally
Crypto YouTuber Crypto Rover highlighted the volume of forcibly closed positions: according to CoinGlass, over the last 24 hours, more than $1.2 billion worth of short positions were liquidated. He characterized the candles on the Bitcoin chart as extremely aggressive against the bears—the sharp upward movement caught those betting on a price decline off guard.
Technical Targets and a Potential Correction
Trader and investor Crypto Candy noted that after breaking out of the consolidation zone, Bitcoin rapidly hit both previously identified targets—$70,700 and $75,000—in just one day. In his assessment, a short-term pullback is possible; however, if the current momentum is sustained, movements toward $77,000 and then $83,000 are not out of the question. He stated that this scenario remains relevant as long as the price holds above the $70,000 level.
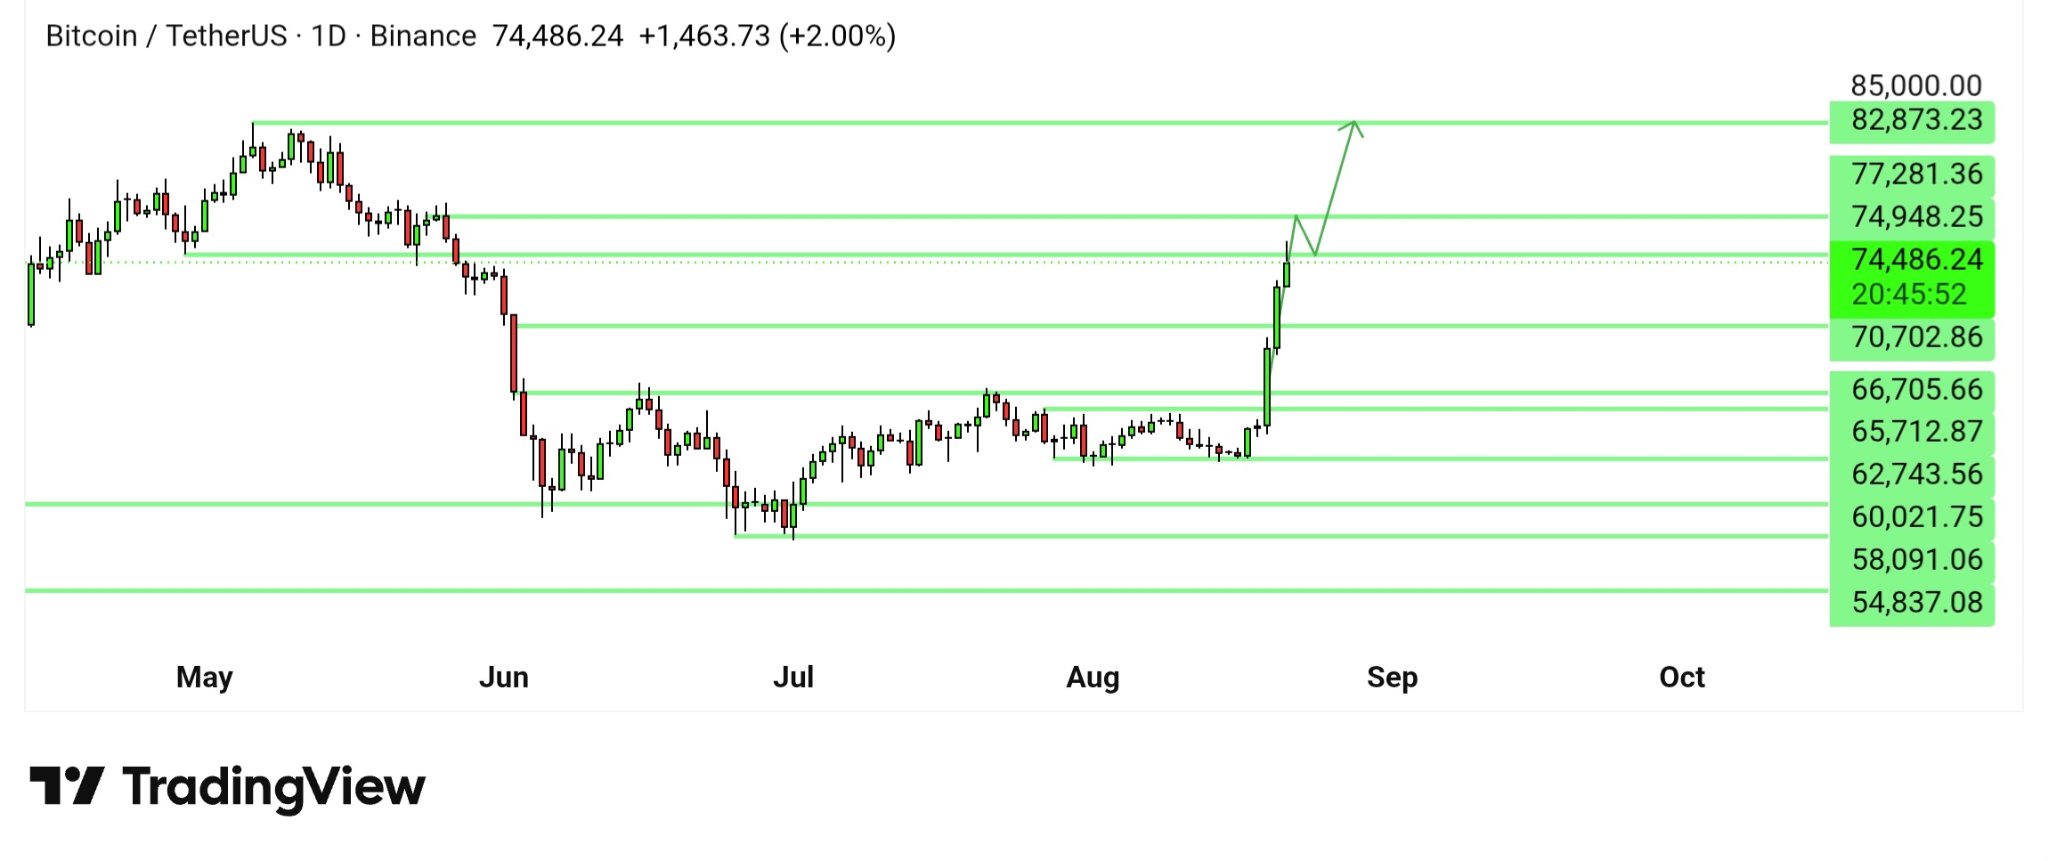
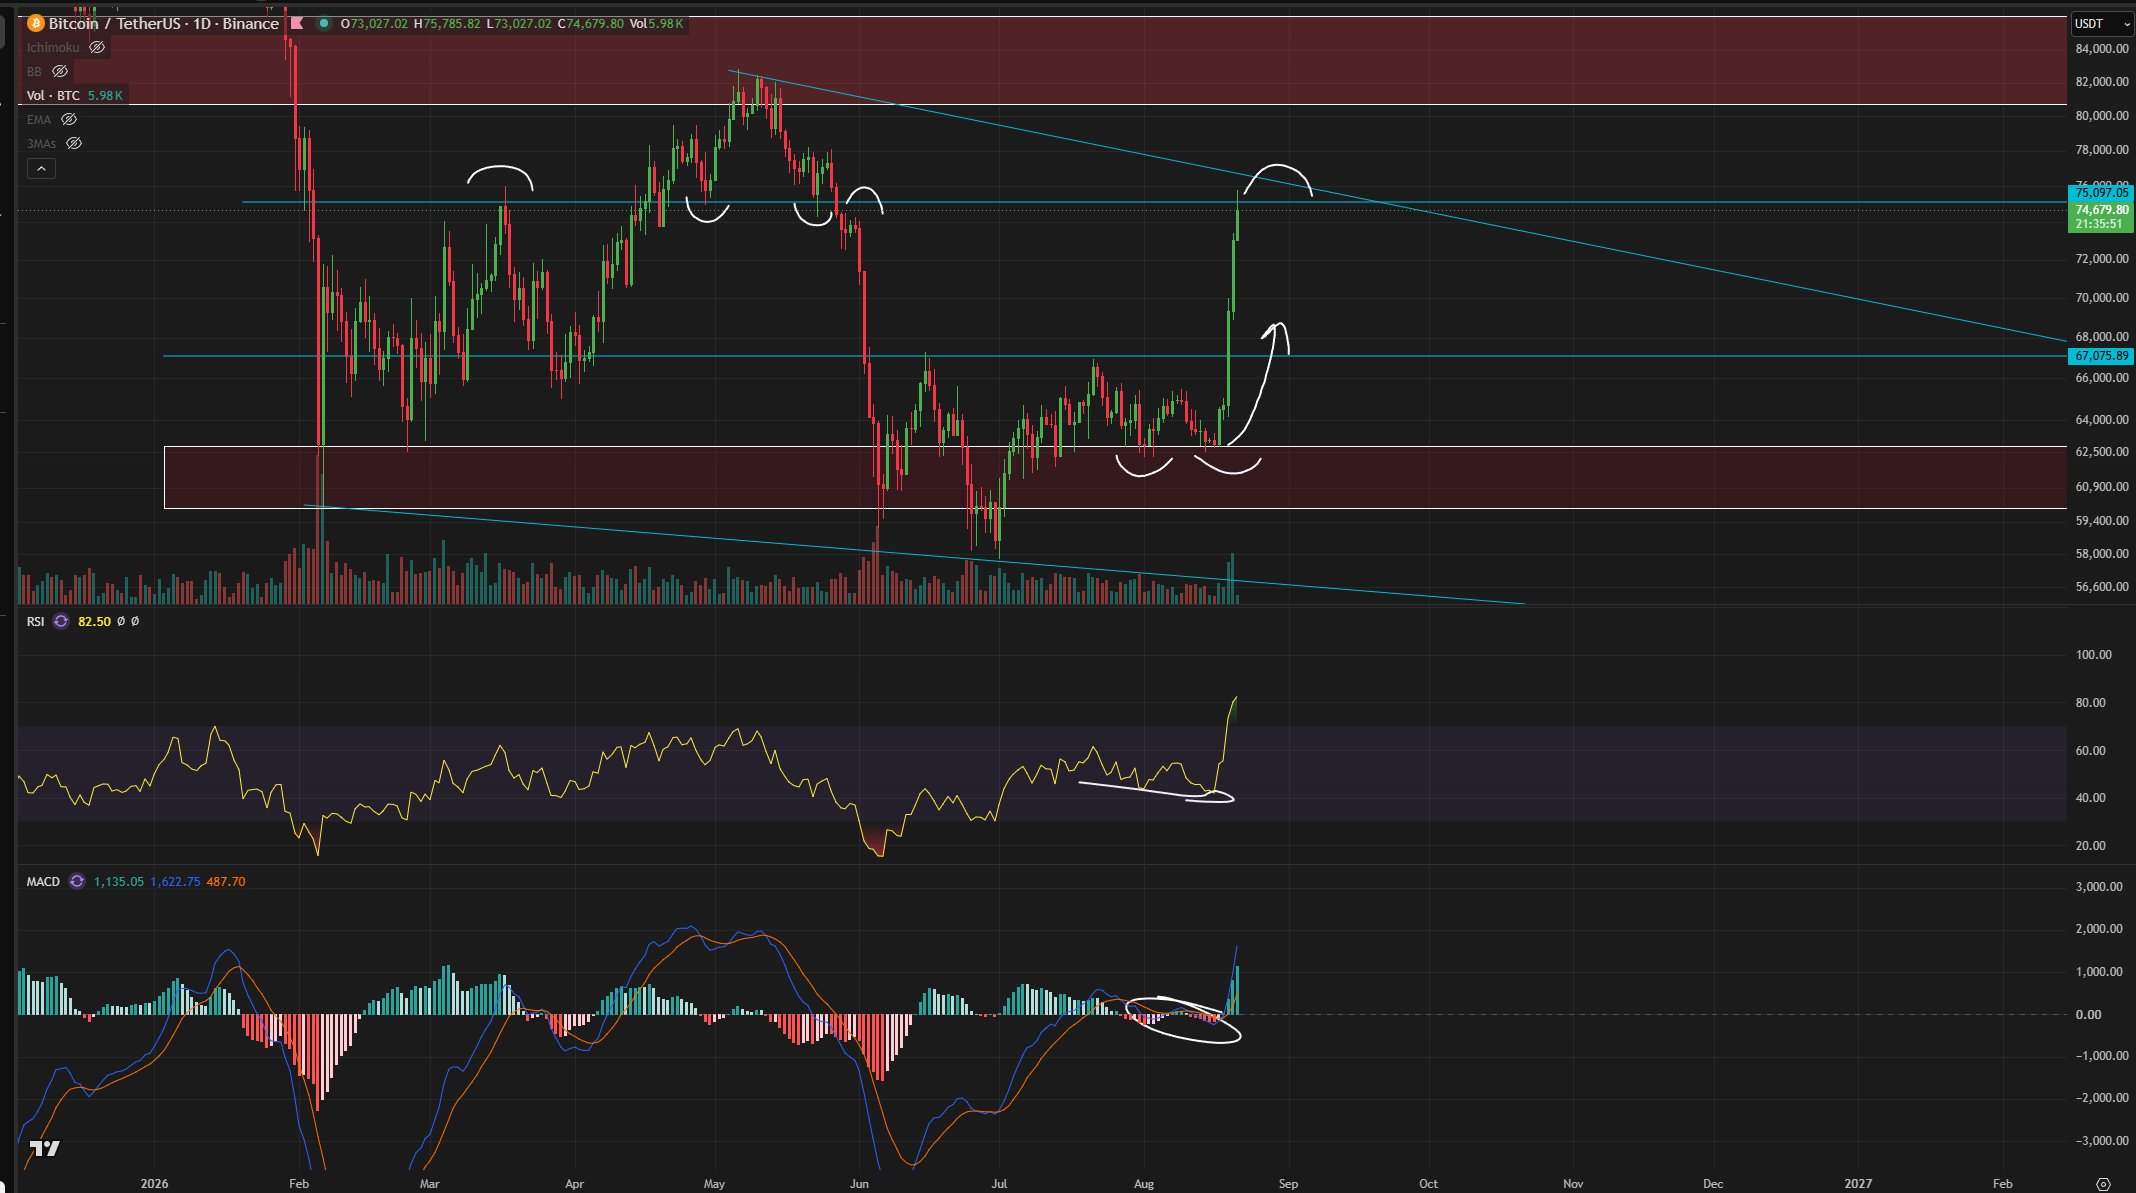
Trader Roman holds a similar view. He reminded his audience that as recently as August 19 during a live stream, he spoke about the potential for a move to $75,000 in the coming days—a forecast that has now materialized. His assessment was based on a bullish deviation, a reversal indicated by a divergence indicator, and the overall price behavior structure. According to him, a sustained uptrend has been observed for over ten months, and a slight pullback at current levels cannot be ruled out.
The Weekly Candle and Moving Averages
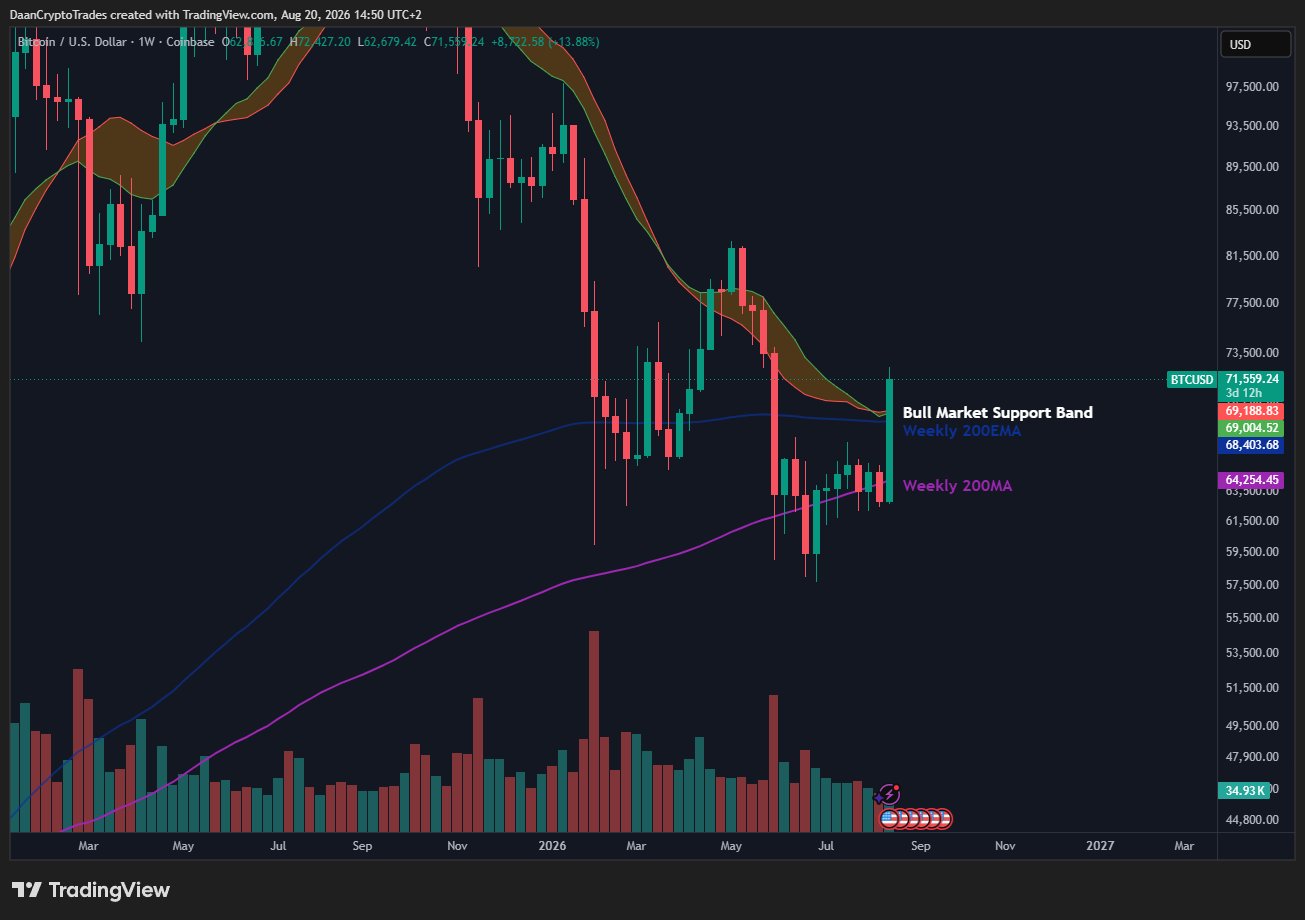
Trader Daan Crypto Trades drew attention to Bitcoin's attempt to establish itself above the bull market support band and the weekly 200-period exponential moving average (EMA). He emphasized the significance of the horizontal $73,000–$74,000 level: closing above this zone, in his opinion, would increase confidence in a move toward the May highs. However, he suggested waiting for the closure of the current weekly candle at or above the achieved levels—this in itself would already be a positive signal.
Key Levels
$70,000 — the level above which, according to analysts, the bullish scenario remains intact.
$73,000–$74,000 — the horizontal resistance level noted by Daan Crypto Trades.
$79,000 — the mark reached on August 21.
$83,000 — the next potential target according to Crypto Candy's assessment.
Thus, several traders agree that the key reference point for further movement remains the $73,000–$74,000 zone, with further targets along the current trend lying in the $80,000–$83,000 range.
Analysts also allow for a short-term correction after such a sharp move, while noting that the overall chart structure—from the weekly close above the 200 EMA to the bullish divergence—continues to point to the preservation of the upward trend.
The AI Perspective
From a machine data analysis perspective, Bitcoin's current jump to $79,000 resembles the structure of events from a year ago. The asset already breached the $70,000 mark on the back of a similar short squeeze on August 20, and the parallel with the summer of 2021 shows that short liquidations back then also exceeded $1 billion in a day, after which the price corrected by almost 20% from the local peak. Such episodes often represent a short-term impulse rather than a definitive trend reversal.
A technical aspect not addressed in the article is the derivative nature of such rallies. Analysts at Hash Telegraph have previously noted that sharp spikes amid mass liquidations often reflect the effect of cascading position closures rather than a real breakout of a level by spot market demand. Will the current momentum persist after the weekly candle closes, or will the market return to testing the $73,000–$74,000 zone?
end-content