Wall Street FOMO Rally Continues to Heat Up, How Did Four Days of Gains Surpass Three Months of Fluctuations?

marsbitPubblicato 2026-08-11Pubblicato ultima volta 2026-08-11

Introduzione

A FOMO-driven rally on Wall Street saw the S&P 500 surge 5.8% over four consecutive trading days ending August 4th, a move whose magnitude exceeded the index's entire high-to-low closing price range from the preceding three months. This rapid ascent, placing the four-day gain in the 99.32 percentile for the past decade, forced late entrants to chase prices higher. Despite the bullish momentum, the VIX volatility index also rose concurrently, indicating that traders were simultaneously hedging against potential downside risks. This was reflected in option markets, where short-term call skew hit a two-year high and the one-month average put/call ratio reached its most bullish level in at least four years, showcasing a rare mix of aggressive optimism and persistent caution.

After the close on August 4th, Wall Street witnessed an acceleration that was hard to ignore. The S&P 500 index had rallied 5.8% cumulatively over the four trading days ending that day. According to Reuters, the options market also showed the most bullish skew in at least four years.

The rally itself is not FOMO. What truly makes this round of market action different is how fast prices moved upward and what price the options market simultaneously placed on both upside and downside risks. On August 4th, closing data compiled by FRED also showed the stock market continuing to climb higher, while the VIX volatility index, which measures expected volatility, also closed higher. Optimism did not push volatility down alongside it.

Why Four Days Can Seem Longer Than Three Months
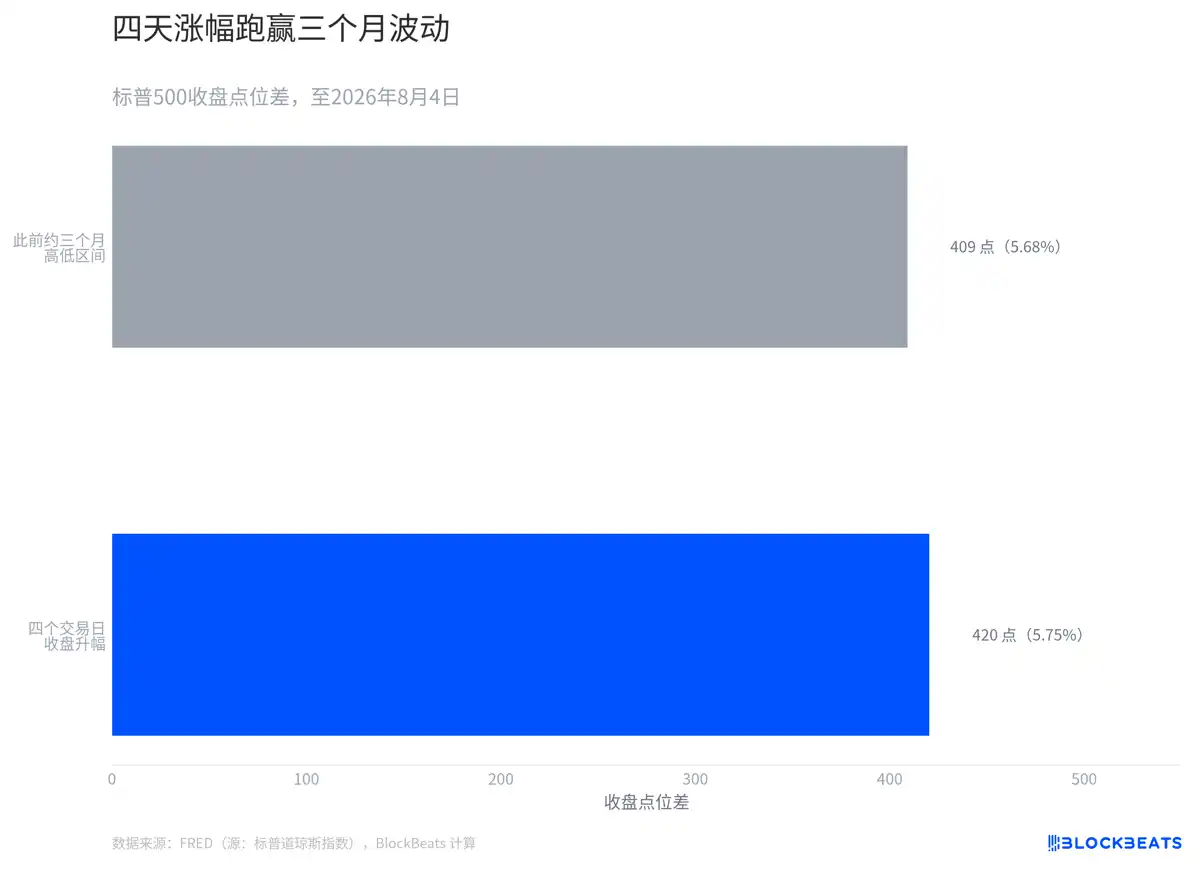
According to the S&P Dow Jones Indices daily closing data compiled by FRED, the economic database of the Federal Reserve Bank of St. Louis, this four-day upward move, measured by the same closing price metric, has slightly exceeded the point difference between the highest and lowest closing prices over the preceding approximately three months.

Placing these two changes side by side is not to equate the four-day return with the three-month high-low range as the same metric. The former indicates direction, the latter a range. They are placed on the same scale to visualize a shift in trading tempo: the closing price fluctuation band formed over months was surpassed by a one-way move over just four trading days.

The price path itself cannot prove the psychology of every participant. What it does illustrate is that four consecutive days of closing price increases rapidly raised the entry price for those joining later. Reuters characterized traders chasing into this rally as FOMO. The speed shown in the chart is precisely the aspect that allows this characterization to be tested against the price series.

How Rare Is This in the Past Decade?
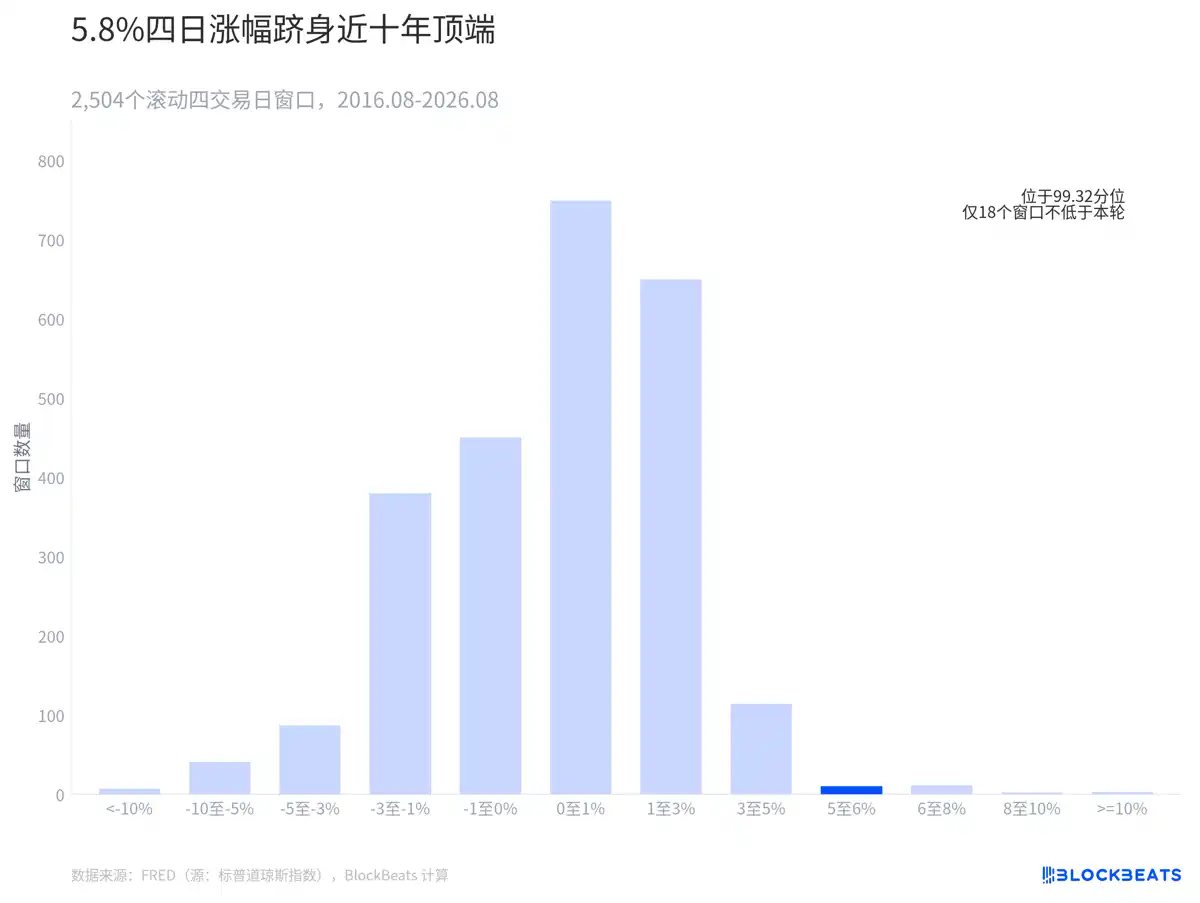
Based on a rolling calculation using nearly a decade of daily S&P 500 closing data from FRED, 2,504 four-day windows were obtained. The current rally of 5.7458% falls at the 99.32nd percentile, already in the sparse area on the far right of the chart.

Calculated from FRED data, including this round, only 18 windows have seen four-day gains at or above this level. Such a four-day magnitude is not common.

How Are Bullishness and Hedging Both Appearing in Options?
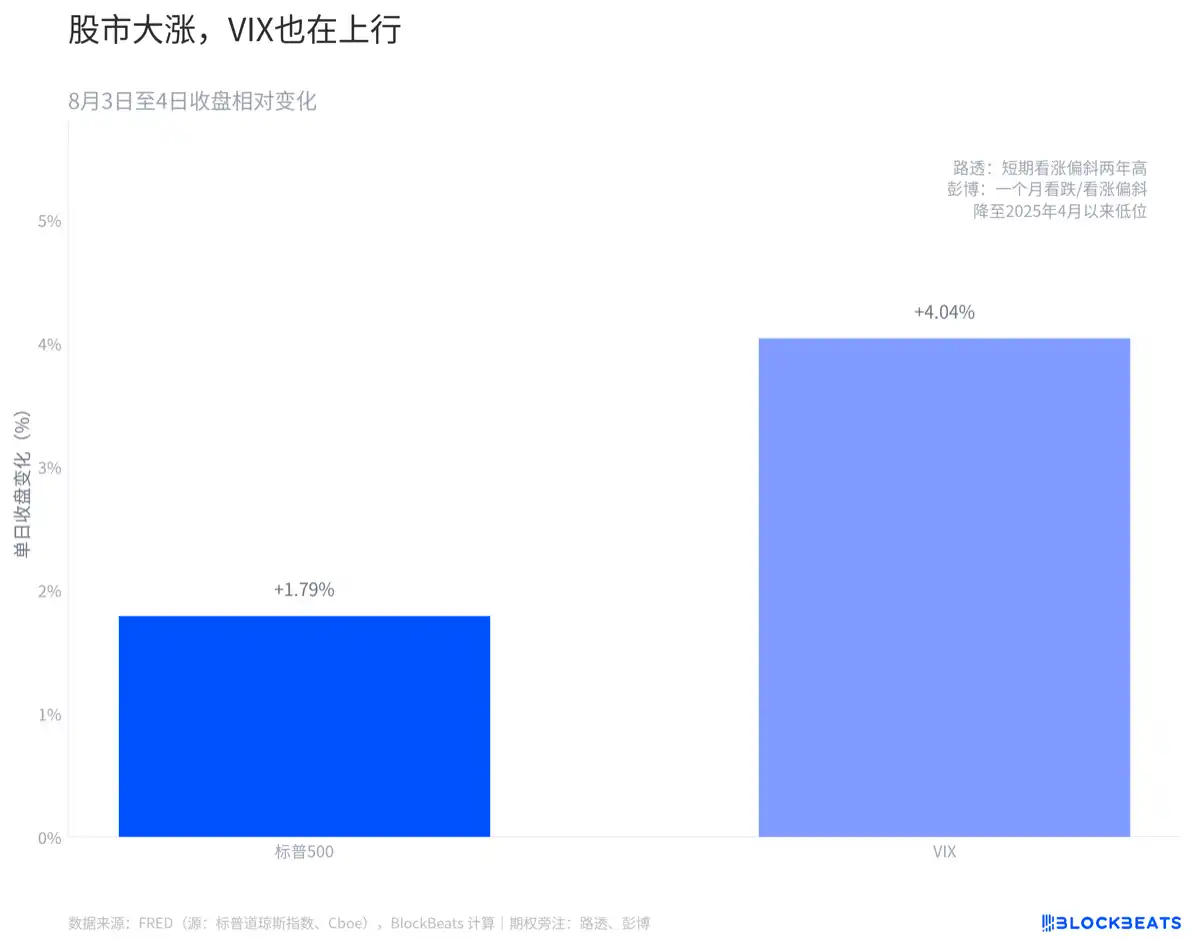
According to closing data for the S&P Dow Jones Indices and the Cboe (Chicago Board Options Exchange) compiled by FRED, the S&P 500 rose 1.79% while the VIX closed up 4.04%. The fact that both prices moved in the same direction indicates that, at least by the end of that day's trading, the market was not fully pricing down expectations for future volatility.

According to Reuters, the skew for near-term call options hit a two-year high. Data from options analytics firm Trade Alert showed the average daily S&P 500 call/put ratio for one month was 0.9, in its most bullish range in at least four years.


Domande pertinenti

QAccording to the article, what two contrasting phenomena occurred simultaneously in the options market during the described rally?

AThe article states that while short-term call option skew hit a two-year high and the call/put ratio indicated strong bullish sentiment (at least a four-year high), the volatility index (VIX) also rose, meaning the market did not completely price down expectations for future volatility. This shows bullishness and a demand for hedging against risk appeared together.

QWhat statistical benchmark is used in the article to show the rarity of the four-day S&P 500 gain mentioned?

AThe article uses a percentile rank based on a rolling calculation of all four-day windows over the past decade of S&P 500 closing data. The specific gain of 5.7458% ranks at the 99.32nd percentile, meaning it is higher than over 99% of similar four-day periods in the last ten years.

QHow does the article visually demonstrate that the four-day price move exceeded the prior three-month range?

AThe article includes a chart (the first image) that plots the four-day upward movement alongside the three-month high-to-low closing price range on the same scale. This visual comparison shows the four-day directional gain crossing the width of the three-month range.

QWhat specific data point from August 4th is given to illustrate that rising stock prices and rising volatility expectations can coincide?

AOn August 4th, the S&P 500 rose by 1.79%, while the VIX (a measure of expected market volatility) also rose, closing up by 4.04%. This simultaneous increase shows that optimism about prices did not suppress expectations for future price swings.

QWhat does the term FOMO refer to in the context of this market rally, and what evidence does the article link to this behavior?

AFOMO refers to 'Fear Of Missing Out,' describing traders chasing the rising market to avoid missing further gains. The article links this behavior to the evidence of the rapid, four-day price increase that quickly raised the entry price for latecomers, as well as the extremely bullish readings in the options market (e.g., high call/put ratios).

Letture associate

Stock Price Soars 655%, Sichuan Brothers Build a 50 Billion Semiconductor IPO

Chengdu Ultra-pure Applied Materials Co., Ltd. ("Ultra-pure Materials"), a Sichuan-based supplier of core semiconductor equipment components, officially listed on the Shenzhen Stock Exchange on August 11. Its share price surged 654.66% to 498 yuan on its debut, giving the company a market capitalization exceeding 50.7 billion yuan. Founded in 2005, the company is a national-level "little giant" specializing in special-coated components and precision optical devices for semiconductor equipment. It is one of the few domestic suppliers capable of providing core parts for 5nm and below process etching tools. According to a Frost & Sullivan report, it held the top market share (5.7%) among local Chinese suppliers of these coated components in 2024. Financially, Ultra-pure Materials has shown rapid growth. Its revenue soared from 169 million yuan in 2023 to 496 million yuan in 2025, with net profit increasing from 65 million to 185 million yuan in the same period. Over 95% of its 2025 revenue came from sales of semiconductor equipment special-coated components. The company has developed dozens of component products covering wafer fabrication, packaging, and silicon wafer manufacturing processes. Major customers include leading domestic semiconductor equipment manufacturers such as NAURA and AMEC, with its top five clients accounting for nearly 90% of revenue in 2025. Its shareholder structure features strategic investors including BYD, AMEC, and State Development & Investment Venture Capital. Post-IPO, Chairman and CEO Chai Jie holds 31.42% of shares, while his brother and Chief Engineer Chai Lin holds 15.46%. The company plans to use raised capital for capacity expansion, R&D center construction, and supplementary working capital. The global market for these high-precision components is dominated by US, European, and Japanese firms. However, driven by domestic equipment substitution policies and improving local technological capabilities, the localization rate in China is projected to rise significantly. Ultra-pure Materials' listing aims to strengthen its position in this expanding market.

marsbit35 min fa

Stock Price Soars 655%, Sichuan Brothers Build a 50 Billion Semiconductor IPO

marsbit35 min fa

Opinion: Altcoins Might Still Have a Chance, but VC-Backed Coins Are Truly Hopeless

Author: Haotian. Through deep discussions with experienced on-chain investors, a consensus has emerged on survival strategies for the current market cycle: the focus has decisively shifted from "narratives and speculation" to "cash flow and tangible validation." Several key principles are outlined: 1) Prioritize assets with genuine value capture. In a bear market, sustainable protocol fees and a proven record of using them for token buybacks, burns, or dividends are essential. Examples include launchpad tokens like $UNI, $PUMP, $PONS, and the notable buyback token $HYPE. 2) Choose only projects with proven Product-Market Fit (PMF) and a complete operational loop. The next cycle's narratives, likely around "real-world asset tokenization" and the "Agentic Economy," will favor practical validation over technical roadmaps. Projects must demonstrate real users, transaction volume, and revenue. Examples such as $ONDO, $VVV, and $VIRTUAL will be evaluated on metrics like Assets Under Management (AUM) and fee generation. 3) Opt for assets with strong, organically developed "consensus." True consensus is market-driven and survives multiple cycles, not manufactured through marketing. Examples include enduring meme coins like $DOGE, $PEPE, $PEOPLE, or established sector leaders like $ZEC and $TAO, which benefit from resilient communities and sustained liquidity. 4) Avoid purely venture-capital (VC)-backed tokens. Unlike general altcoins which may cycle back, VC coins are seen as particularly problematic. Their typical high Fully Diluted Valuation (FDV), low circulating supply, and continuous large unlock schedules often lead to post-unlock sell pressure, especially if the project lacks inherent value capture. This dynamic is a key factor in the current cycle's restrained rallies and deep corrections, discouraging retail participation. *Note: This is a summary of personal discussions. Mentioned tokens are examples only, not investment advice.*

marsbit1 h fa

Opinion: Altcoins Might Still Have a Chance, but VC-Backed Coins Are Truly Hopeless

marsbit1 h fa

Trading

Spot
活动图片