On March 11, the U.S. Bureau of Labor Statistics released the February Consumer Price Index (CPI) report, showing a seasonally adjusted CPI increase of 0.3% month-on-month and a year-on-year rise of 2.4%, unchanged from January; core CPI rose 0.2% month-on-month and 2.5% year-on-year.
Also consistent with the previous month. The energy index rose 0.5% month-on-month, with gasoline prices up 0.8% monthly but still down 5.6% annually; the food index rose 0.4% month-on-month, with an annual increase of 3.1%; the housing component rose 3.0% year-on-year, with only a 0.2% monthly increase, indicating that rent and owner's equivalent rent pressures have eased.
This report was largely in line with market expectations, with inflation stagnating at 2.4% and core indicators showing no significant signs of accelerated decline. The February data collection ended in late February, just before the first U.S.-Israel airstrike on Iran, so it did not fully reflect the subsequent impact of energy price fluctuations. Multiple institutions pointed out that if the slight downward bias from data filling methods during the government shutdown is excluded, actual inflation may be close to 2.8%; conversely, if tariff transmission effects are excluded, it may fall to around 2.2%. However, regardless of the adjustment, inflation remains some distance from the Fed's 2% target, especially with sticky components like housing and services remaining at high levels.
Morgan Stanley noted that the Fed may still cut rates as early as June, but the oil price shock triggered by the Iran conflict could delay this process.
The bank's economists maintain their previous forecast, expecting the Fed to cut rates by 25 basis points each in June and September this year—despite rising energy prices potentially exacerbating inflationary pressures. However, they also believe that the Fed may delay the first rate cut to September or even December, both of which could push the next rate cut to 2027.
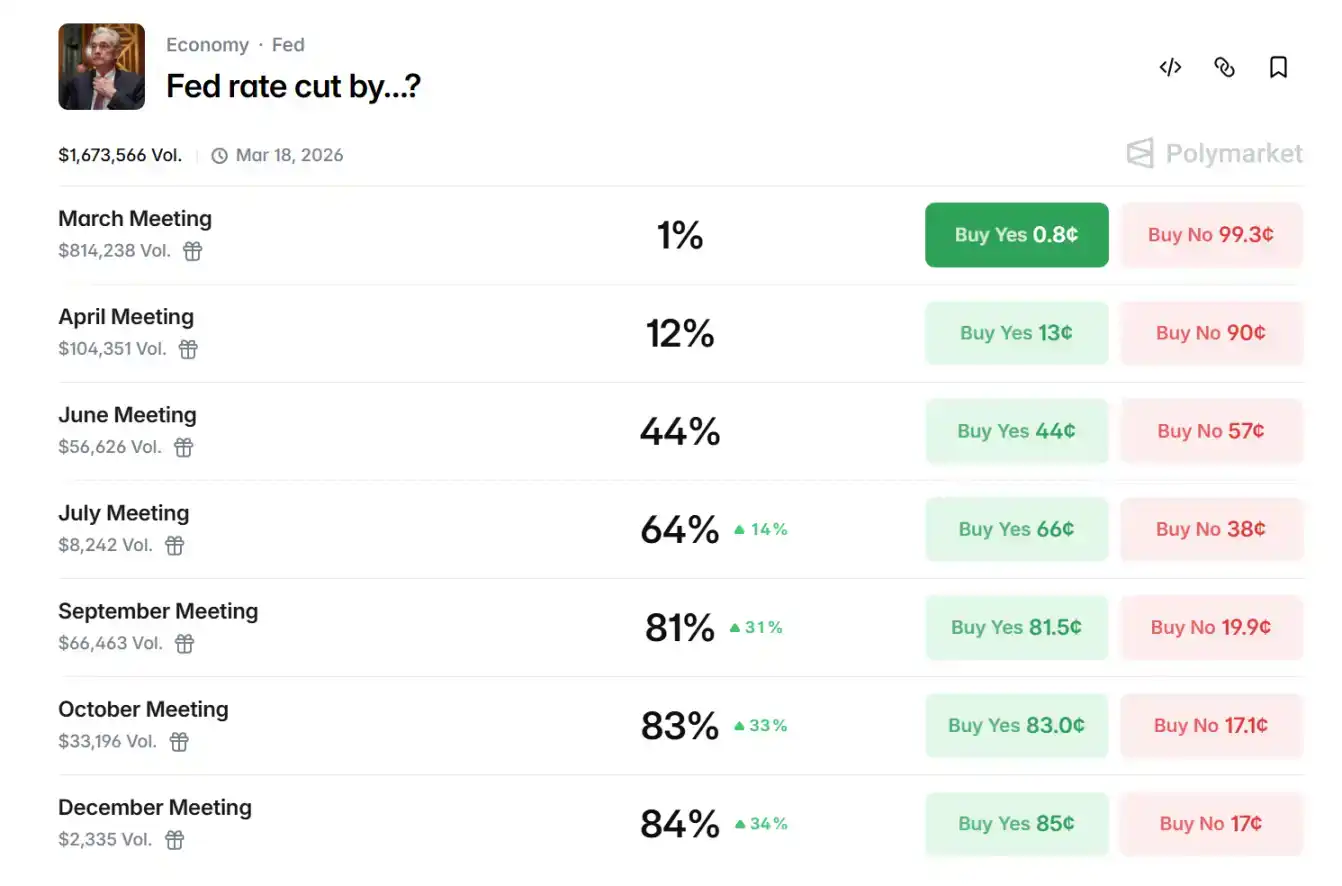
Data from Polymarket shows that the market is currently betting on an 81% probability of a rate cut in September this year, a 64% probability in June, and a 12% probability in April.
Looking ahead to the second half of the year, the Fed's rate cut path remains uncertain. The evolution of the war, inflation trajectory, and employment data will be key variables. If energy prices continue to rise, the Fed may choose to extend the high-interest-rate cycle; conversely, if geopolitical risks ease and core inflation declines, it could open the door for one or two rate cuts. For crypto assets, maintaining high interest rates will continue to suppress risk appetite and valuations, but once a clear signal of rate cuts emerges, market liquidity will recover, providing momentum for Bitcoin's price rise.
Hormuz Strait Becomes Focus, Oil Crisis Imminent
The simultaneous U.S.-Iran military conflict further complicates the policy balance.
On February 28, the U.S. and Israel launched a joint airstrike on Iran. The conflict has lasted nearly two weeks, involving multiple rounds of strikes, energy facility risks, and regional chain reactions. Iran's potential control over the Hormuz Strait has raised global energy supply concerns, with the CPI energy component's month-on-month rebound being an initial reflection.
Iran's Islamic Revolutionary Guard Corps (IRGC) explicitly warned that it would not allow "a single liter of oil" to pass through the Hormuz Strait and claimed that if the blockade continues, oil prices could soar to $200/barrel. The Strait, as a global energy chokepoint, is effectively closed. Satellite data shows most oil tankers are stranded or detouring on both sides of the Strait. Iranian broadcasts warn that any ship attempting to pass will be attacked. The U.S. Navy provides limited escort coverage, leading to a sharp decline in actual traffic.

The Hormuz Strait carries approximately 20 million barrels of crude oil and petroleum products daily, accounting for about 20% of global oil consumption and one-fifth of global seaborne liquefied natural gas (LNG), mainly from exports by Saudi Arabia, Iraq, the UAE, Kuwait, and Iran itself, with destinations primarily in Asia (led by China, India, Japan, and South Korea). Once this bottleneck is cut off, a structural gap in global supply immediately emerges.
From a macroeconomic transmission mechanism perspective, the U.S.-Iran conflict systematically constrains the Fed's rate cut path through the core channel of oil prices. First, the conflict directly impacts global oil supply security. The Hormuz Strait handles about 21% of global seaborne oil trade. Any shipping disruption risk or military threats will immediately push up risk premiums, leading to significant upward pressure on international oil prices. Iran has threatened to maintain the blockade if the conflict persists. Analysts warn that prices could test the $120-150/barrel range in the short term, or even higher; in the long term, if the Strait remains closed for weeks, it could recreate a 1970s-style energy shock,叠加 cost-push inflation.
Historical cases clearly support this logic: During the 1990 Gulf War, soaring oil prices led the Fed to pause its easing cycle; after the 2011 Middle East turmoil and the 2022 Russia-Ukraine conflict, energy price shocks forced the Fed to maintain a tightening stance or delay easing. Although the current U.S.-Iran situation has not yet evolved into a full-blown energy crisis, its persistent disturbance to oil prices is enough to make the FOMC more conservative in assessing financial conditions and inflation prospects, avoiding any easing signals that could amplify risks.
Market data shows that on March 12, Brent crude futures returned above the $100 mark, rising nearly 9% intraday. WTI crude oil is currently at $93.52, up over 8% intraday.
What’s Next for BTC
Since October 2025, Glassnode on-chain data shows that the 7-day exponential moving average for short-term holders has remained below 1, currently at 0.985, confirming that recent buyers are selling at a loss—a typical characteristic of a bear market phase.
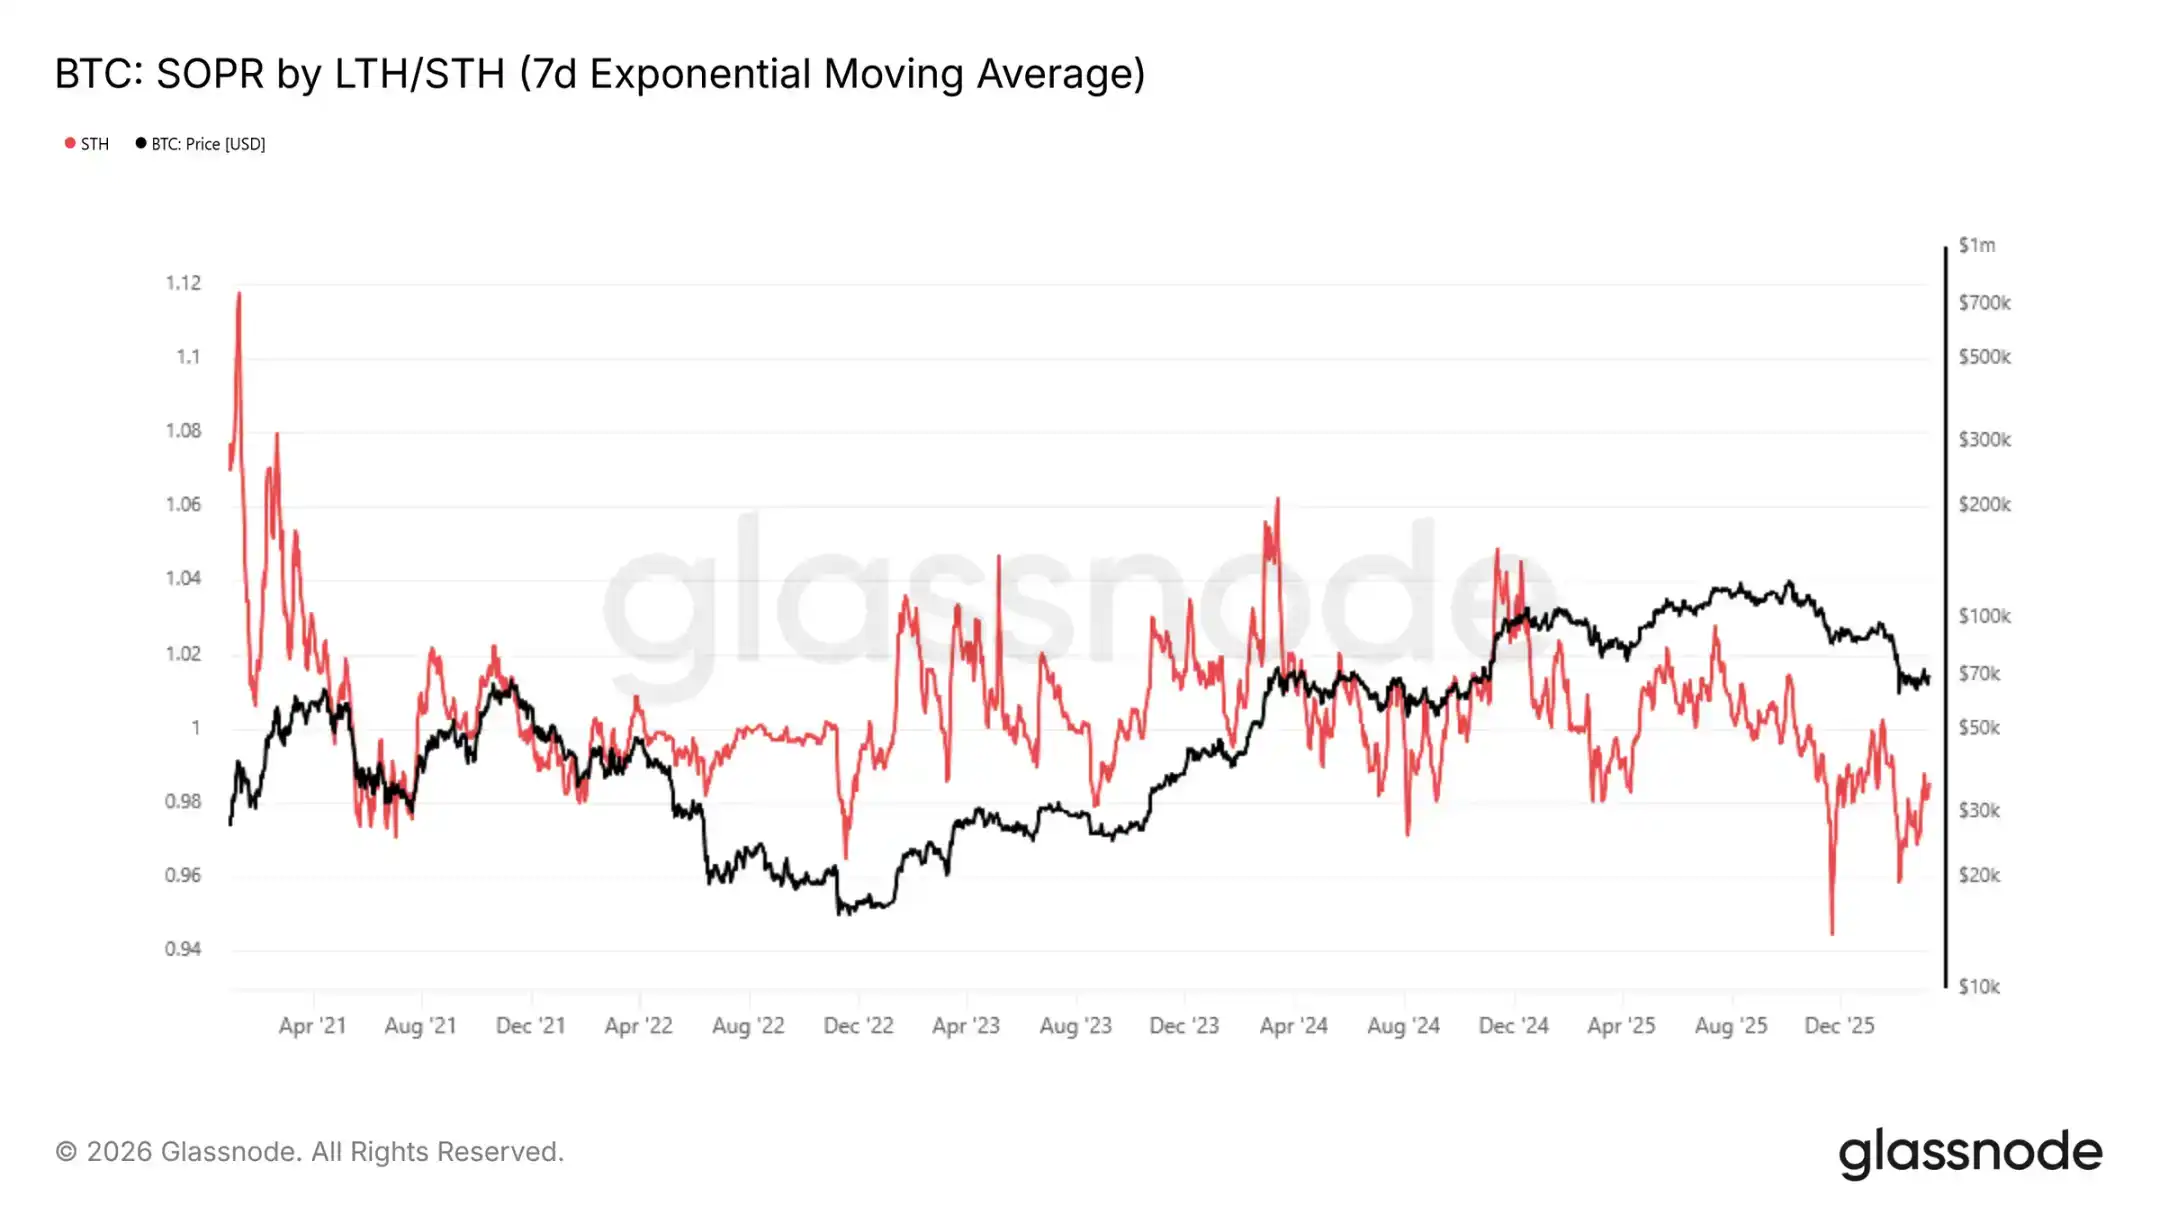
Prices continue to be constrained between the realized price of $54,400 and the true market average price of $78,400. Before decisively stabilizing above $70,000, returns show a明显的 negative skew.
Wintermute stated that macro factors are currently dominating everything, but cryptocurrencies showed resilience last week while stocks, bonds, and even gold fell. The high correlation between cryptocurrencies and stocks in recent quarters is beginning to show cracks. The most likely explanation is that marginal sellers are scarce. The leverage scale in the cryptocurrency market is about $60 billion, roughly half of the peak level. In contrast, speculative positions in gold have accumulated significantly. When all assets fall, cryptocurrencies need to absorb much less forced selling pressure.
From a 12-18 month cycle perspective, the current price level is quite attractive, although the range where BTC buyers are willing to enter extends from the current price down to the low $50,000s. The market still has room to fall further, but most of the deleveraging phase seems to be over. Currently, cryptocurrencies are holding their ground and narrowing the performance gap with other risk assets. Whether this trend can continue once trading volume recovers remains to be seen. Next week's FOMC meeting is a near-term catalyst.
For precious metals, according to Bitget market data, gold is currently oscillating around $5,153, while silver is hovering around $85. The U.S. dollar index (DXY) is currently fluctuating in the 99.35-99.48 range. For U.S. bonds, the 10-year Treasury yield is about 4.21%-4.25%, with a slight intraday increase.
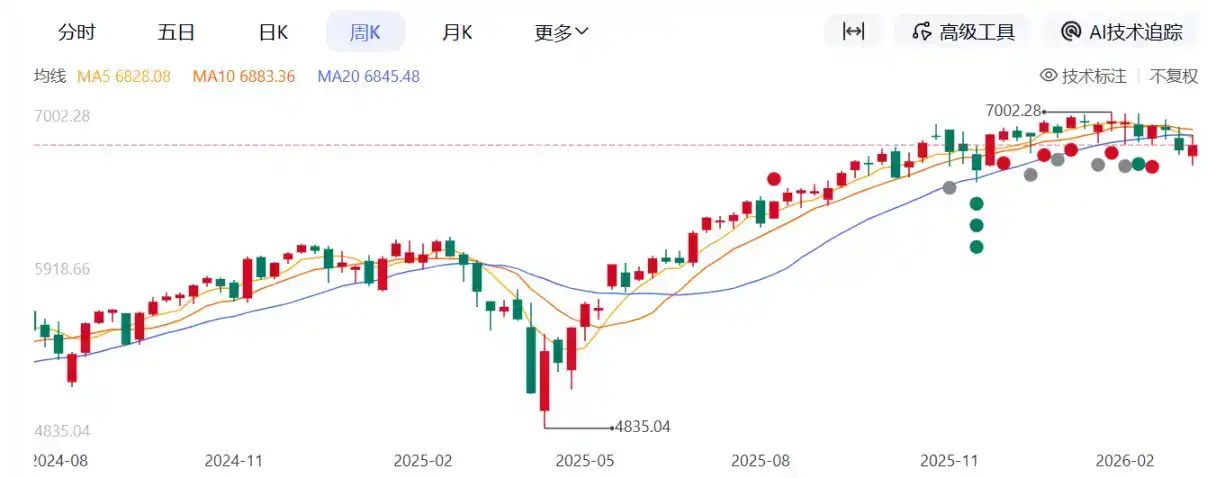
The S&P 500 index is still correcting, currently at 6,775.8. The Nasdaq index is up slightly, currently at 22,716.