Natural Gas's 5-hour candlestick chart has just confirmed a double bottom pattern, with the short-term uptrend breaking through the Ichimoku cloud and now approaching the key resistance zone of $2.800-$2.830. However, what bulls fear most is a potential "bull trap" lying ahead. While structural reversal signals are evident, the primary trend remains bearish, requiring precise entry and stop-loss points.
Bullish Reversal or a Trap?
A Quick Look at the Situation:
Natural Gas has broken above both the SMA(50) and the upper edge of the Ichimoku cloud, indicating a strengthening short-term trend.
The SuperTrend indicator has turned green, establishing a pullback support level at $2.667.
However, the price remains below the long-term SMA(200) at $2.931, meaning the primary bearish trend is not broken.
The MFI reading is exceptionally high at 87.46, indicating extreme overbought conditions and suggesting potential profit-taking pressure at any moment.
Core Risk:
The $2.800~$2.830 zone is a high-risk area for a "bull trap" during this upward surge. This area coincides with the Fibonacci 23.6% retracement level and previous highs. A failure to break through followed by a pullback could form a classic bull trap signal.
The ADX reading is only 19.63, indicating limited overall trend strength and suggesting continued tug-of-war between bulls and bears.
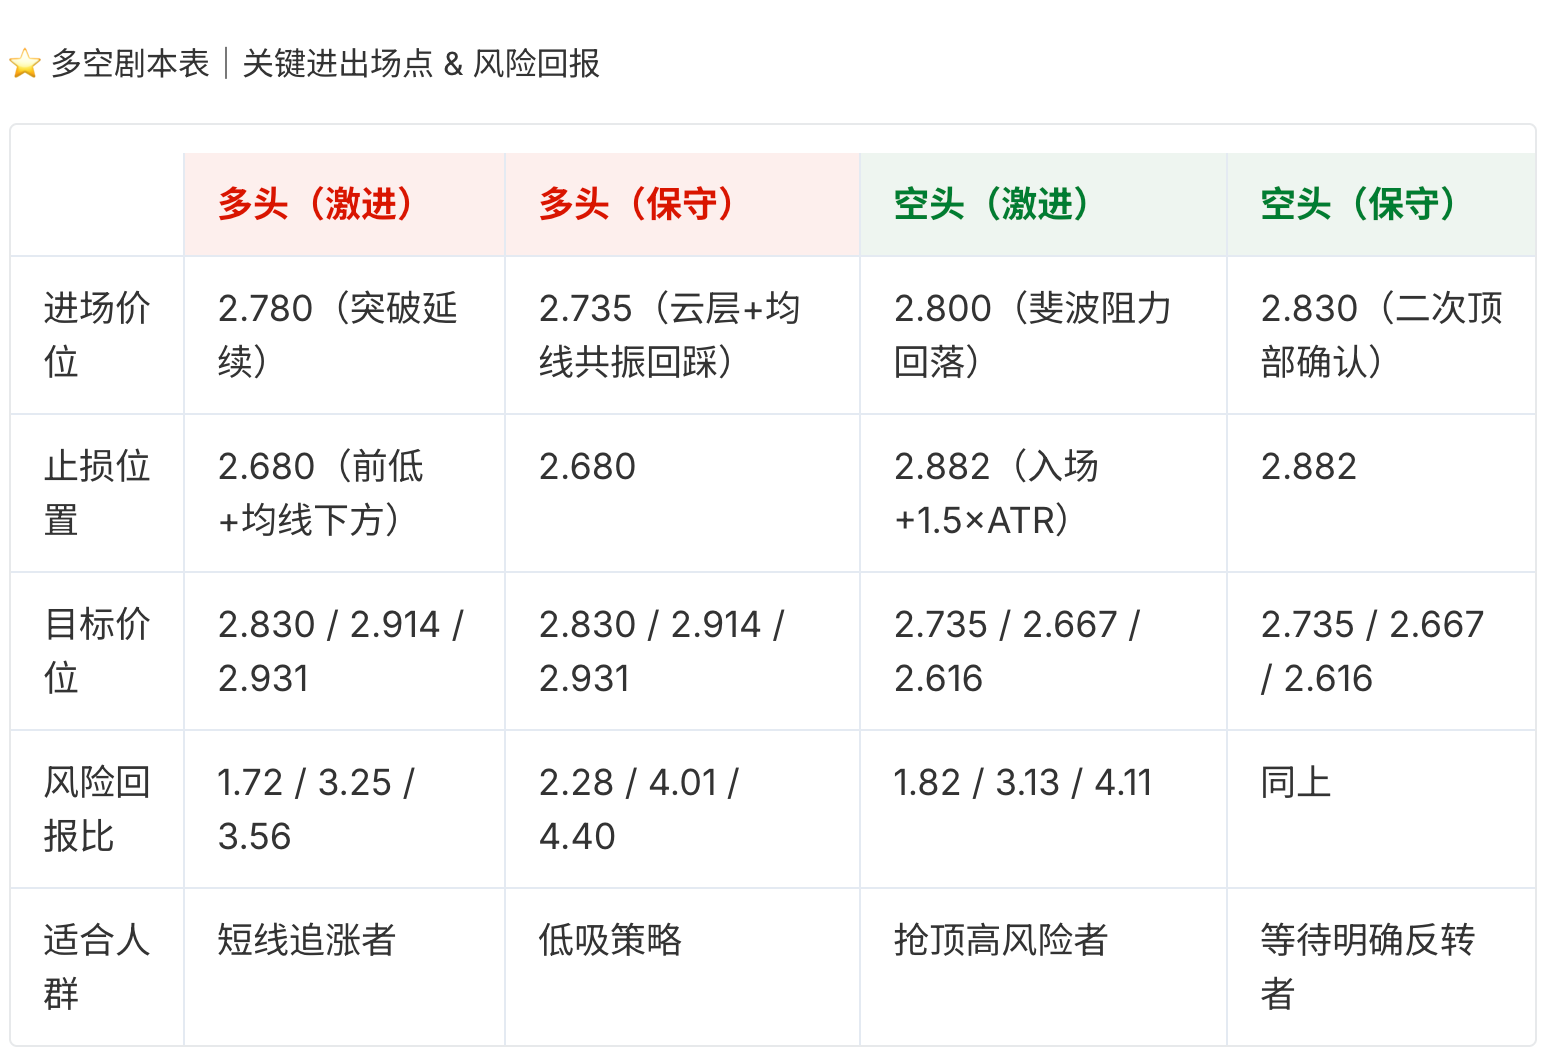
Note:
For long positions, it is recommended to move the stop-loss to the entry price (risk-free operation) once the first target is reached, and to use a trailing stop-loss after the second target is hit.
For short positions, monitor if the MFI falls significantly from the overbought zone as a potential signal for a top formation.
Technical Structure and Signal Breakdown
Double Bottom Pattern at $2.616: 100% complete, with higher lows supporting the uptrend.
Fibonacci 23.6% Retracement at $2.800: A short-term structural resistance level, difficult for bulls to overcome.
Volume Analysis: Volume has gradually increased during the rise, suggesting buying interest from major funds.
Risk of Churn: Repeated consolidation within the $2.735-$2.800 range could easily form a shakeout zone. Avoid chasing rallies or selling into weakness.
Risk and Operation Summary
Failure Criteria: The bullish structure is invalidated if the price falls below $2.667. For bears, a breach above $2.830 requires switching to defensive tactics; a breakout could target $2.931.
Range to Monitor: The $2.735-$2.800 zone is a "no-trade" consolidation area. Wait for a clear breakout or pullback before taking action.
Key Educational Point: Extreme MFI readings often precede sharp short-term volatility. However, a single indicator should not be used in isolation; always combine it with support/resistance zones and strictly control position size.