Bitcoin is breaking out of a classic cup-and-handle pattern at the $64,742 level on August 6, as spot ETFs have already posted their best week since May, and a cycle bottom signal flashes on net capital flows.
$BTC Breaks Cup and Handle with RSI Above 50
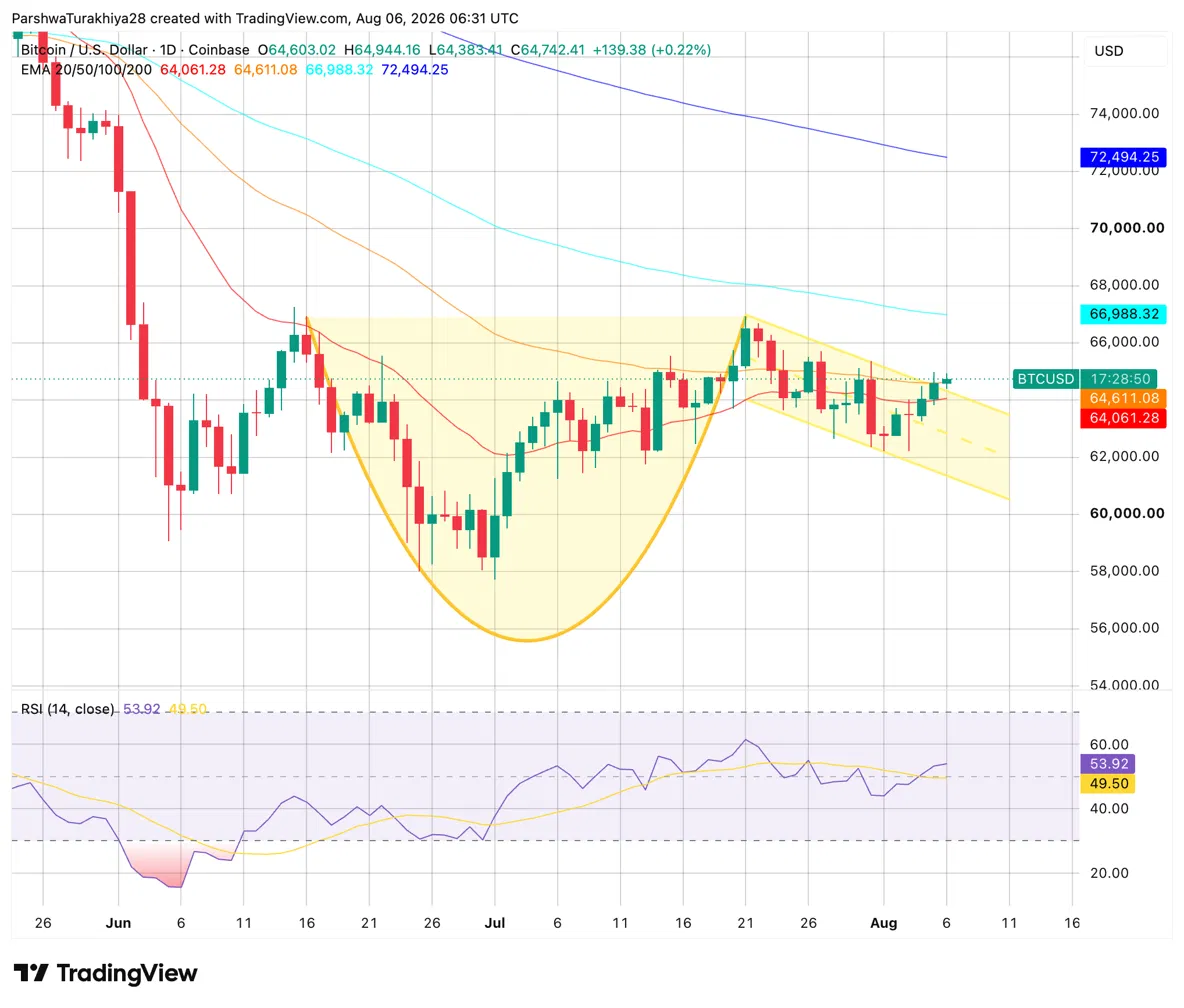
The daily chart shows $BTC completing a 'cup and handle' pattern formed between the June lows around $57,700 and the August recovery. The cup base formed in June and early July, the price recovered to retest the neckline around $65,000, was then pushed back forming the handle between $62,000 and $64,500, and is now breaking above the neckline. Today's session opened at $64,603, rose to $64,944, and is holding at $64,742.
The RSI at 53.92 is above the neutral 50 line for the first time since July's highs, confirming momentum has shifted in favor of buyers. The 20-day EMA at $64,061 and the 50-day at $64,611 are both clustered just below the current price and have been reclaimed.
Related: Zcash Price Forecast for August 2026: ZEC Presses for Triangle Breakout as DCG Buys Mining Site in Nebraska
The 100-day EMA at $66,988 is the next target above, while the 200-day at $72,494 represents the long-term ceiling. Horizontal support at $62,000 is the level that must hold on any pullback to preserve the cup-and-handle structure.
$BTC Support and Resistance Levels for August 6, 2026
| Type | Price | Level |
| Resistance | $66,988 | 100-day EMA, next major target |
| Resistance | $72,494 | 200-day EMA, long-term ceiling |
| Support | $64,611 | 50-day EMA |
| Support | $64,061 | 20-day EMA |
| Support | $62,000 | Cup and Handle Neckline, must hold |
| Support | $57,000 | Cup Base, last major floor |
Spot ETF Flows Exceed $626M, Two Days Still Remain This Week
Spot Bitcoin ETFs recorded net inflows of $626M over the first three sessions of the week ending August 5, with Wednesday and Thursday yet to close, according to SoSoValue. This already makes it the highest weekly sum since early May, when the week of May 8 brought $622.75M. If the pace holds in the remaining sessions, it will be the best ETF week in roughly three months.
August 5 alone brought $244.42M — the largest day of the week so far. BlackRock's IBIT led with $196.83M, followed by ARK and 21Shares' ARKB with $37.63M, Fidelity's FBTC with $11.28M, and Bitwise's BITB with $10.56M. VanEck's HODL was the only product to record an outflow of $14.67M. Cumulative net inflows across all products now stand at $51.95B with total net assets of $79.21B.
The reversal from the prior week is sharp. The week beginning July 31 recorded a net outflow of $61.53M, driven by one poor day on July 31 itself. The three days since have literally erased that in a single session.
Glassnode: Bitcoin, Unresponsive to Everything
In its latest report, Glassnode describes Bitcoin as a market where bottom signals are building, but the final piece is still missing. On-chain data shows price compression reaching levels that have historically preceded major rallies. The problem is, past recoveries had institutional buyers actively absorbing supply in the background. That is not the case yet: spot ETFs took in just 65,800 $BTC in June — the worst month on record.
The options market reinforces the picture. Traders are paying the lowest amount ever for upside — around 23% implied volatility, while demand for downside protection is also low. Simply put, no one is pricing in a big move in either direction. In Glassnode's view, such quietness typically ends loudly, and when the move happens, most people will not be ready for it and will be chasing price higher rather than already positioned.
| Metric | Reading | What It Means |
| One-Month Realized Volatility | Near multi-year lows | Compressions this deep have nearly always resolved upwards |
| Upside Implied Volatility | ~23%, lowest ever | No one is paying for upside; The crowd will chase late |
| June ETF Net Flows | Took in just 65,800 $BTC | Worst month on record; Demand engine not fully recovered |
| Seller Exhaustion Constant | Inside lower zone | Still a third higher than every prior bear cycle level |
| Coldcard-Related $BTC Movement | ~119,000 $BTC moved | Price barely reacted; No live bids or offers under the surface |
Bitcoin Net Capital Flows Signal Cycle Bottom
BITCOIN MARKET BOTTOM
— Ali Charts (@alicharts) August 5, 2026
The last bullish divergence between the $BTC price and Net Capital Flows marked the cycle bottom.
What followed was a bull run from $15,000 to $126,000.
The same signal is back. https://t.co/SxJ0w635qE pic.twitter.com/suckGSld8s
Analyst Ali Martinez noted on X that Bitcoin's net capital flow is showing the same bullish divergence from price that marked the cycle bottom ahead of the rally from $15,000 to $126,000.
The signal occurs when capital flows turn positive while price remains depressed, and has historically preceded significant recoveries. Ali Charts explicitly noted: the same pattern is back.
Bitcoin Price Forecast: Upside and Downside Targets
Bull Case, Target: $66,988 (100-day EMA)
The cup-and-handle breakout holds above the $64,000 neckline on a daily close, with the RSI holding above 50 confirming the momentum shift. Weekly ETF inflows continuing through Wednesday and Thursday lift the week's total above $700M, indicating a real return of institutional demand. Short liquidations continue to fuel the move, and price advances towards the 100-day EMA at $66,988, fitting Glassnode's historical observation that volatility compressions this deep nearly always resolve to the upside.
Bear Case, Risk Level: $62,000 (Handle Support)
The $64,000–$64,500 neckline fails to hold on a daily close, invalidating the cup and handle. ETF inflows slow in the week's remaining sessions, and Glassnode's warning about the missing demand engine proves prescient as institutional flows fail to materialize. Price pulls back towards handle support at $62,000, where buyers must step in to prevent a deeper retest of the cup base around $57,000.
end-content