History Repeating? Dogecoin Retests Bull Market Launchpad! DOGE Set for 600% Surge by 2026

金色财经Pubblicato 2025-12-12Pubblicato ultima volta 2025-12-12

Introduzione

Dogecoin (DOGE) has recently declined by 5.5%, testing a key support zone around $0.136–$0.138. Analysts suggest that if this level holds, DOGE could be poised for a significant short-to-medium-term rebound. The cryptocurrency is currently retesting a long-term ascending trendline that has historically preceded major rallies—past instances resulted in gains of 87%, 210%, and even 442% over 8 to 14 weeks. Technical indicators are turning bullish, with a daily MACD bullish crossover signaling potential upward momentum. Some traders also identify a falling wedge pattern on the charts, suggesting a possible breakout toward $0.20 (a 60% increase) or even a push to $0.30 (up 115%) if key resistance levels are breached. With DOGE trading around $0.137 at the time of writing, market participants are closely watching this critical support area. A successful hold could pave the way for a potential 610% mid-term rally toward the $1 mark.

As the early-week upward momentum slowed, Dogecoin (DOGE) fell 5.5% intraday, retreating near recent lows. Some analytical views suggest that if the price can stabilize at this level, DOGE may see a significant short-to-medium-term rebound.

Key Support Tested Again: Can the Path to $1 Restart?

On Thursday, DOGE followed the broader market's pullback to the $0.136–0.138 range. Since the Q4 correction, its price has fallen about 50% from its high and has been oscillating between $0.130–0.155 in recent weeks.

Analyst Trader Tardigrade pointed out that DOGE is currently testing a key upward trendline extending from 2022, a level that has historically served as the starting point for subsequent significant rallies:

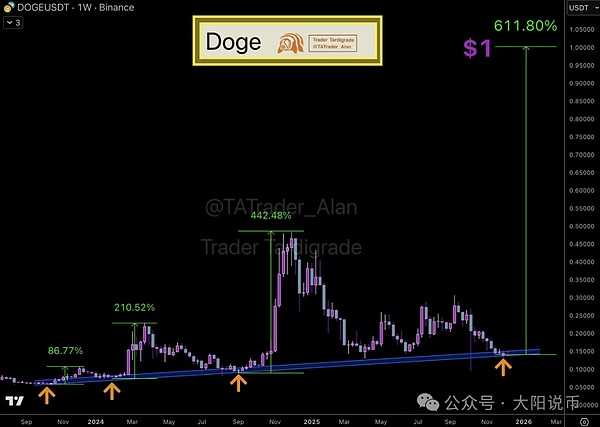
After the first test, DOGE rose 87% in 8 weeks;

After the second test, it gained over 210% in 10 weeks;

Following the test in Q3 2024, DOGE surged 442% in 14 weeks, hitting the annual high of $0.48;

If this retest successfully holds, the analyst believes DOGE could move toward the $1 mark, with a potential gain of up to 610% in the medium term.

Technical Indicators Warm Up, Short-Term Rebound Signals Emerge

The trader also observed that DOGE's daily MACD has formed a bullish crossover, indicating a potential trend reversal from decline to rise. Similar signals led to new阶段性 highs in Q2 and Q3 of this year.

Other market observers have provided structural reasons for short-term optimism:

Chart patterns suggest DOGE may be forming a "falling wedge" bullish reversal structure since last October. A breakout above the resistance could target $0.20 (a potential 60% gain). Additionally, the price has once again touched a historical demand zone on the weekly chart. If support holds in this area, a rebound toward $0.30 (a ~115% gain) is possible.

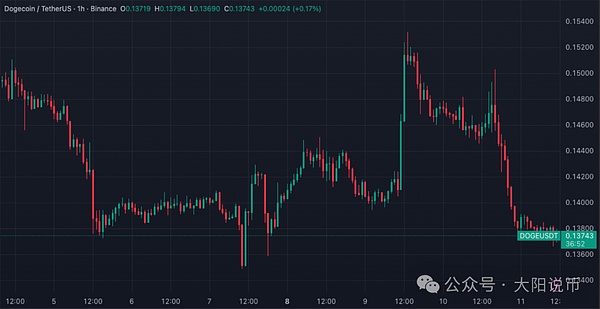
At the time of writing, DOGE is trading at $0.137, down 8% for the week. The market is closely watching the performance of this critical support zone, which could determine whether DOGE can initiate another strong rally.

Domande pertinenti

QWhat is the current price range of Dogecoin (DOGE) as mentioned in the article?

AThe article states that DOGE is trading in the range of $0.130–$0.155, with a specific price of $0.137 at the time of writing.

QAccording to analyst Trader Tardigrade, what is the significance of the key ascending trendline for DOGE?

AThe analyst states that this trendline, extending from 2022, has historically been a starting point for significant price rallies. Past tests of this line were followed by gains of 87%, over 210%, and 442% in subsequent weeks.

QWhat technical indicator is mentioned as showing a bullish signal for DOGE?

AThe article mentions that the daily MACD indicator has formed a bullish crossover, suggesting a potential shift from a downward to an upward trend.

QWhat is the potential medium-term price target for DOGE if the current support holds, according to the analysis?

AThe analysis suggests that if the current support level holds, DOGE could potentially advance towards $1, representing a potential gain of 610%.

QWhat two chart patterns are cited by other market observers as reasons for short-term bullishness?

AOther observers cite a potential bullish 'falling wedge' reversal pattern formation and the price touching a historical demand zone on the weekly chart as reasons for short-term optimism.

Letture associate

Trading

Spot
Futures
活动图片