Dogecoin Liquidation Exceeds $1 Billion! The Largest Liquidation Wave in History is Coming, How Long Can DOGE Retail Investors Hold On?

金色财经Pubblicato 2025-12-09Pubblicato ultima volta 2025-12-09

Introduzione

Dogecoin (DOGE) rebounded after hitting $0.140 against the US dollar, though it now faces resistance near $0.1450. Earlier, DOGE recovered from the $0.1350 level, mirroring movements in Bitcoin and Ethereum, and broke through resistance levels at $0.1380 and $0.140. It is currently trading above the 100-hour simple moving average, with a rising trendline forming support around $0.1405 on the hourly chart. If the upward momentum continues, DOGE may test the $0.1450 resistance, which aligns with the 50% Fibonacci retracement level of the recent decline from $0.1532 to $0.1351. Further resistance lies near $0.1490, with a potential push toward $0.1530. A sustained break above this level could open the path to $0.1620 and $0.170, with a key mid-term resistance at $0.1720. However, failure to break above $0.1450 may lead to a pullback. Initial support is at $0.1400 and the trendline, followed by $0.1380. The major support remains at $0.1350; a break below could trigger a decline toward $0.1265 or even $0.1250. Technical indicators show mixed signals: the hourly MACD is in the bullish zone but losing momentum, while the RSI remains below 50, indicating weak short-term momentum.

Dogecoin's exchange rate against the US dollar rebounded after hitting the $0.140 mark, but is currently encountering resistance near $0.1450, facing further upward pressure.

Previously, DOGE gradually recovered from the $0.1350 level, moving in line with Bitcoin and Ethereum, and successively broke through the $0.1380 and $0.140 resistance levels. The price has also moved above $0.1410 and the 100-hour simple moving average. From a technical chart perspective, an upward trend line with support at $0.1405 has formed on the hourly chart of DOGE/USD.

If the price can continue to rebound, it will first challenge the $0.1450 resistance in the short term, a level that also corresponds to the 50% Fibonacci retracement level of the decline from the $0.1532 high to the $0.1351 low. Stronger resistance is located near $0.1490. A break above this could lead to a further test of $0.1530. A sustained close above this level could pave the way for moves toward the $0.1620 and $0.170 areas, with a key mid-term resistance level to watch at $0.1720.

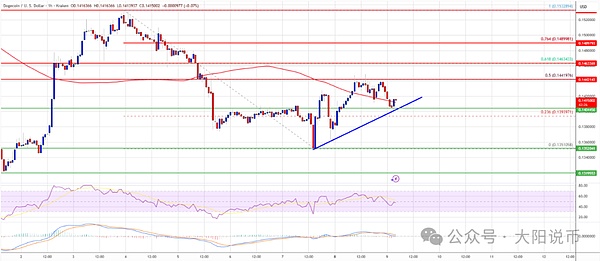
Conversely, if it fails to break through $0.1450 effectively, DOGE could fall again. Initial support is located at $0.1400 and near the trend line, followed by $0.1380. The crucial support level remains at $0.1350. A break below this could lead to a further decline toward $0.1265 or even near $0.1250.

Technical indicators:

The hourly MACD is in the bullish zone, but its momentum is showing signs of weakening; the hourly RSI is currently below the 50 level, reflecting weak short-term momentum.

Key Support: $0.1400, $0.1350

Key Resistance: $0.1450, $0.1530

Domande pertinenti

QWhat is the current resistance level for Dogecoin after its recent rebound?

AThe current resistance level for Dogecoin is near $0.1450 after its rebound from the $0.140 support level.

QWhat key support levels should be monitored if Dogecoin fails to break above $0.1450?

AIf Dogecoin fails to break above $0.1450, key support levels to watch are $0.1400 (and the trend line), $0.1380, and the crucial $0.1350 level. A break below $0.1350 could lead to $0.1265 or even $0.1250.

QWhat technical indicators are signaling weakness for Dogecoin in the short term?

AThe hourly MACD, while in the bullish zone, is showing signs of losing momentum. The hourly RSI is also below the 50 level, indicating weak momentum in the short term.

QWhat are the potential price targets for Dogecoin if it manages to break and hold above the $0.1530 resistance?

AIf Dogecoin breaks and sustains above the $0.1530 resistance, the subsequent price targets could be the $0.1620 and $0.1700 zones, with a key mid-term resistance level at $0.1720.

QWhat significant Fibonacci retracement level coincides with the $0.1450 resistance?

AThe $0.1450 resistance level coincides with the 50% Fibonacci retracement level of the downward move from the $0.1532 high to the $0.1351 low.

Letture associate

The Economist: The Real Threat of Cryptocurrency to Traditional Banks

The Economist article "The Real Threat Cryptocurrency Poses to Traditional Banks" examines the escalating tensions between the traditional banking sector and the crypto industry. Despite both benefiting from a more favorable regulatory environment, especially following the passage of the GENIUS Act which provided a legal framework for stablecoins, a significant power shift is occurring. Banks' most immediate concern is regulatory arbitrage in stablecoins. Although the GENIUS Act prohibits issuers from paying interest to prevent deposit outflows, companies like Circle circumvent this by sharing revenue with exchanges, which then pay "rewards" to users. Banks are demanding this loophole be closed. Furthermore, crypto firms are breaking into the core of the financial system. In a landmark move, U.S. regulators granted national bank trust charters to five digital asset firms, including Circle and Ripple, allowing them to provide custody services nationwide. The collective impact of these developments poses a profound threat. The core of the banks' dilemma is their waning political influence. Crypto has firmly entrenched itself within the right-wing, anti-establishment political sphere, amassing a massive war chest for lobbying. Banks are no longer the most powerful financial voice in the Republican party. In a ironic twist, they now sometimes find themselves allied with Democratic senators and left-leaning groups who share concerns over stablecoin risks, proving that political alliances in this battle are increasingly unpredictable.

深潮8 min fa

The Economist: The Real Threat of Cryptocurrency to Traditional Banks

深潮8 min fa

Trading

Spot
Futures
活动图片