After the close on August 4th, Wall Street witnessed an acceleration that was hard to ignore. The S&P 500 index had rallied 5.8% cumulatively over the four trading days ending that day. According to Reuters, the options market also showed the most bullish skew in at least four years.
The rally itself is not FOMO. What truly makes this round of market action different is how fast prices moved upward and what price the options market simultaneously placed on both upside and downside risks. On August 4th, closing data compiled by FRED also showed the stock market continuing to climb higher, while the VIX volatility index, which measures expected volatility, also closed higher. Optimism did not push volatility down alongside it.
Why Four Days Can Seem Longer Than Three Months
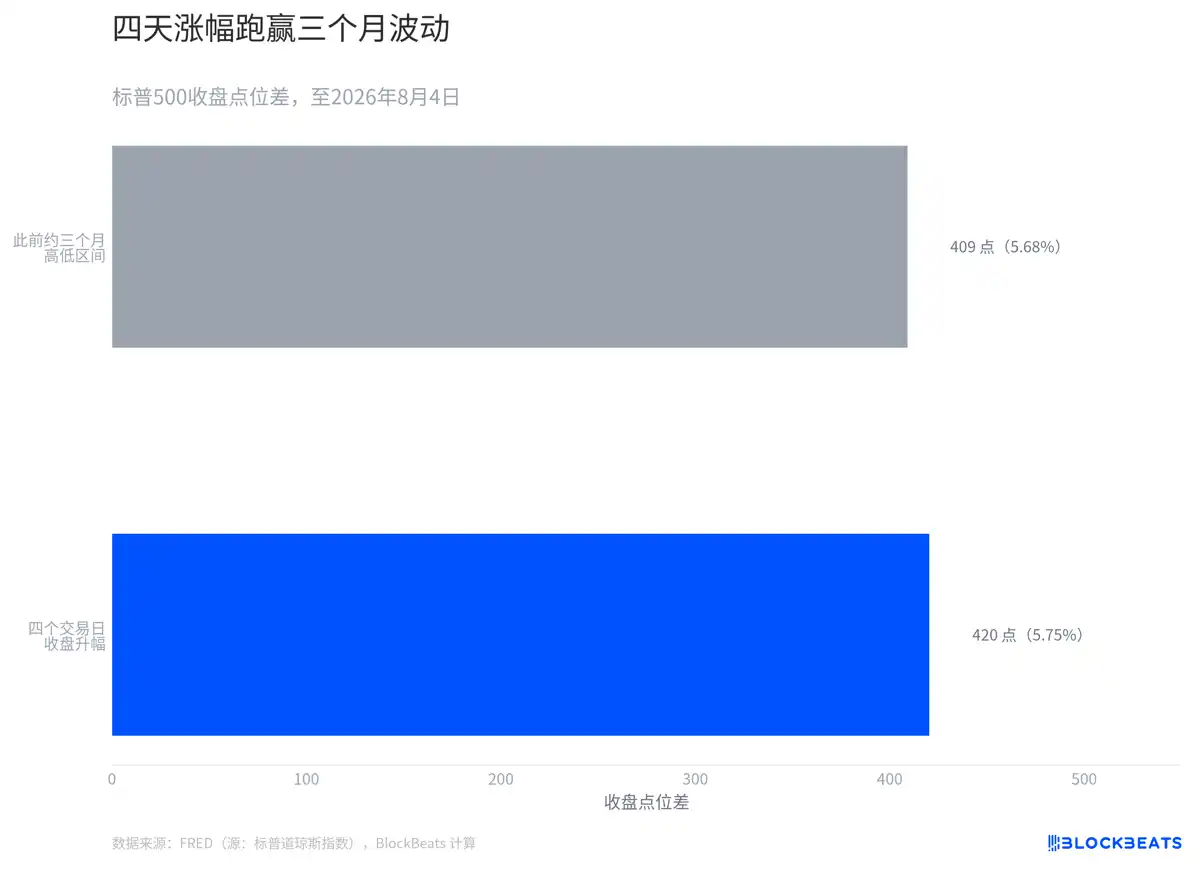
According to the S&P Dow Jones Indices daily closing data compiled by FRED, the economic database of the Federal Reserve Bank of St. Louis, this four-day upward move, measured by the same closing price metric, has slightly exceeded the point difference between the highest and lowest closing prices over the preceding approximately three months.
Placing these two changes side by side is not to equate the four-day return with the three-month high-low range as the same metric. The former indicates direction, the latter a range. They are placed on the same scale to visualize a shift in trading tempo: the closing price fluctuation band formed over months was surpassed by a one-way move over just four trading days.
The price path itself cannot prove the psychology of every participant. What it does illustrate is that four consecutive days of closing price increases rapidly raised the entry price for those joining later. Reuters characterized traders chasing into this rally as FOMO. The speed shown in the chart is precisely the aspect that allows this characterization to be tested against the price series.
How Rare Is This in the Past Decade?
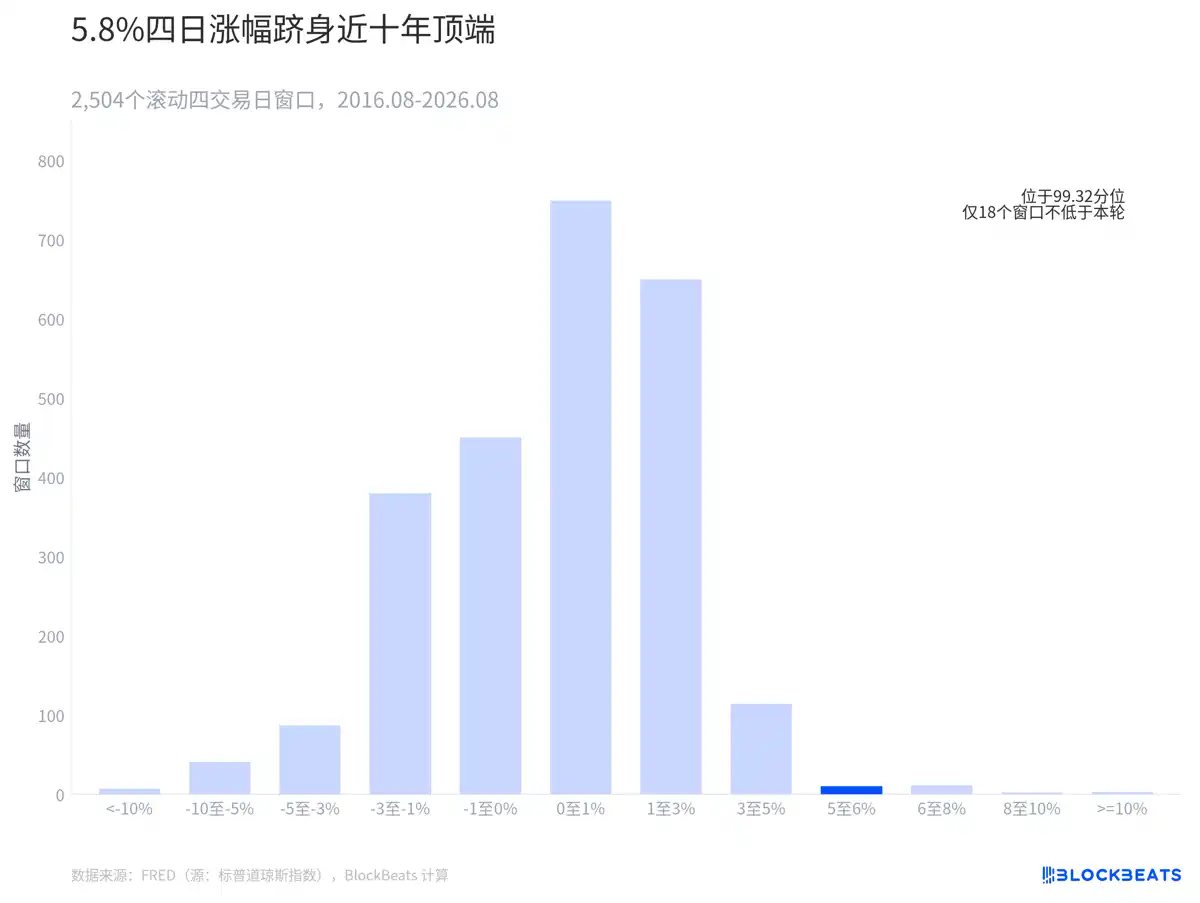
Based on a rolling calculation using nearly a decade of daily S&P 500 closing data from FRED, 2,504 four-day windows were obtained. The current rally of 5.7458% falls at the 99.32nd percentile, already in the sparse area on the far right of the chart.
Calculated from FRED data, including this round, only 18 windows have seen four-day gains at or above this level. Such a four-day magnitude is not common.
How Are Bullishness and Hedging Both Appearing in Options?
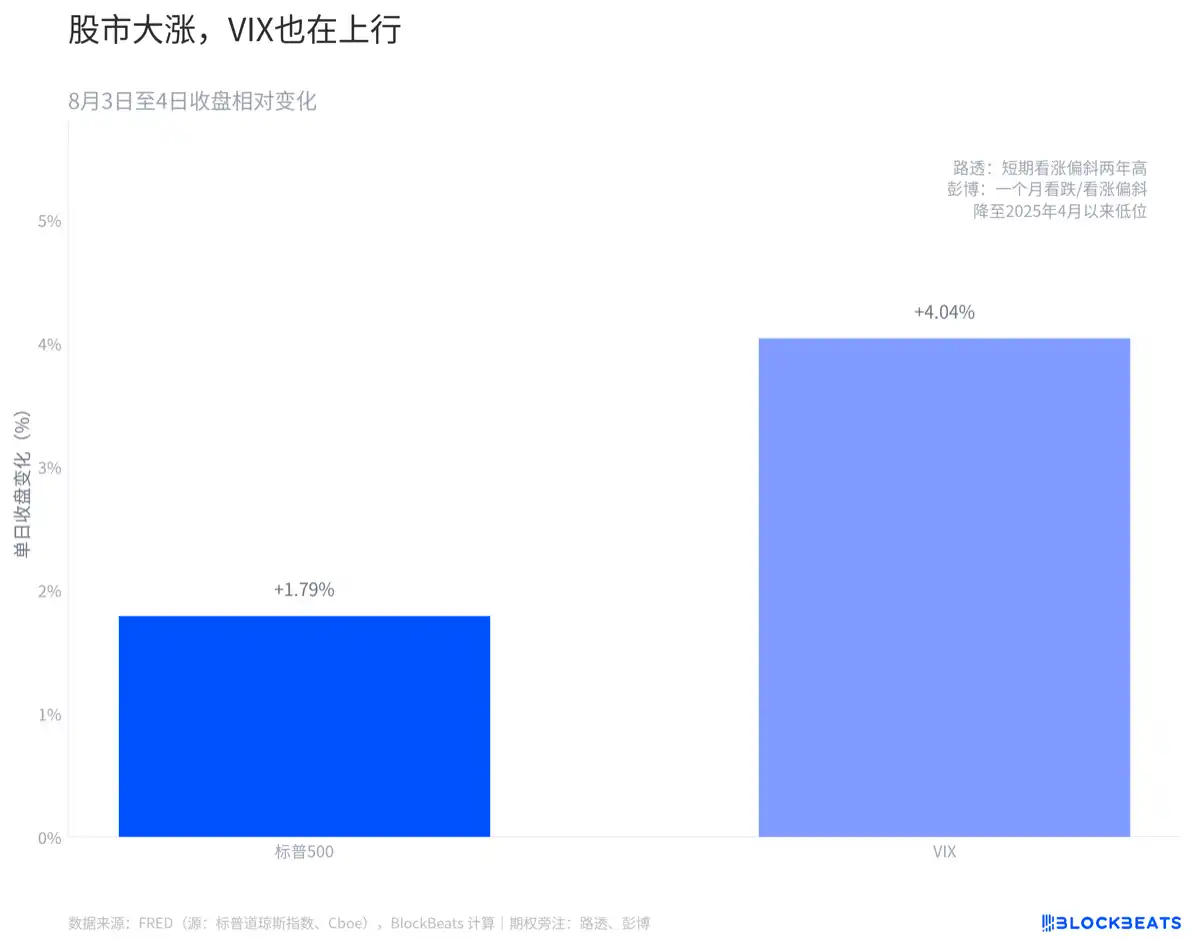
According to closing data for the S&P Dow Jones Indices and the Cboe (Chicago Board Options Exchange) compiled by FRED, the S&P 500 rose 1.79% while the VIX closed up 4.04%. The fact that both prices moved in the same direction indicates that, at least by the end of that day's trading, the market was not fully pricing down expectations for future volatility.
According to Reuters, the skew for near-term call options hit a two-year high. Data from options analytics firm Trade Alert showed the average daily S&P 500 call/put ratio for one month was 0.9, in its most bullish range in at least four years.