Original Author: Glassnode
Original Compilation: AididiaoJP, Foresight News
Bitcoin fell 13% this week, profitability collapsed sharply, realized losses surged, and spot sellers regained control. U.S. spot ETF investors fell back into unrealized losses after encountering resistance near their cost basis, while the options market continues to price in high risk.
Summary
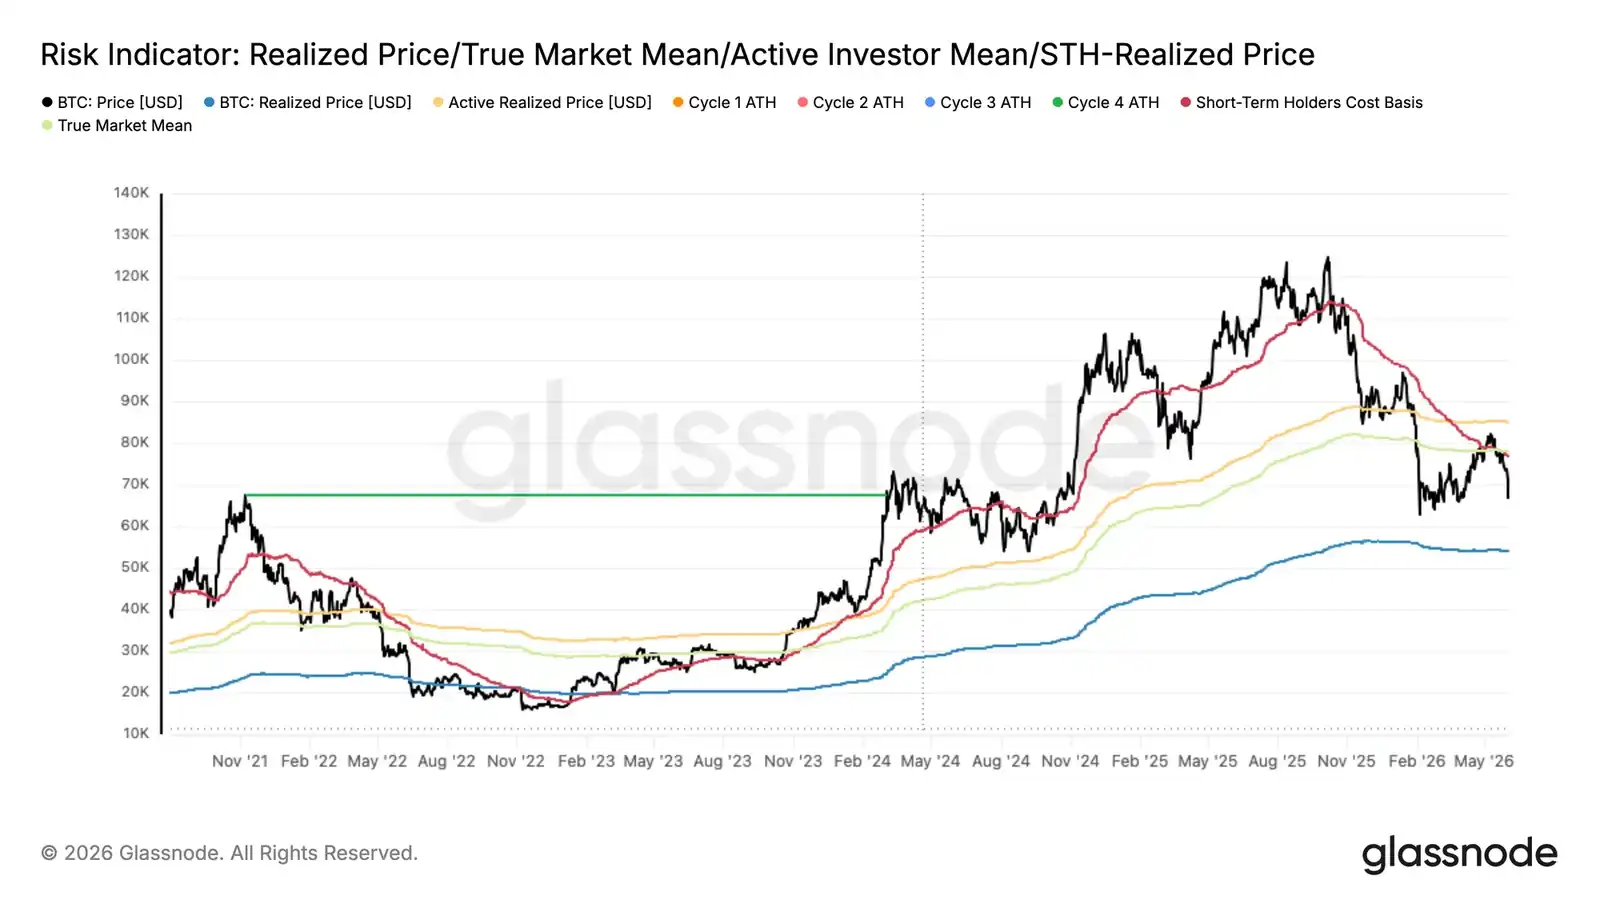
- Bitcoin fell 13% over the past 7 days, retracing to the middle of the range between the realized price and the Realized Cap Mean (a metric tracking the cost basis of actively traded supply). The Short-Term Holder cost basis fell below the Realized Cap Mean for the first time (the first occurrence since January 2022), confirming late-bear-market characteristics.
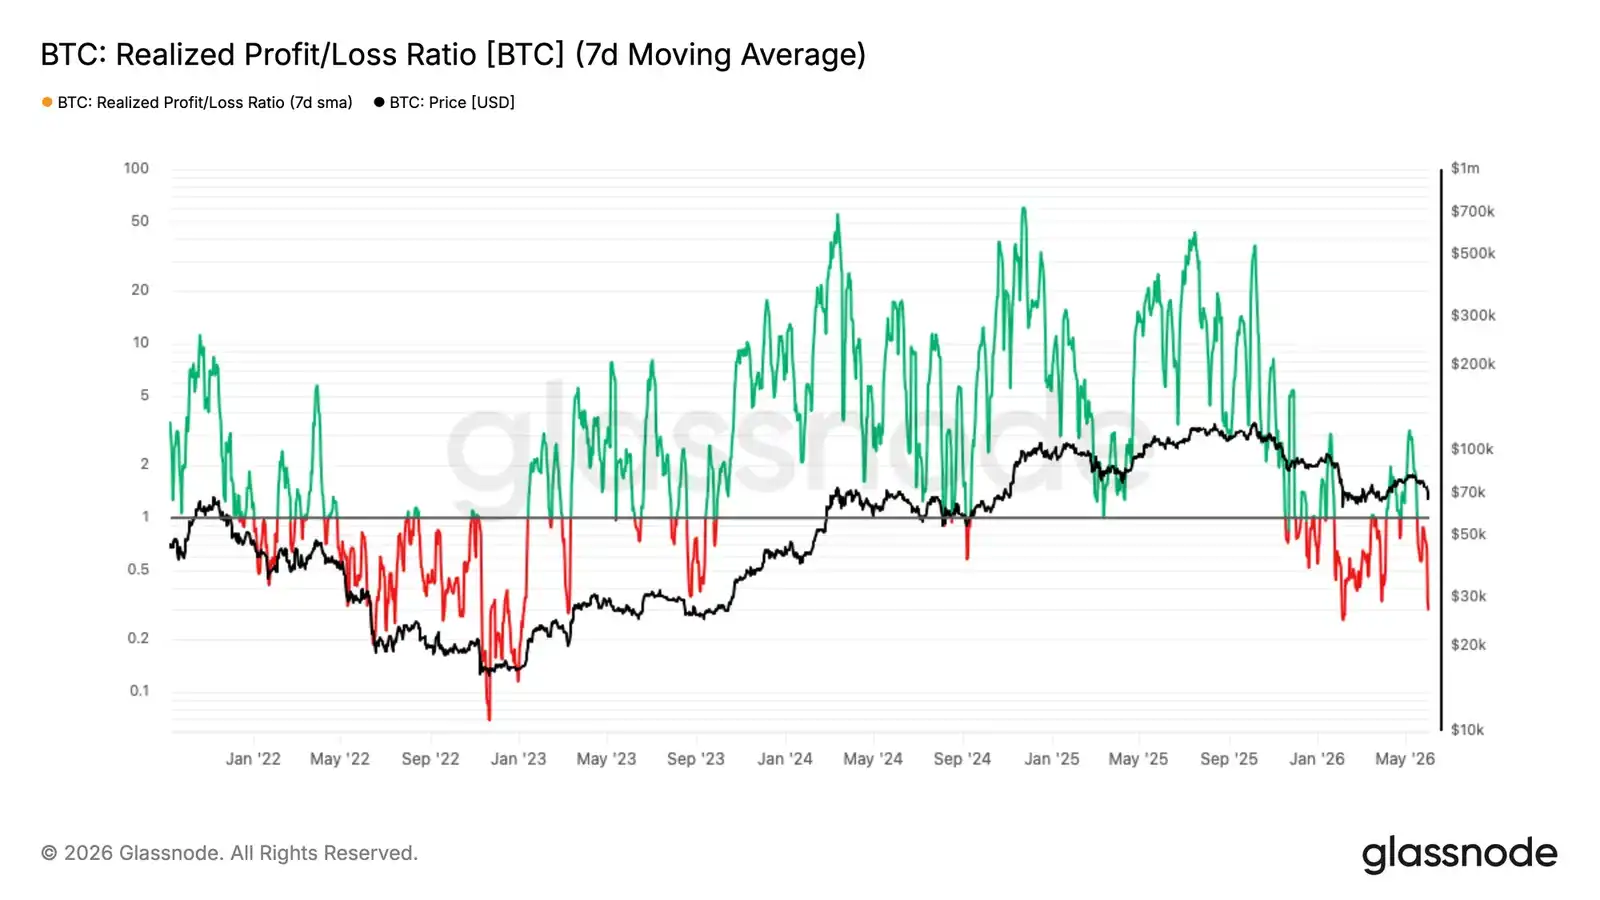
- The 7-day moving average of the Realized Profit/Loss Ratio plummeted from a local high of 3.16 to 0.29, almost identical to the panic wave in February; the 90-day moving average never breached the threshold of 2, confirming that the 82k USD rebound was merely a bear market rally, not a structural shift.
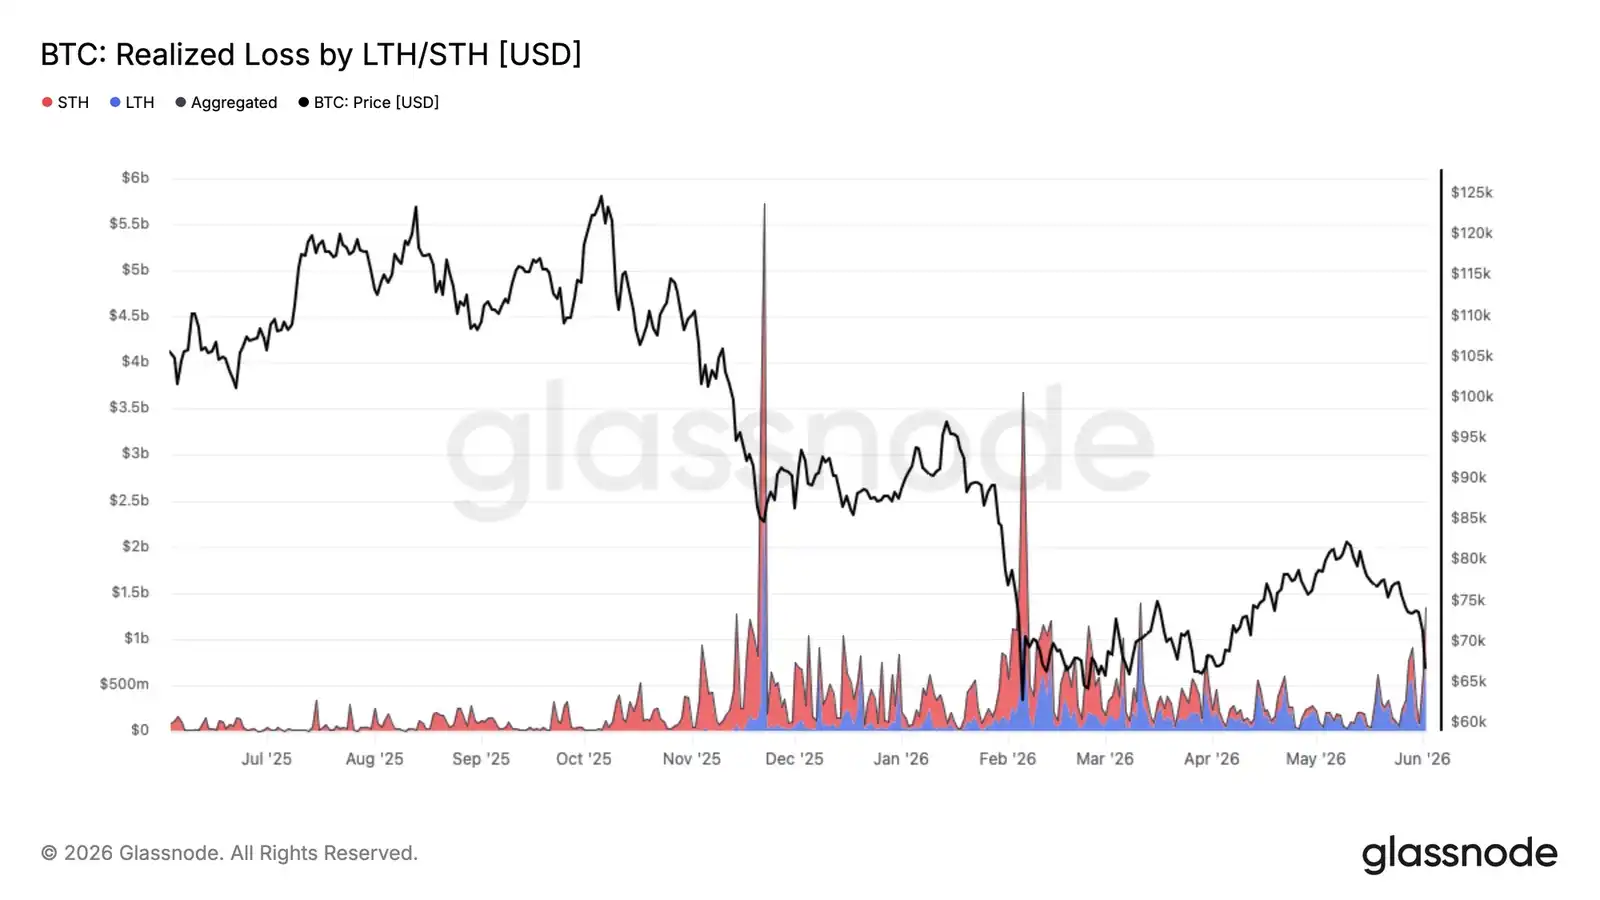
- Total daily realized losses surged to $1.35 billion, of which $770 million came from long-term holders capitulating near cycle tops, indicating the supply redistribution process is accelerating but remains incomplete.
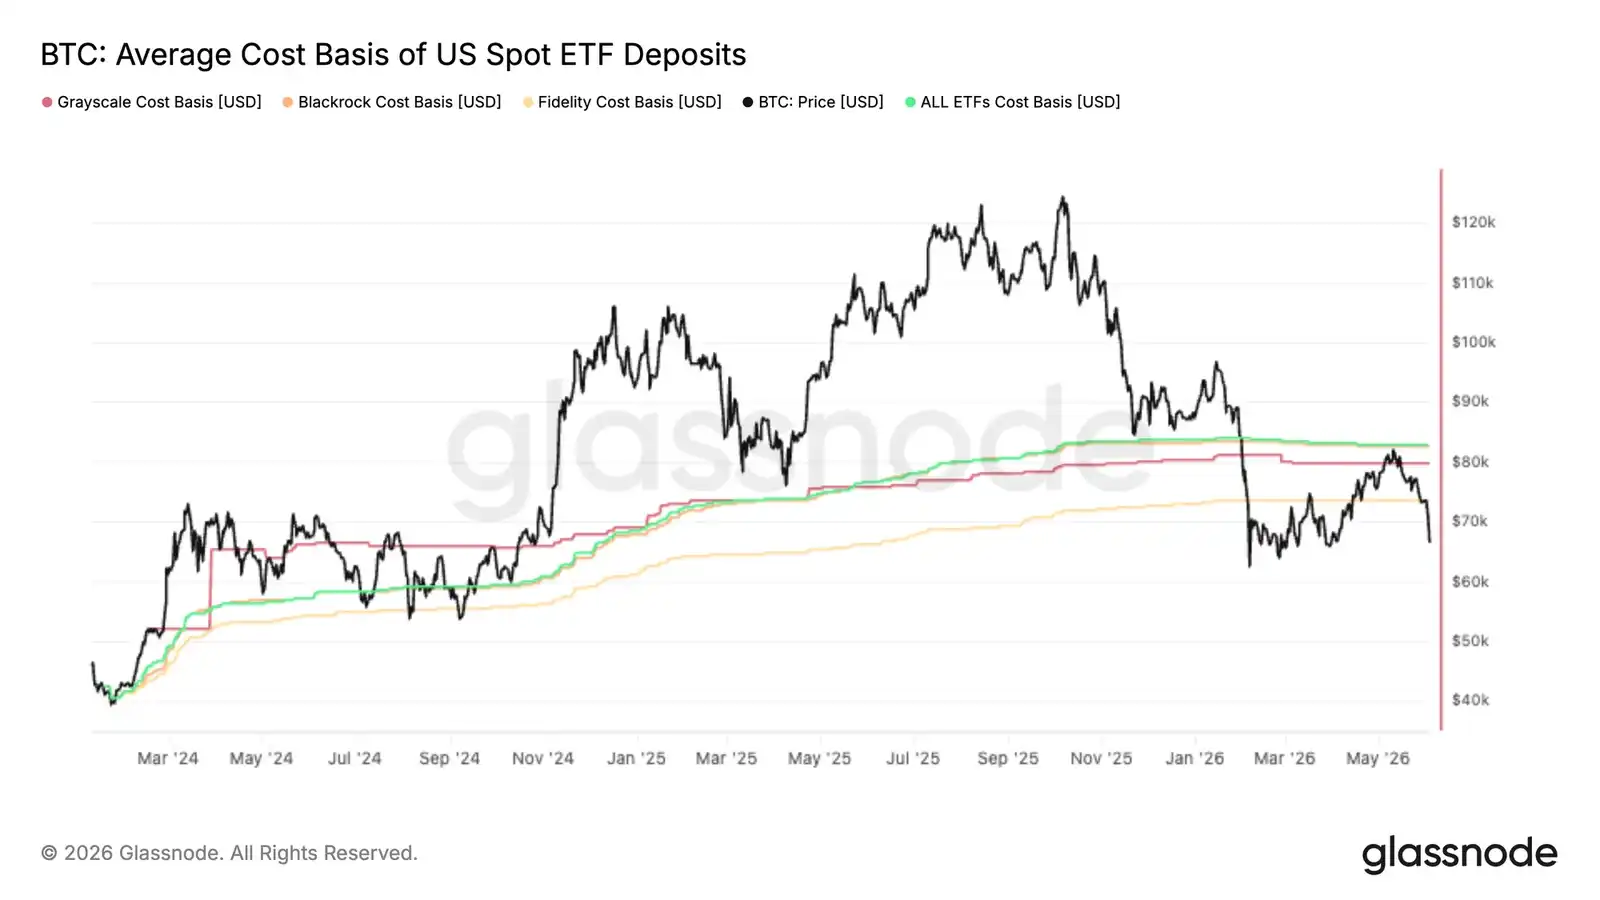
- Bitcoin was rejected almost precisely near the aggregated U.S. spot ETF cost basis of $83k, pushing the average ETF investor back into unrealized losses, reinforcing that level as a key overhead resistance.
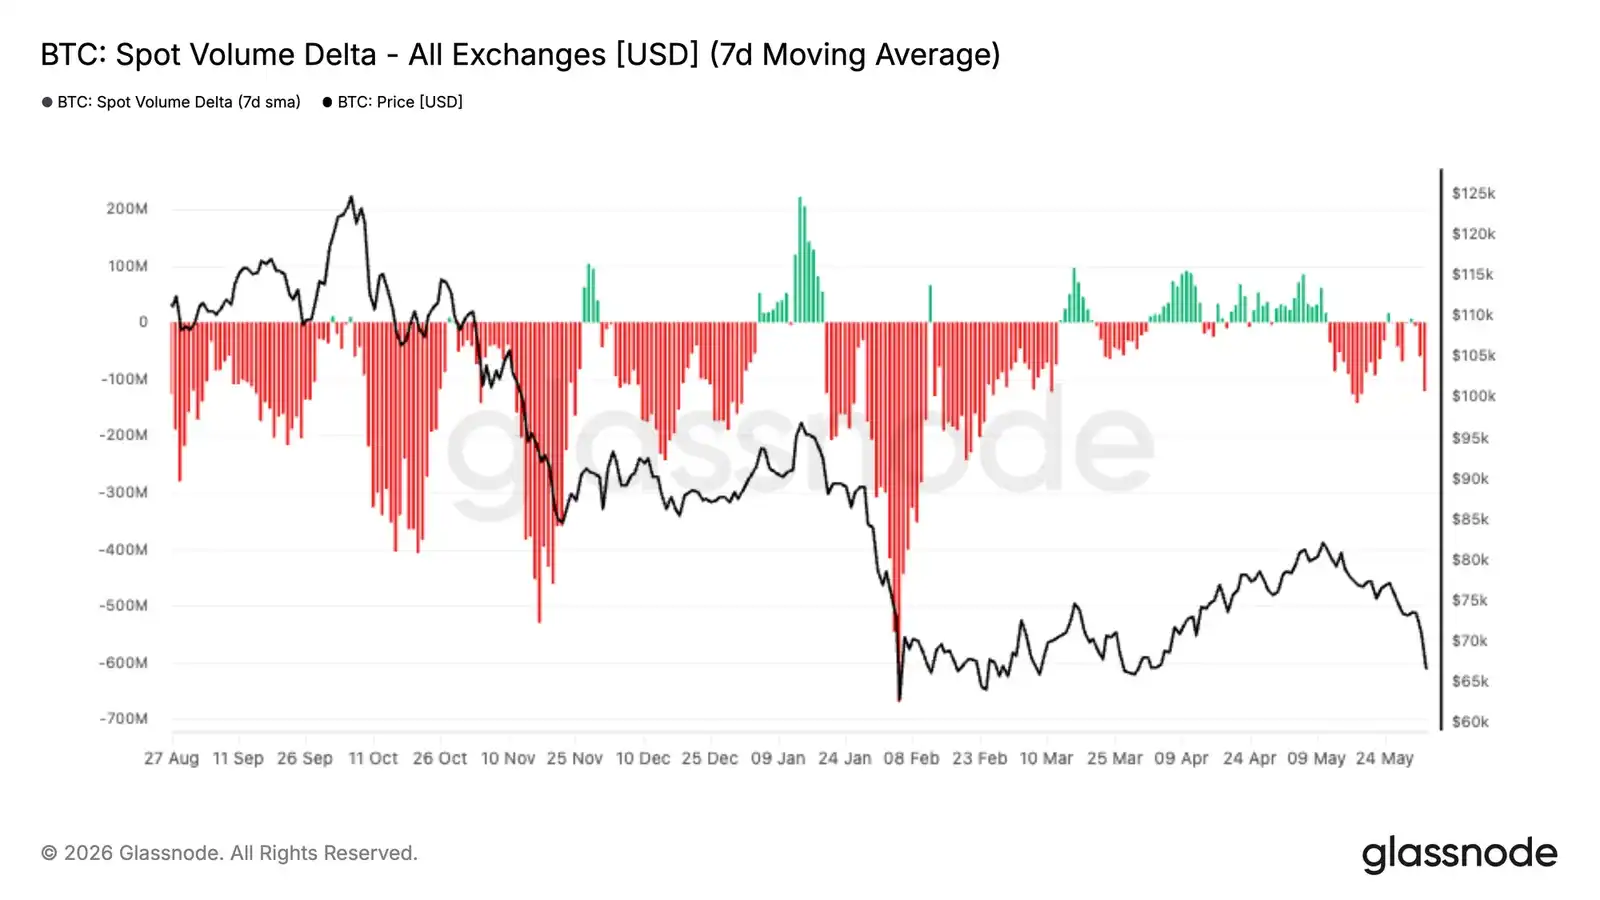
- Spot market selling pressure intensified, with the 7-day Spot Volume Delta turning significantly negative to its weakest level since February, indicating sellers continue to dominate the order book despite the pullback.
- Implied volatility continues to compress, while the volatility risk premium expands, with the options market pricing future volatility higher than recent actual market performance.
- Skew remains in the put premium zone, but the recent sell-off has not triggered a significant increase in downside hedging demand.
- Market maker positioning is concentrated around the current spot price, with Bitcoin positioned in the maximum negative gamma zone, and order flow continues to favor protective demand.
Macro Insights
U.S. April job openings rose to 7.62 million, the highest in nearly two years, exceeding market expectations by 750k. The 10-year Treasury yield climbed back above 4.45%, with the market pricing in over a 50% probability of a Fed rate hike by year-end and no rate cuts expected for the year. The Dollar Index held above 99. Financial conditions are marginally tightening, not easing.
Bitcoin absorbed this shift more intensely than any other risk asset, falling 13% over the past week to the $67,000 range. U.S. spot ETFs saw outflows for three consecutive weeks totaling $4.21 billion, the largest institutional redemption wave in 2026. Institutions are de-risking ahead of price declines, not reacting afterwards. Friday's non-farm payroll data is a key observation point. Strong data will extend the current distribution pressure; weak data may provide the first reset condition.
On-Chain Insights
Returning to Bear Market Territory
The aforementioned macro headwinds directly translated into a deterioration in on-chain structure. The 13% drop over the past week pulled the price back from the Realized Cap Mean of $77.8k, a metric that tracks the cost basis of actively traded supply and historically acts as the bull/bear market dividing line. The current price of $67k is in the middle of this range, failing to hold above the Realized Cap Mean, again confirming that the continuation of the bear market remains the dominant pattern.
Notably, the Short-Term Holder cost basis has now fallen to $76.4k and broken below the Realized Cap Mean, a configuration last seen in January 2022. This setup indicates new buyers are accumulating below key market mean valuations, a typical characteristic of late bear markets: the temporal dimension of the pullback begins to pressure investor conviction, and structural failures or large-scale capitulation are historically more likely at this stage.
Profitability Bias Collapses During Decline
Against this backdrop of structural deterioration, the short-term flow environment shifted sharply with the recent price decline. The 7-day moving average of the Realized Profit/Loss Ratio has contracted to 0.29, indicating loss realization is dramatically dominating on-chain spending behavior. This is almost identical to the panic wave in early February. On May 7th, this 7-day average had surged to 3.16 as investors realized profits during the 82k rebound, but the 90-day moving average never breached the threshold of 2 corresponding to true bullish flow. This divergence between short-term and medium/long-term readings is a clear signal of a lack of structural conviction in the rally, fitting a local top formation within a bear market rather than a credible structural shift. The subsequent retracement to 0.29 further confirms this assessment.
New Buyers Under Pressure
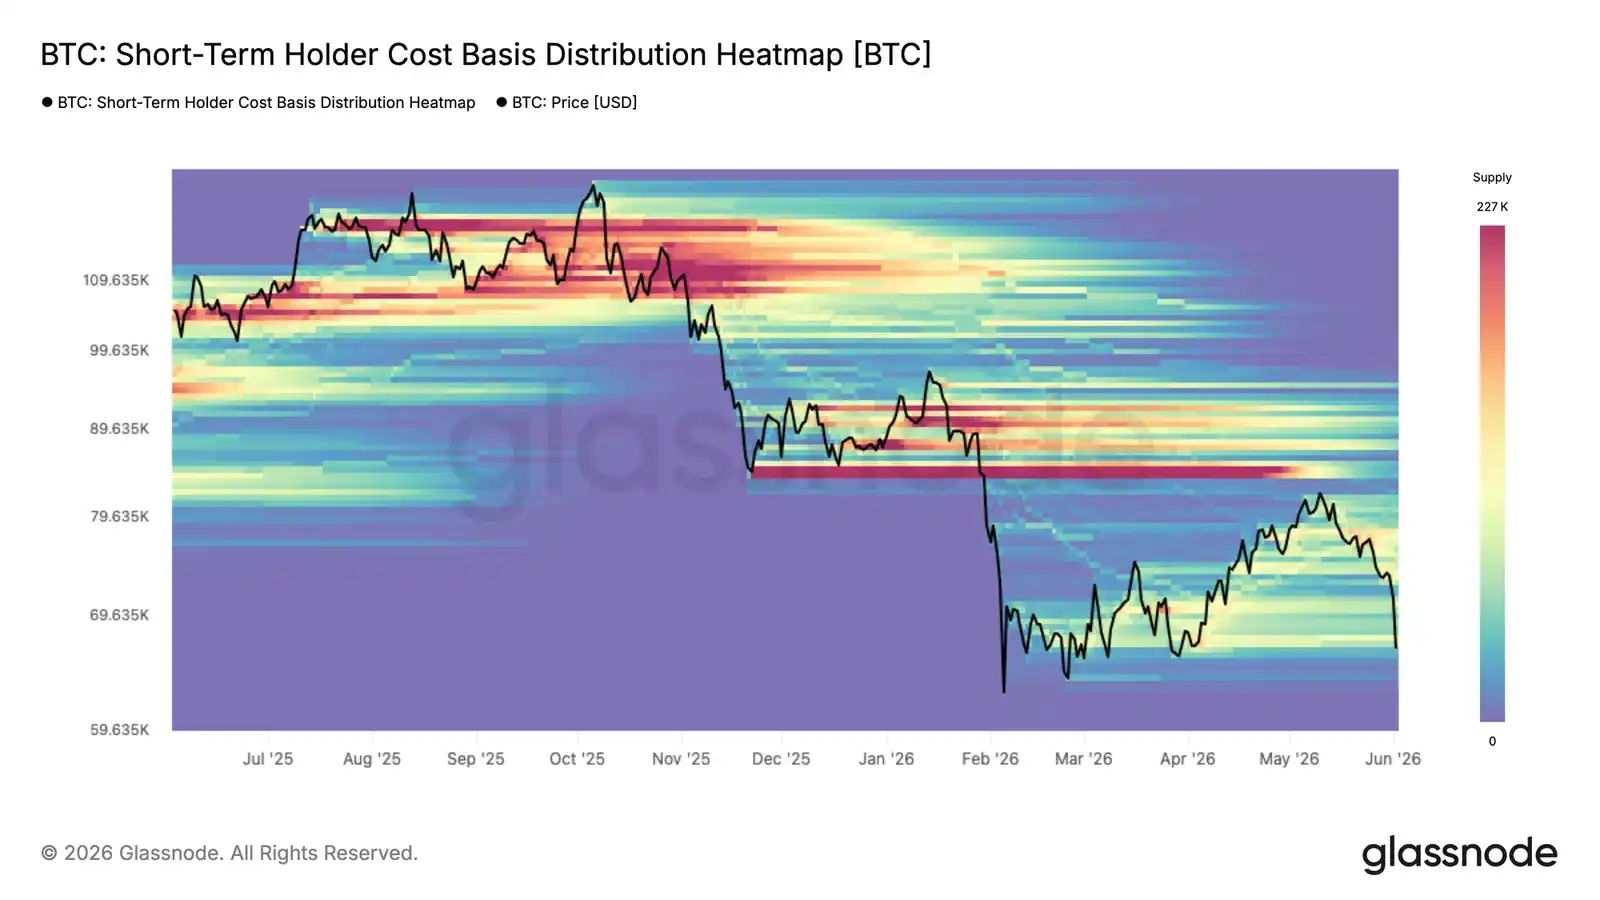
Rejection from the bear market top range resistance directly exposed recently accumulated supply to the loss line. A heatmap of the Short-Term Holder cost basis distribution shows the supply density of recent buyers across different price ranges, revealing areas where the STH cost basis is concentrated and thus where behavioral pressure is most likely to emerge.
As the price retraces to the ~$67k region, it is approaching the lower edge of the supply cluster accumulated since February. At this level, a large number of short-term holders see their unrealized profits compressed to break-even or turning into losses. Those who accumulated near the 78k-82k local top face the most immediate pressure. Whether they choose to hold or capitulate will determine if the current price level can absorb selling pressure or give way to a deeper decline.
Capitulation Accelerates Across Cohorts
As recent buyers are pushed back to the lower bounds of the three-month range, the pressure of loss realization has expanded from the most recently accumulated supply to a broader spectrum. The current pullback to $67k has pushed total daily realized losses to $1.35 billion, a significant acceleration from baseline levels during the prior consolidation.
Of this, $770 million daily is realized by Long-Term Holders who bought before January 2026, reflecting ongoing capitulation from cycle-top buyers as the bear market extends in duration. The remainder comes from recent buyers who accumulated within the 67k-82k range during 2026 and are forced to exit at a loss as prices fall below their cost basis.
This pattern of long-term holders capitulating and transferring supply to new buyers at lower prices is a recurrent and necessary feature of the cycle bottoming process as the bear market matures. However, the current pace of loss realization suggests this process remains incomplete.
Off-Chain Insights
Falling Below ETF Cost Basis
Bitcoin's latest rally stalled almost precisely near the aggregated U.S. spot ETF cost basis of $83k, transforming a level that previously acted as support into clear resistance. This suggests a significant number of previously underwater ETF investors used the rebound to reduce exposure or exit at their break-even point.
This rejection is particularly noteworthy because ETF flows have been a dominant demand source this cycle. When price struggles to reclaim the average holder's cost basis, it often indicates that supply from trapped investors is outpacing new demand, creating overhead resistance.
Going forward, the aggregated ETF cost basis remains a critical observation level. A decisive reclaim would put the average ETF investor back in profit and likely improve sentiment within this cohort. Until then, failure to hold above this level indicates ETF holdings remain a headwind, with investors using strength to de-risk rather than accumulate.
Spot Buying Disappears
Spot market flow has deteriorated sharply over the past two weeks, with the 7-day Spot Volume Delta turning negative and reaching its weakest level since the February sell-off. This indicates aggressive sellers are again dominating the spot order book, reinforcing the weakness of recent price action.
The peculiarity of the current move is that it follows a period of persistent spot-dominated accumulation in April and early May. During that uptick, buyers consistently lifted offers, pushing the Spot Volume Delta into positive territory and helping Bitcoin recover from the mid-$60ks to $80k. That demand pulse has now faded, with sellers regaining control as price failed to break higher.
Sustained negative Spot Volume Delta is typically associated with either capitulation events or early stages of a broader trend reversal. At present, it suggests the market remains in a distribution phase, with spot participants selling into strength rather than accumulating. A notable improvement in spot demand remains a key signal needed to support a sustainable recovery.
Futures Liquidations
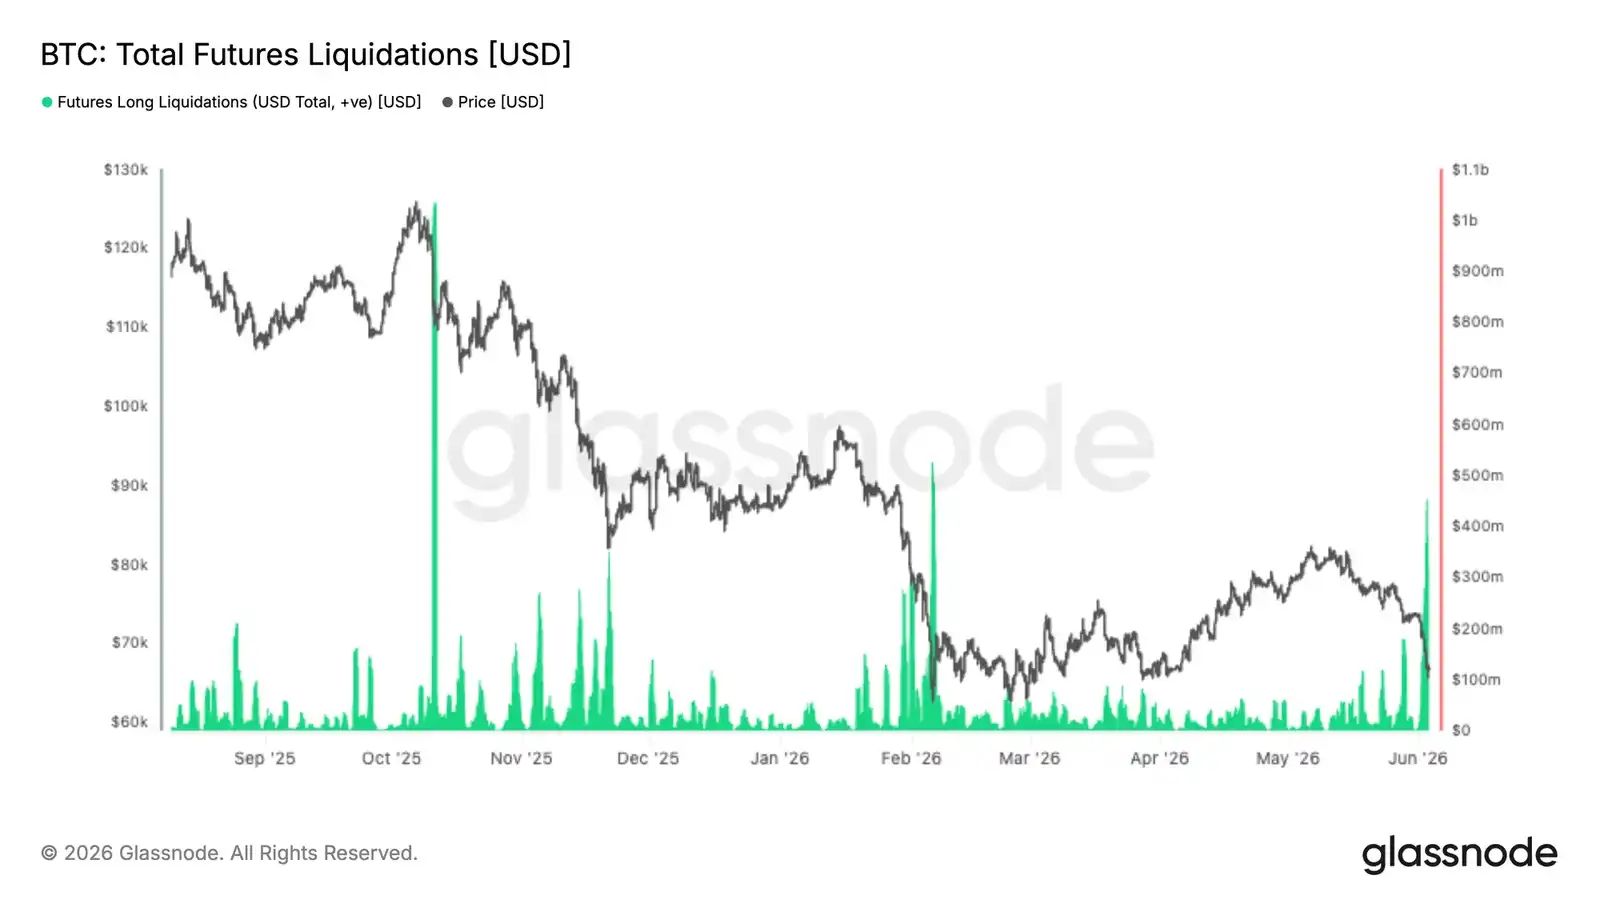
The latest market pullback triggered one of the largest liquidation events of this cycle, with over $400 million in leveraged long positions forced to close as Bitcoin broke below $70k. While painful for late entrants, such events often cleanse the system of excess leverage and reset market positioning.
Notably, the scale of this liquidation remains below those during the October 2025 and February 2026 corrections, suggesting leverage was not excessively stretched entering this decline. Historically, large long liquidations often coincide with local exhaustion points, as forced selling cascades through the derivatives market and clears out weak hands.
The key question moving forward is whether spot demand can step in to absorb the supply. If liquidation-driven selling pressure begins to subside and spot buyers return, the market could be left with a cleaner positioning backdrop and lower leverage overhang, creating conditions for a more sustainable recovery.
Implied Volatility Continues Lower
Looking at implied volatility, the dominant trend remains compression across the entire term structure despite the spot breakdown. The 1-month tenor fell from ~38% to 34%, while the 3-month and 6-month tenors also compressed by ~3 volatility points each over the past two weeks.
This move reflects a market unwilling to pay up for options even after Bitcoin broke below recent range lows. While front-end volatility saw brief reactions during sharp spot moves, these were quickly sold, maintaining the broader downtrend.
The term structure remains in contango, with forward volatility still trading at a premium to the front end. This indicates traders continue to view recent price weakness as a local event, not a catalyst for a broader volatility repricing.
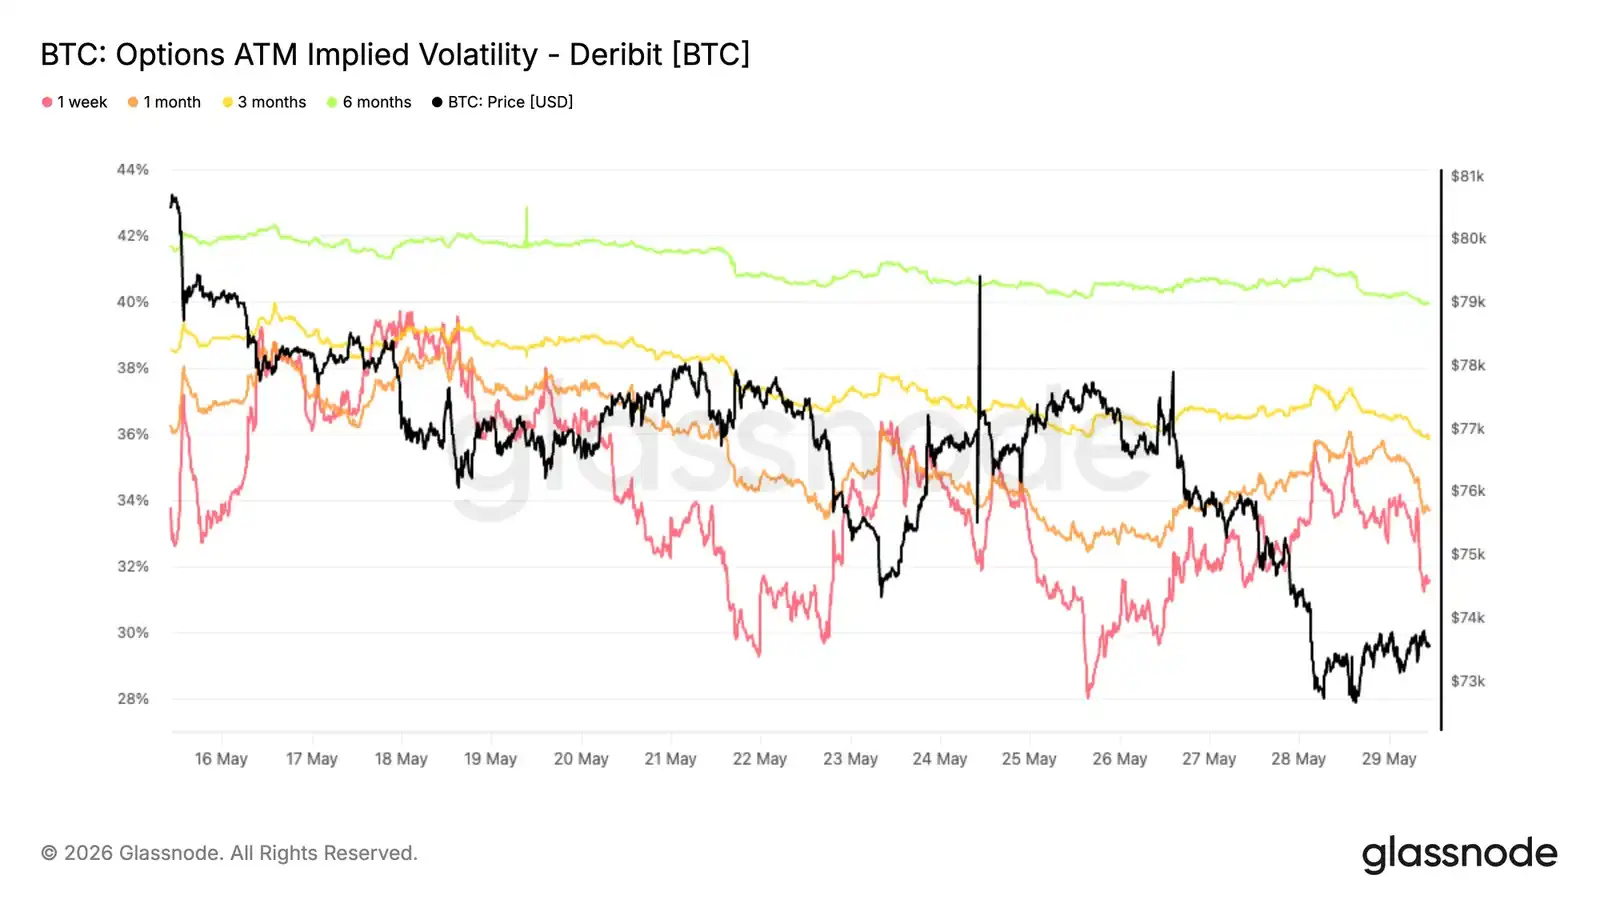
Volatility sellers remain dominant, with demand for protection not accelerating despite price weakness.
Volatility Risk Premium Nears Three-Month High
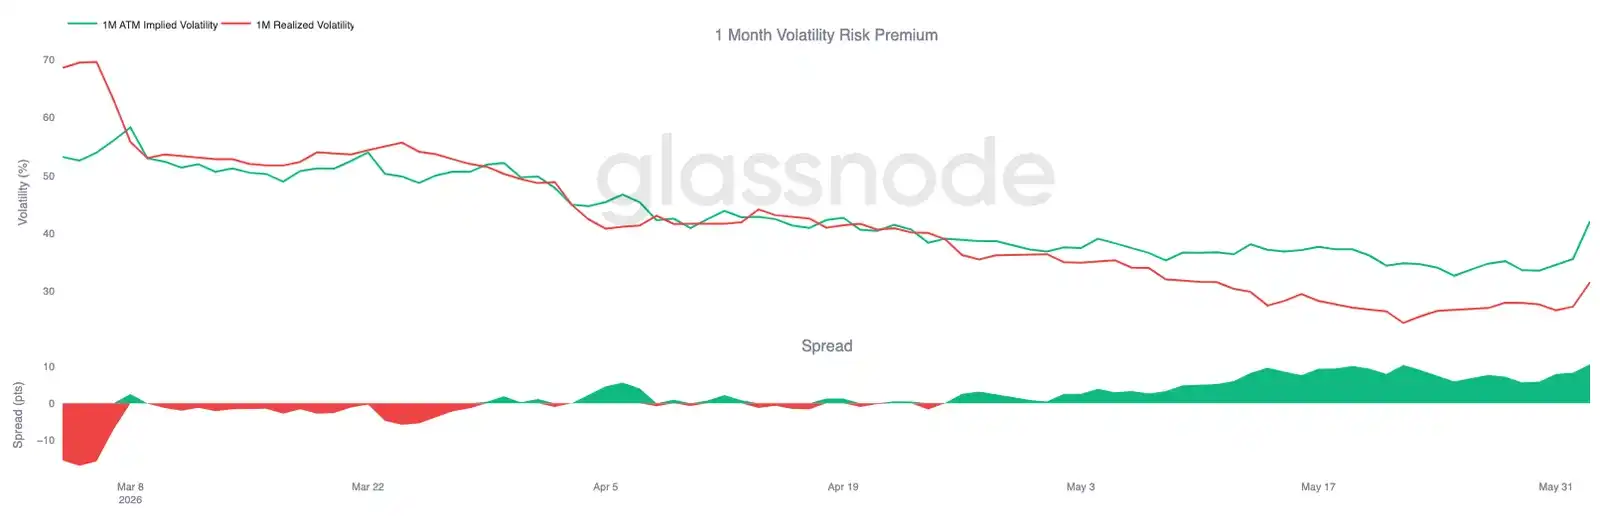
While implied volatility declines, the relationship between implied and realized volatility tells a different story. Despite Bitcoin experiencing a volatile period, the options market continues to price the future significantly higher than the volatility recently delivered by spot.
The 1-month implied volatility has rebounded to around 42%, while realized volatility remains near 32%. The result is a widening volatility risk premium to near its highest levels of the past three months.
This shift has been particularly evident during the recent sell-off. While realized volatility picked up as spot broke key supports, implied volatility rose faster, reflecting incremental demand for options and protection.
The options market continues to assign a higher probability to future volatility than suggested by recent price action alone, keeping the volatility premium at a significant premium.
Put Premium Remains Elevated
As the volatility risk premium widens, skew shows where traders continue to concentrate their option demand. Despite the spot breakdown, put options remain consistently more expensive than calls across the entire term curve.
Conclusion
Bitcoin's latest decline further confirms the view of a still-fragile market, with weakness apparent across profitability, investor behavior, ETF holdings, and spot market demand. Rejection at the aggregate ETF cost basis around $83k indicates many investors remain trapped above current prices, creating overhead supply that continues to suppress Bitcoin's rebound.
Meanwhile, realized losses are accelerating, long-term holders are beginning to sell in size, and spot order flow has clearly shifted to sellers. While the recent liquidation event helps cleanse leverage from the system, there is little evidence so far of a lasting demand response capable of absorbing the resulting supply.
The situation is similar in the options market. Traders are still paying for downside protection and future volatility, but not the panic typically associated with sharp declines. Until spot demand strengthens, ETF investors return to profitability, and selling pressure begins to abate, the market remains at risk of further declines and continued consolidation within the broader bear market structure.