Editor's Note: As Bitcoin underperforms while gold and U.S. stocks repeatedly hit new highs, the narrative that "funds are rotating from precious metals to crypto assets" has once again gained popularity in the market. This article does not follow this intuitive judgment to provide trading conclusions but instead returns to the data itself to systematically examine whether there is a verifiable long-term relationship between Bitcoin and gold.
Through correlation and cointegration analysis, it can be seen that Bitcoin and gold do not have a robust mean reversion or a structural "see-saw" relationship. The so-called rotation is more of an ex-post explanation rather than a repeatable, verifiable market mechanism. Bitcoin is neither a safe-haven metal nor a stock index; it is an independent market with extremely high volatility and an evolving structure.
The article further points out that to judge Bitcoin's bottom, rather than applying analogies from other assets, it is better to focus on the factors that truly determine market trends, such as positioning, derivatives structure, and sentiment clearing. Historical experience shows that most true bottoms are formed when almost everyone has given up.
Below is the original text:
The crypto market is not exactly hot right now. While stock and metal prices continue to hit new all-time highs, crypto assets have been on the "pain train" since last October.
Recently, timelines have been flooded with claims like: "Funds are rotating from precious metals to crypto assets, and it's about to happen any time now." Unfortunately, the people making these claims are often industry-famous "talkers," whose only consistently profitable PnL comes from the engagement revenue they earn monthly on platform X.
I want to take a moment to analyze whether this so-called "rotation from precious metals to crypto" has any substantive basis (spoiler alert: it doesn't), and then share some key turning points in crypto market history and how you can identify these moments.
The Relationship Between Bitcoin and Gold
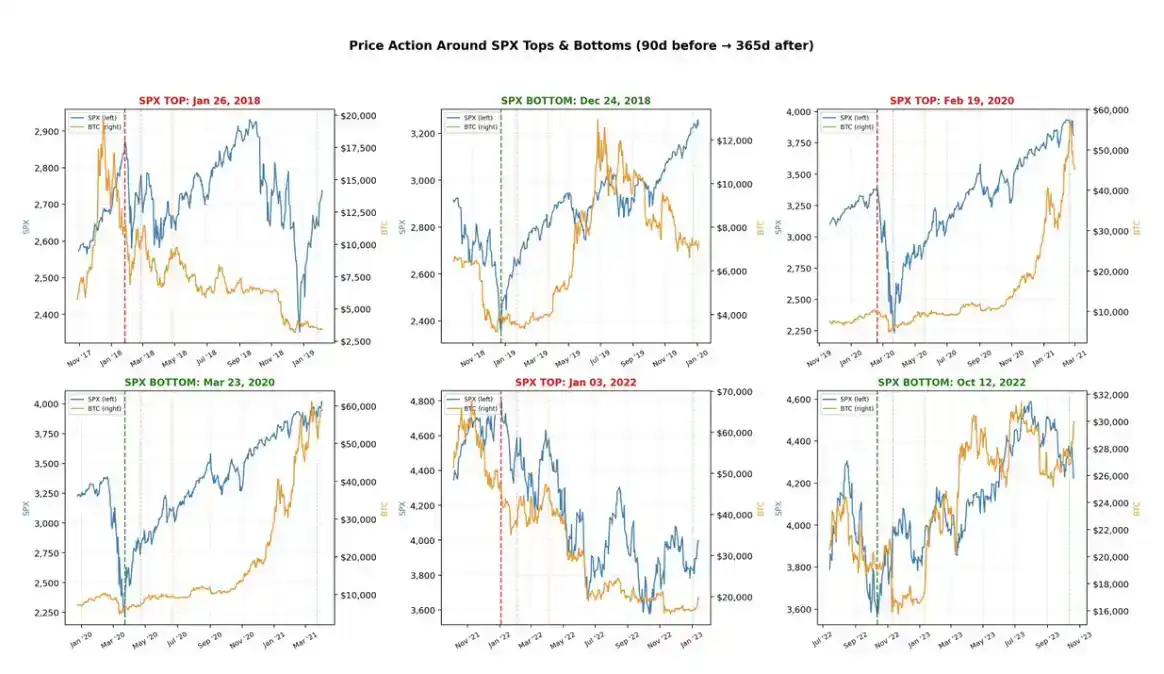
First, an obvious problem: to look for a relationship between gold peaking and Bitcoin's performance, the premise is that gold itself must frequently "peak." But in reality, over the past decade, there haven't been many true tops in gold.
Getting hyped up is fun, but when throwing out opinions on the internet, it's best to have data to back them up, so you don't sound like a complete fool. In the past decade, gold has only experienced three relatively significant pullbacks: in 2018, 2020, and 2022. That is, only three data points. This alone is enough for me to stop further research; but to finish this article, let's dig a little deeper.
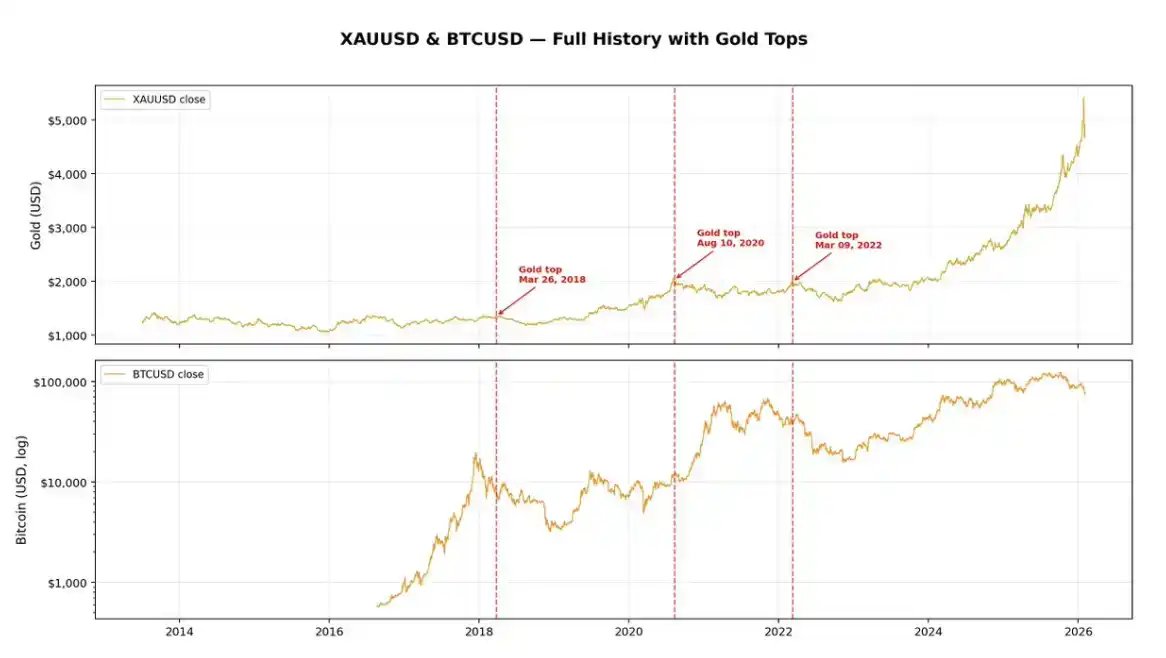
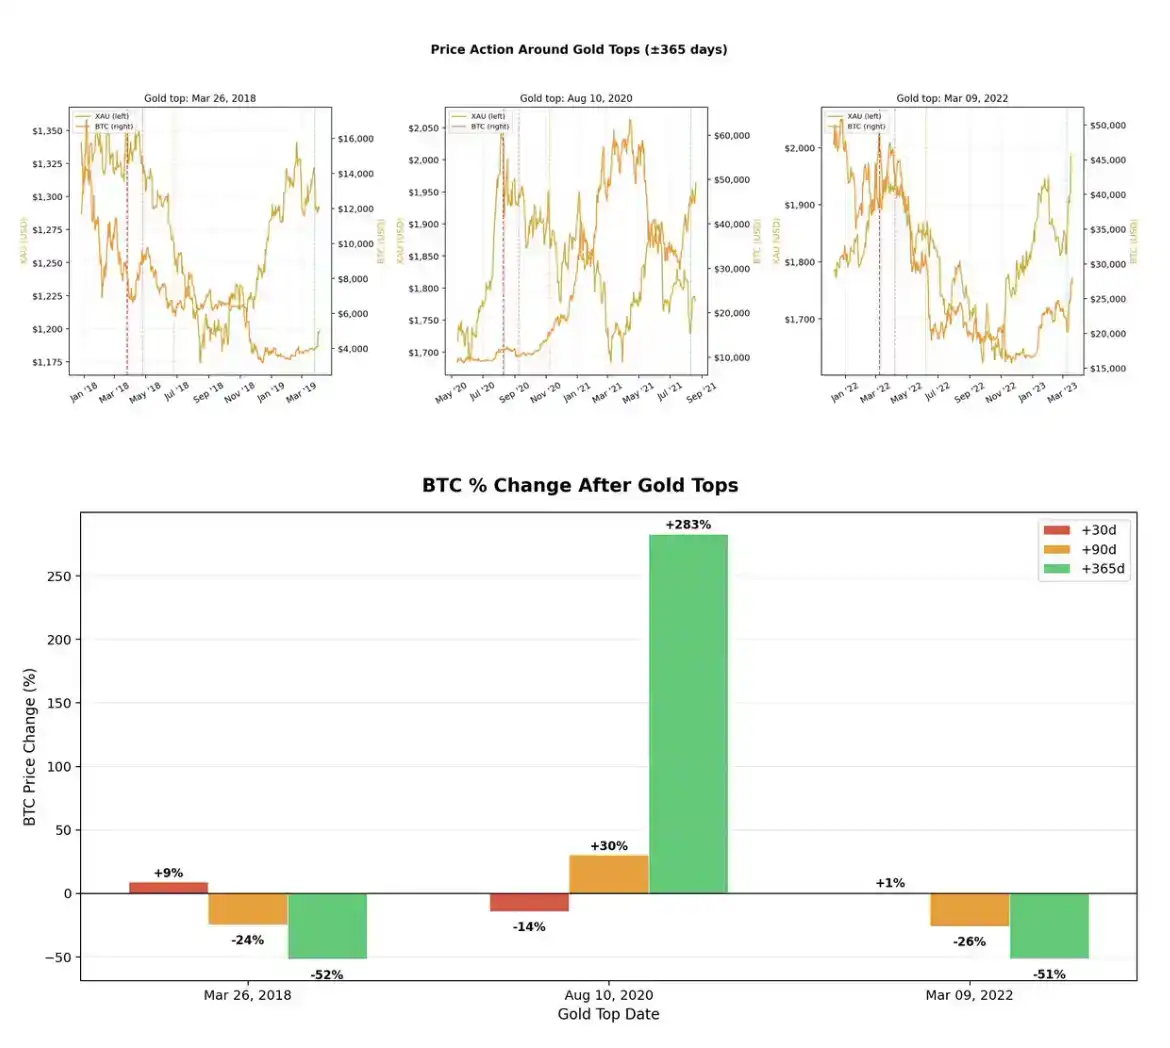
If you look at the chart above, you'll see that two of the three阶段性 highs in gold actually occurred before Bitcoin's downtrend, in 2018 and 2022. The only time Bitcoin strengthened after a gold pullback was during the typical "risk-on" frenzy of 2020.
Over the past approximately 10 years of data, the overall correlation coefficient between Bitcoin and gold is close to 0.8, which is not surprising—because in the long run, both markets have been rising. But correlation doesn't answer the question you really care about.
If you want to determine whether there is a "see-saw, strength rotation, eventual reversion" relationship between two assets, looking at correlation is not enough; you need to look at cointegration.
Cointegration
Correlation measures whether two assets "rise and fall together" in daily fluctuations.
Cointegration asks another question: do these two assets maintain a stable relationship over the long term, such that any deviation is pulled back?
Think of it like two drunk people walking home together:
They may each stagger and wander chaotically (non-stationary), but if the two are tied together with a rope, they can't stray too far from each other. That "rope" is the cointegration relationship.
If the narrative of "funds rotating from gold to crypto assets" has any substance, you would at least need to see a cointegration relationship between Bitcoin and gold—that is, when gold surges and Bitcoin significantly underperforms, there should be some real force in the market that pulls them back onto the same long-term track.
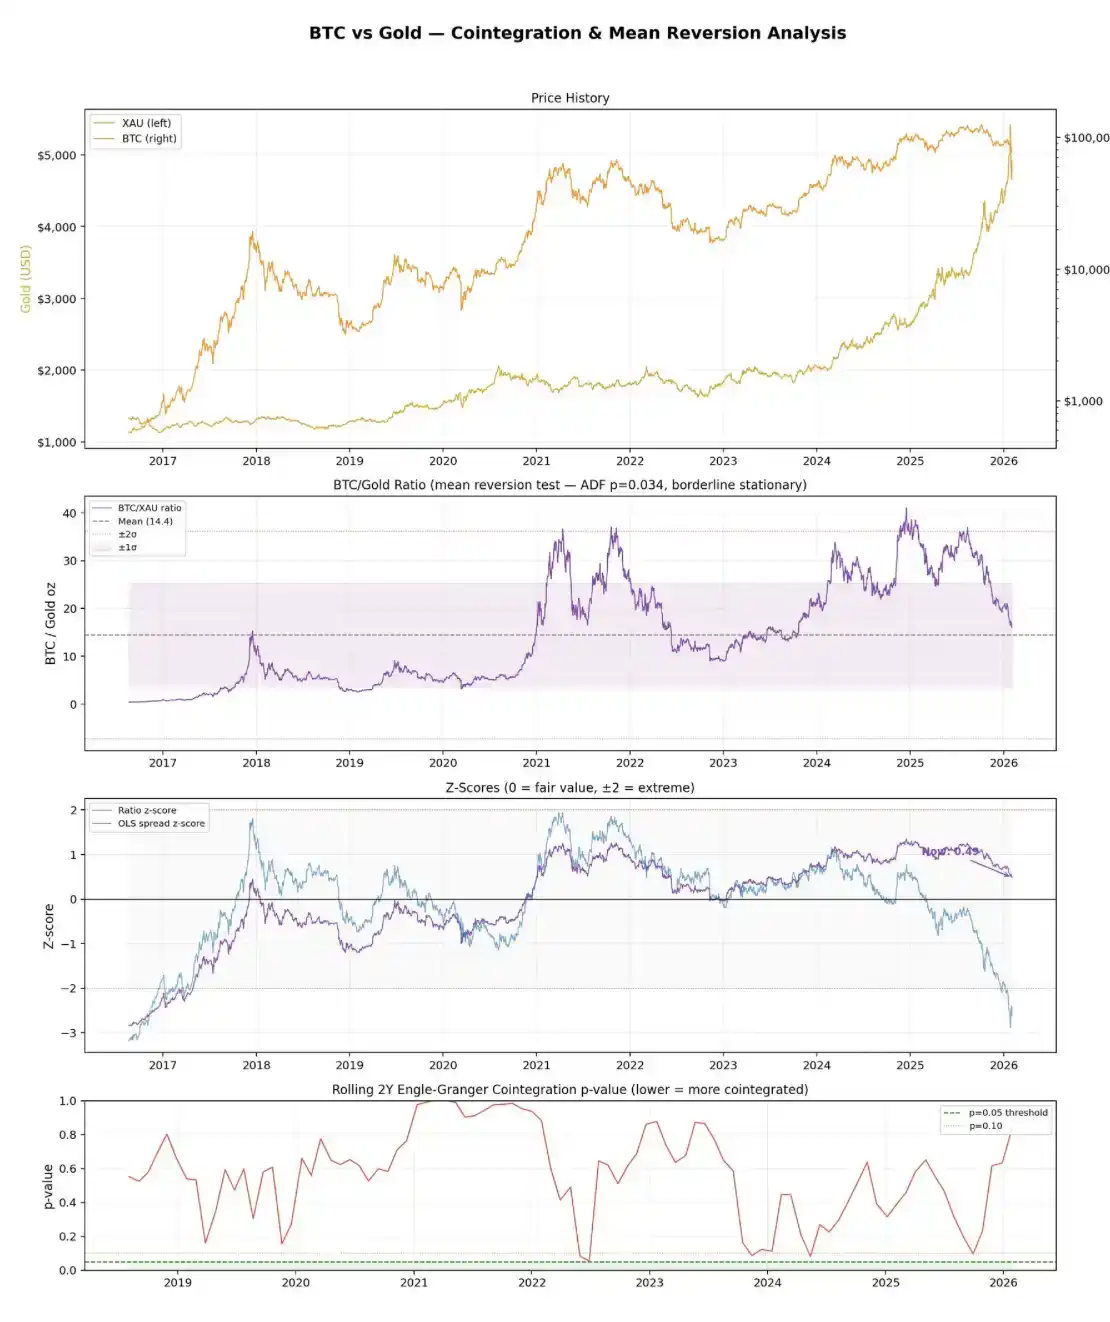
Combined with the chart above, the real message from the data is this: The Engle–Granger cointegration test did not find any cointegration relationship.
The p-value for the full sample is 0.44, well above the usual 0.05 significance threshold. Looking further at rolling two-year windows, none of the 31 intervals showed cointegration at the 5% significance level. At the same time, the spread residuals themselves are non-stationary.
The simpler BTC / gold ratio looks slightly more "optimistic," but not by much. An ADF test on this ratio is only marginally stationary (p = 0.034), meaning it may have very weak mean reversion characteristics. But the problem is that its half-life is about 216 days, or nearly 7 months—absurdly slow, almost completely淹没 in noise.
From current levels, Bitcoin's price is equivalent to about 16 ounces of gold, about 11% higher than the historical average of 14.4. The corresponding z-score is -2.62, and from a historical perspective, Bitcoin seems "relatively cheap" compared to gold.
But the key here: this reading is mainly driven by gold's recent parabolic rise, not because there is some reliable mean reversion relationship that will pull them back together.
In fact, there is no robust cointegration relationship. They are fundamentally two completely different types of assets: gold is a mature safe-haven asset; Bitcoin is a high-volatility risk asset that just happens to show an upward trend over the same period.
If you have no idea what any of that meant, here's a super brief statistics crash course:
The Engle–Granger test is the standard method for judging cointegration. It first performs a regression on the two assets, then tests whether the regression residuals (i.e., the "spread" between them) are stationary—whether they fluctuate around a stable mean rather than drifting infinitely. If the residuals are stationary, it means the two assets are cointegrated.
The ADF test (Augmented Dickey-Fuller) is used to test whether a time series is stationary. It essentially tests for the presence of a "unit root,"通俗点说, whether this series will trend发散 indefinitely or revert to the mean.
A p-value below 0.05 means you can reject the "unit root" hypothesis and consider the series stationary, i.e., mean-reverting.
Half-life describes how quickly mean reversion occurs. If a spread has a half-life of 30 days, it means that after being pulled apart, it takes about a month to修复 half of the deviation.
Short half-life = tradable;
Very long half-life = basically useless except for "holding long and praying."
Ultimately, I've always felt that trying to force Bitcoin into a relationship with any traditional financial asset is absurd in itself. Most of the time, people just use this comparison to迎合 the narrative that best suits their current position: today Bitcoin is "digital gold," tomorrow it's "leveraged Nasdaq."
In comparison, the correlation with the stock market is much more real. Over the past five years, Bitcoin's tops and bottoms have been highly synchronized with the S&P 500 (SPX)—until this phase: SPX is still稳稳地 near all-time highs, while Bitcoin has already pulled back 40% from its peak.
Because of this, you should view Bitcoin as an independent entity. It is not a metal—no one considers an asset with an annualized volatility exceeding 50% a safe-haven asset (for comparison, gold's annualized volatility is around 15%, and even that is considered relatively high volatility among "store of value" assets).
It is also not a stock index—Bitcoin has no constituent stocks; it is essentially just a piece of code.
Over the years, Bitcoin has been constantly套上 various narratives: payment tool, store of value, digital gold, global reserve asset, etc.
These all sound great, but the reality is that this is still a very young market, and it's hard to say whether it has clear, stable practical uses beyond being a "speculative asset." Ultimately, there's nothing wrong with treating it as a speculative asset; the key is to be清醒 and realistic about it.
The Bottom
Stably and reliably catching Bitcoin's bottom is extremely difficult—of course, it's not easy in any market, but Bitcoin's problem is that it has changed so much over the years that historical patterns themselves are becoming less and less relevant.
Ten years ago, the market structure of gold and the S&P 500 (SPX) hadn't changed much compared to now;
But in 2015, one of the main uses of holding Bitcoin was still to buy heroin online.
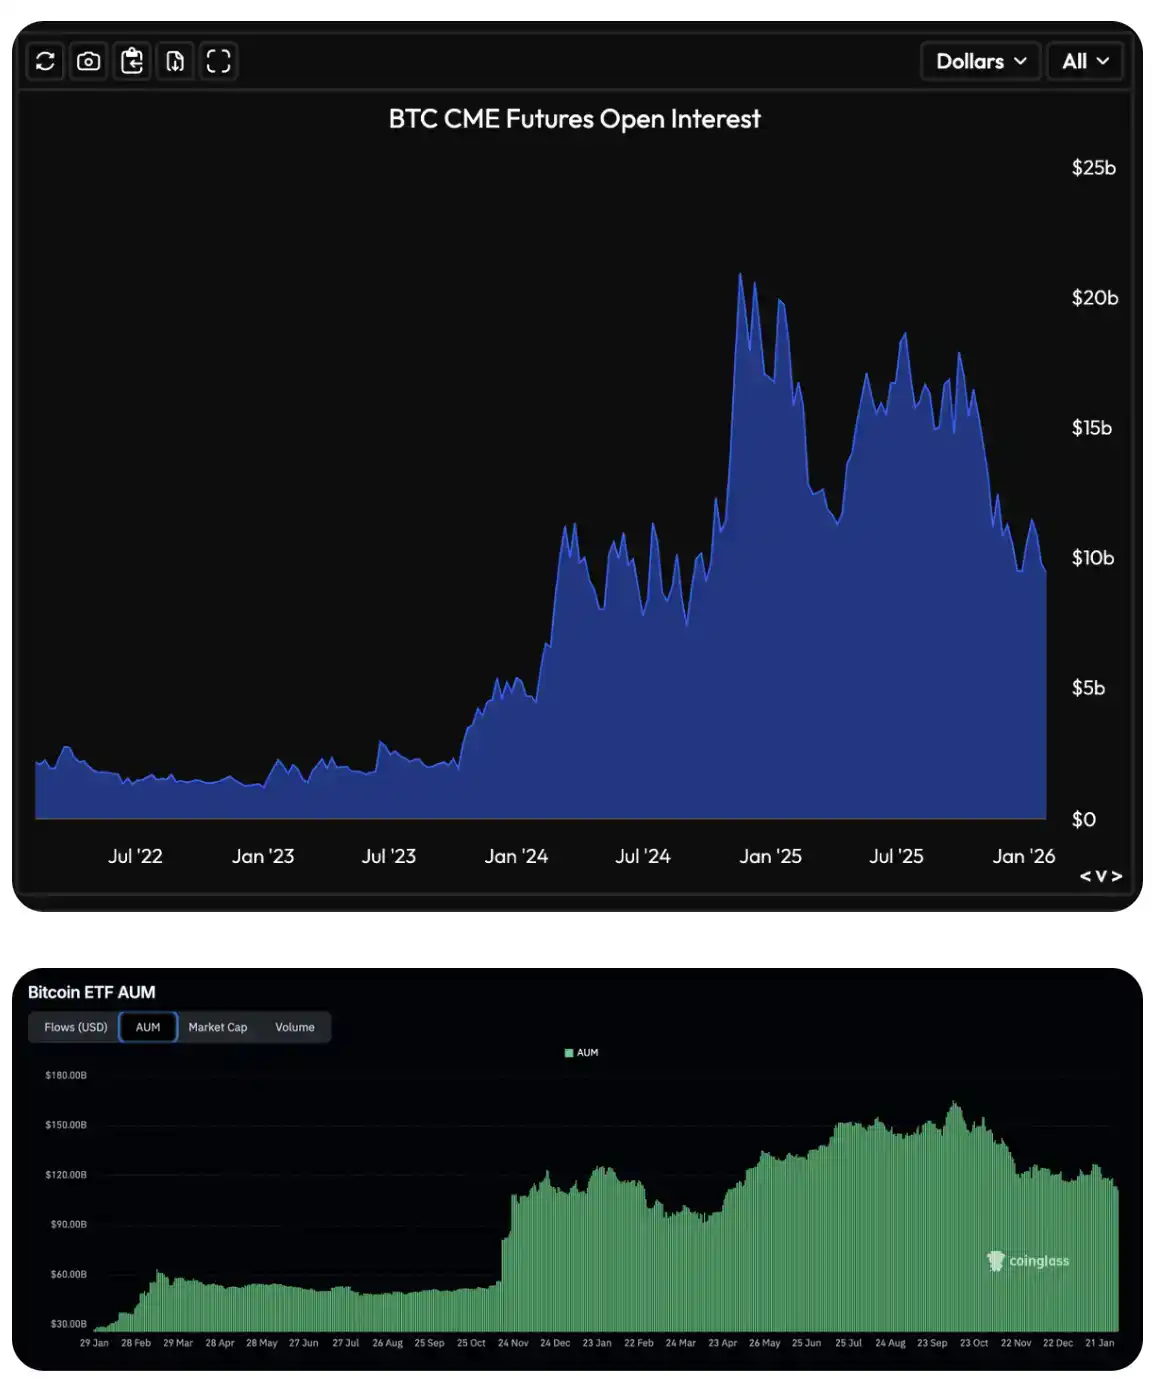
This has obviously changed dramatically. Today's market participants are much more "legitimate," especially after the significant growth in open interest of CME Bitcoin futures and options in 2023, and the launch of Bitcoin ETFs in 2024, which brought institutional funds正式 and大规模 into this market.
Bitcoin is a highly volatile market. If there's one conclusion we can state with relative confidence, it's this: market bottoms are accompanied by剧烈过度反应 and "stampede-like clearing" across various derivatives.
This signal is reflected both in crypto-native indicators, such as extreme fluctuations in open interest and funding rates; and in more institutionalized indicators, such as异常 changes in options skew and ETF fund flows.
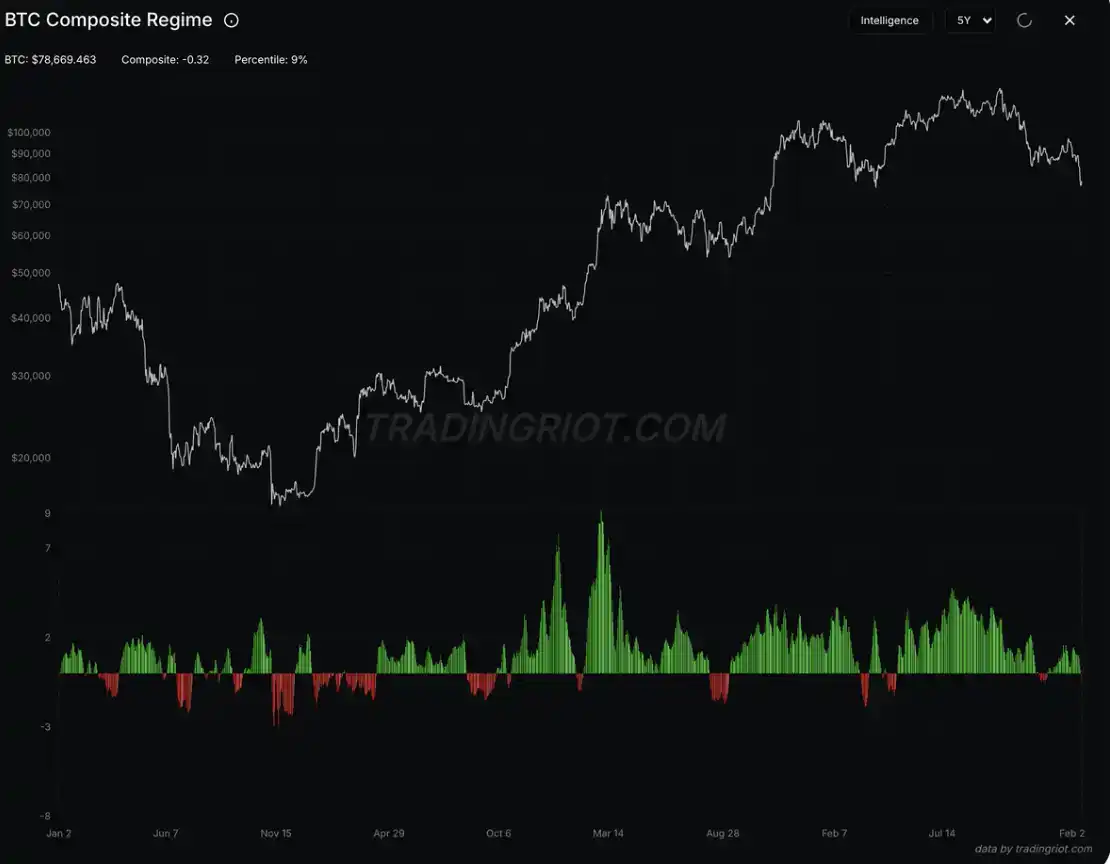
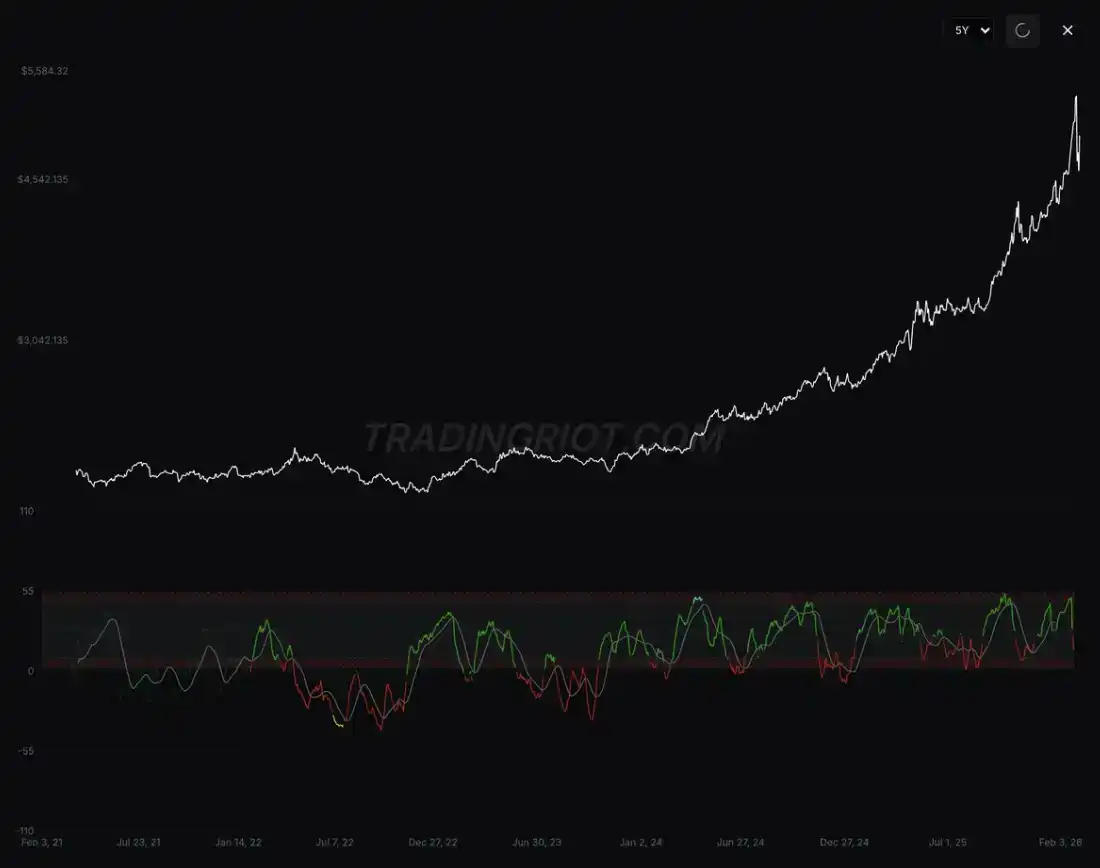
I personally built an indicator that integrates these signals into a composite regime for tracking (disclaimer: this indicator is not publicly available for now, sorry). As seen in the chart, the areas marked in red usually correspond to phases of极度低迷 market sentiment: open interest持续下降, funding rates turning negative, traders paying excessive premiums for put options, and realized volatility exceeding implied volatility.
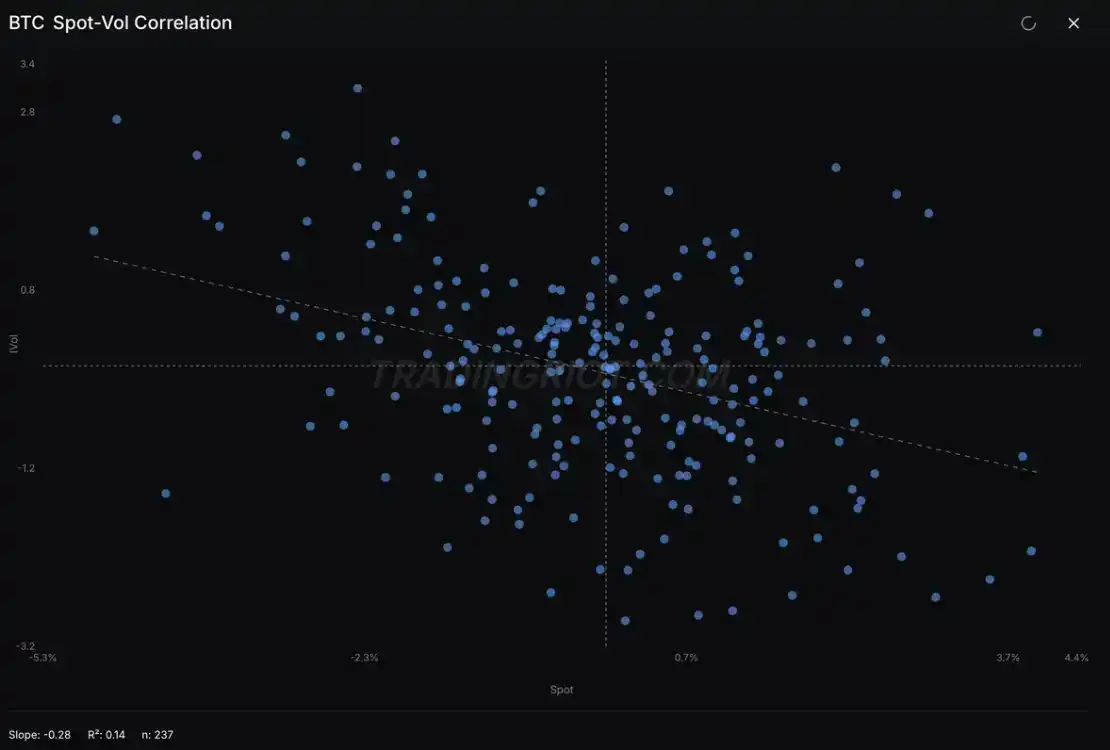
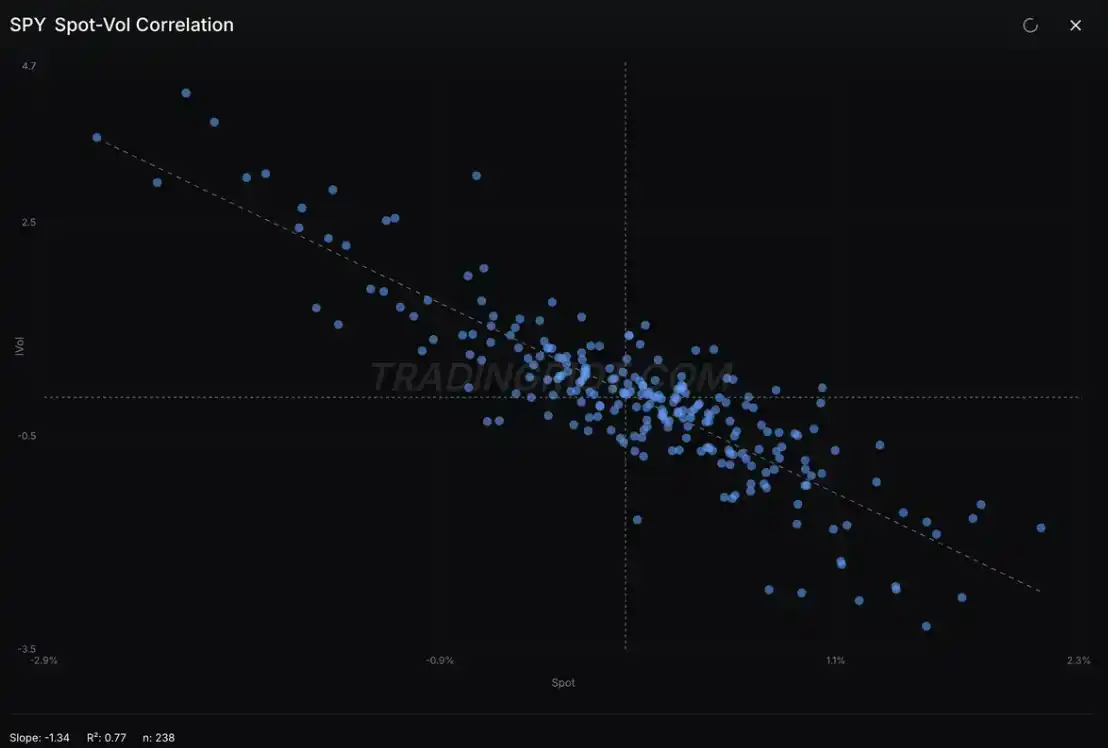
At the same time, the spot-volatility correlation in Bitcoin, while still somewhat messy overall, is increasingly showing characteristics similar to stock indices.
Summary
If you came here for "entry points, stop-loss, take-profit (Entry / SL / TP)," then I can only say sorry to disappoint you (not really that sorry).
The purpose of this analysis was more to clarify a seemingly obvious but often overlooked fact: Bitcoin is an independently operating market. At某些阶段 it looks like gold, at other times like stocks, but fundamentally, there is no necessary reason for them to move in sync over the long term.
If you're staring at the falling price right now, trying to judge when the bottom will appear, rather than applying analogies from other assets, it's better to focus on the data that truly matters to this market. Look at the positioning structure—it often tells the most真实, and also the most残酷, story.
Also remember: most true bottoms are formed when almost everyone has already given up.