Bitcoin: This Crypto Strategist Foresees A BTC Price Reversal Soon

newsbtcPubblicato 2023-01-06Pubblicato ultima volta 2023-01-11

Introduzione

Bitcoin analysts are following up on BTC price trends as the 2022 bear market drags into the beginning of 2023.

Bitcoin analysts are following up on BTC price trends as the 2022 bear market drags into the beginning of 2023. The crypto market is slightly recovering from the FTX fiasco that caused most of the crypto assets to plunge. According to a famous crypto analyst, Kelvin Svenson, one technical indicator could end Bitcoin’s bear market.

In a video update, Svenson noted that BTC’s weekly relative strength index (RSI) is about to break out from its diagonal resistance. The RSI measures the ratio of ups and downs movements in the crypto market.

As per Svenson, this movement suggests that BTC bulls have started to gather momentum. Furthermore, he noted that the two-year-long market downtrend could end if an RSI breakout occurs.

Svenson explained the importance of a potential RSI breakout in his video update. Following his prediction, there could be a significant trend shift for BTC if the RSI breakout occurs in the next couple of weeks.

Svenson’s Prediction And Bitcoin Price Outlook

Svenson cited a weekly RSI breakout towards the end of the BTC bear market in 2018. Pointing at the BTC diagonal resistance line, he added that the market gets bullish once the RSI pops above the resistance level.

Given the momentum with which the weekly RSI is coming up, the crypto analyst says BTC is heading toward a significant bull run.

Bitcoin is currently trading at $16,831, but Svenson predicts that BTC may rally to $21,000 if the RSI exceeds its long-term resistance. Bitcoin’s current price indicates a potential rise of 25% if it reaches $21,000, which Svenson predicted.

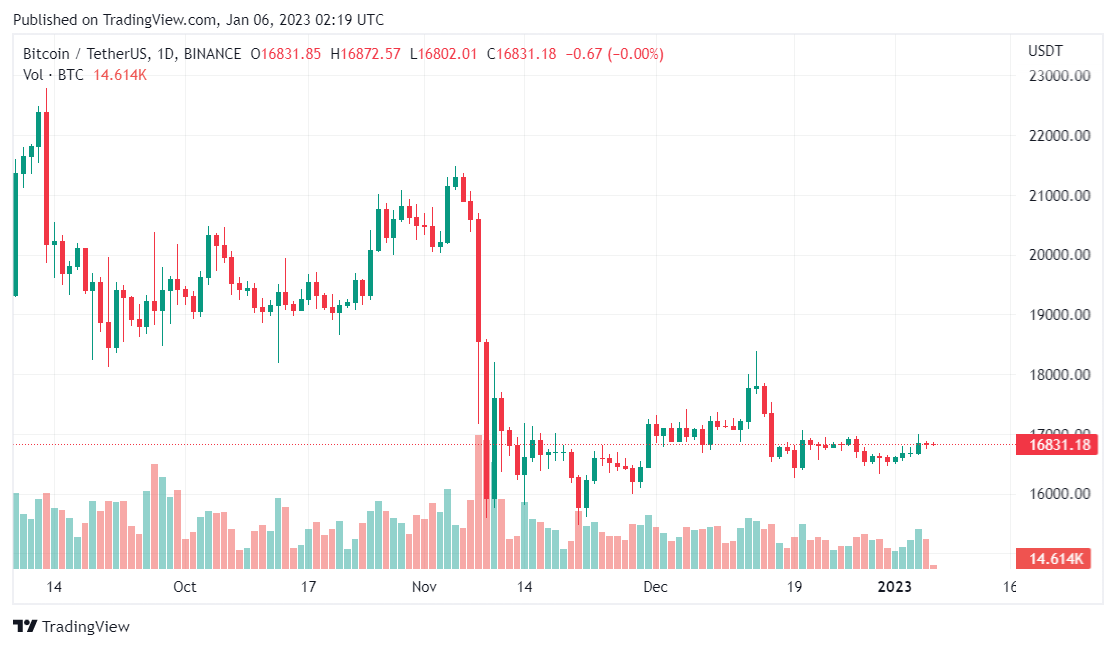
The year 2022 marked the beginning of a new bear market for Bitcoin and the entire cryptocurrencies. Bitcoin declined nearly 75% since its all-time high of $69,000 in 2021.

Many analysts made different predictions for Bitcoin prices in 2022. For example, at a tech conference in Amsterdam in 2018, Tim Draper predicted that Bitcoin would reach $250,000 by the end of 2022. However, when 2022 finally came, Bitcoin price turned opposite Draper’s prediction.

The asset plunged below the $20k mark and hit $16,441 in November after the FTX crisis, but it is now moving toward the $17,000 mark and will likely cross it if the bulls stay intact.

Michael Van De Poppe Releases Bullish BTC Price Prediction For 2023

As the new year unfolds, other analysts besides Svesons have projected a new outlook for BTC in 2023. For example, Michael van de Poppe has made a new prediction for BTC prices in 2023. According to the analyst, BTC will experience a massive price surge in the coming months.

De Poppe predicts a rally between $30,000 and $35,000 as the U.S. Federal Reserve pauses interest rate hikes and reduce inflation. He also made peak high predictions for BTC’s 2023 bull cycle between $275,000 and $350,000.

Letture associate

Bitcoin Trading Strategy Breakdown: Celebrity Predictions and Classic Models All Fail, Only These Four Indicators Remain

Analysis of Bitcoin Trading Strategies: Why Celebrity Forecasts and Classic Models Fail, Leaving Only These Four Reliable Indicators This analysis examines the failure of common Bitcoin prediction methods and identifies four reliable indicators for constructing a trading strategy. The author reviewed all major BTC prediction approaches from 2017-2025, categorizing them into three groups: celebrity price targets (consistently over-optimistic), analytical models like Stock-to-Flow (broken post-2022), and on-chain signals. The key finding is that more data often creates confusion, not clarity. The strategy discards unreliable elements: celebrity predictions (incentivized to be extreme), pure models (invalidated by post-ETF market changes), and the Fear & Greed Index used alone (too many false signals). Four reliable indicators were selected: 1. **MVRV Z-Score:** Accurately identifies cycle bottoms when entering its green zone (e.g., 2018, 2020, 2022). Note: Its ability to call tops is now ineffective post-2024. 2. **SOPR (28-day MA):** Consistently signals bottoms when below 1.0, indicating holders are selling at a loss. 3. **ETF Net Flow:** A crucial post-2024 metric showing institutional momentum (e.g., sustained inflows = buying). 4. **Macro Liquidity (Fed policy & M2):** Sets the overall directional bias (e.g., bullish during easing cycles). The core strategy involves waiting for a multi-signal共振 (resonance). For example, a bottom signal requires MVRV in the green zone + SOPR < 1.0. A top signal requires overheated on-chain data + sustained ETF outflows. Macro policy sets the overall direction. The Fear & Greed Index is only used as a weighted confirmatory signal, never alone. Action is only taken when three or more indicators align. The author automated this into a monitoring system that sends Telegram alerts only when signals trigger. As of the article's date (April 15, 2026), the system showed a strong bottom signal: extreme fear (F&G=12), MVRV in the buy zone, and SOPR < 1.0. The only contrary signal was weak ETF flows. Historically, such triple on-chain共振 has preceded 100%+ returns. The conclusion emphasizes building a personal framework over relying on external predictions, allowing for iterative improvement and customization based on individual risk tolerance.

marsbit2 h fa

Bitcoin Trading Strategy Breakdown: Celebrity Predictions and Classic Models All Fail, Only These Four Indicators Remain

marsbit2 h fa

Trading

Spot
Futures
活动图片