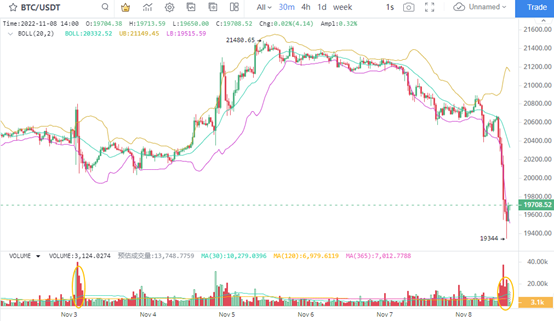
1. BTC broke down
The short-term 30 minute K line chart shows that BTC's decline speed is very fast, and the continuous volume is longer than 3 hours, making the price easily retreat to below 20000 dollars. In fact, this BTC short-term pullback is more obvious than the price pullback on November 3, indicating that the short-term long short balance is being rapidly broken. This shows that BTC may break the long short balance within two months in the short term and confirm the direction of breakthrough.
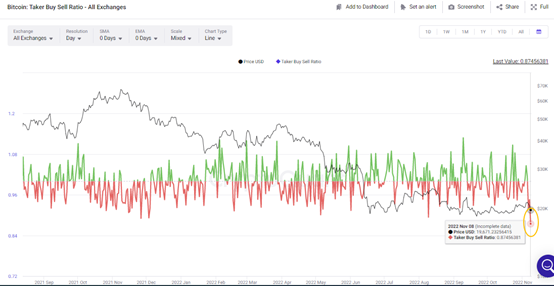
2. BTC multiple air ratio decreases significantly
The long short ratio of BTC dropped significantly to 0.882 on November 8, which is the recent low and the lowest value after November 3, 2021. The strength of long and short positions changes rapidly and is linked with the breaking down of BTC price, indicating that the short-term downward trend of price is more significant.
On the news side, due to the impact of the cash withdrawal run on November 7 of FTT, FTT once collapsed on November 8, and FTX may still face challenges in the future. At the same time, BTC was affected by bad news, the contract long short ratio decreased and the currency price withdrew significantly, which reflected a significant change in the short-term trading tendency of investors.
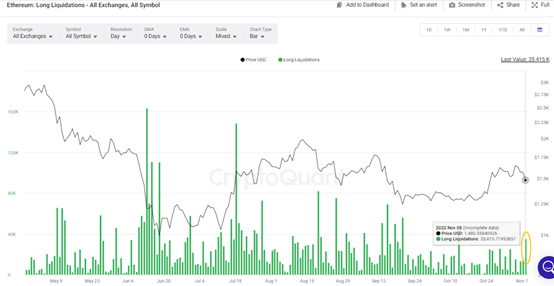
3. Increase of ETH long position explosion
From the perspective of the size of the long position explosion, the number of ETH long positions has reached a short-term peak of 35400 ETHs on November 8 in the process of continuous reduction in the number of ETH long positions. This shows that after the market suddenly accelerated and fell back, the long positions reached more than $53 million, indicating that the ETH price weakened at a faster pace. In the next trading day, we also need to pay attention to the risk of price correction and the supporting effect above $1200.
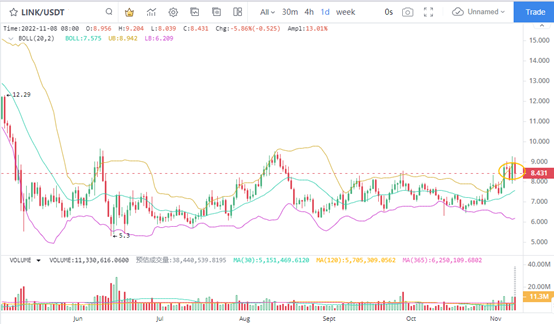
4. LINK main transaction growth
LINK's recent price performance has been relatively strong, and it did not continue to retreat significantly during the sideways trading period. The daily K line chart shows that the LINK price has reached the peak level since May. Although the price did not break through upward, the price performance was significantly stronger than that of most mainstream currencies. Judging from this, we can focus on the recent price performance.
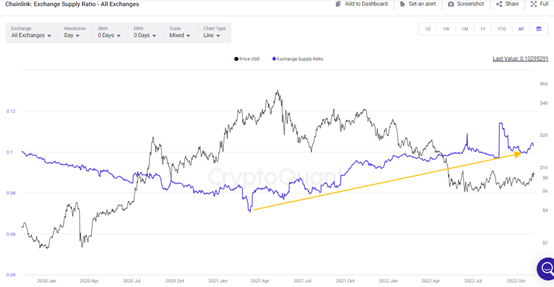
5. The main transactions of LINK account for a large proportion
The number of transactions of LINK on the exchange grew steadily, making the proportion of the total token supply continue to rise. In terms of value, from March 2021, the proportion of LINK transactions rose from a low level of 0.07 to 0.1 in November 2022. At the same time, the peak transaction proportion in 2022 reached 0.11. In this sense, the turnover of LINK is quite sufficient, especially in the past six months, when the proportion of transactions has been high, the turnover rate of LINK has increased, and the low cost may support the stable recovery of LINK prices.