[Key interpretation] The selling pressure on BTC's stolen currency account dropped, and the main players of RARI reduced their positions

HuobiPubblicato 2022-11-01Pubblicato ultima volta 2022-11-03

Introduzione

RARI soared by 100% in the short term, and its main position was reduced.

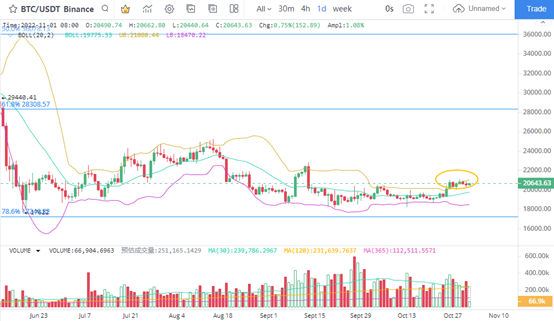
1. BTC is expected to accelerate recovery

The daily K line chart shows that after the BTC price has been slightly adjusted, the rebound trend is about to start again. As the trading volume continues to operate at a high level, the support change of BTC price at $20000 is extremely effective. In terms of pressure level, $22500 and $25000 are the breakthrough points that BTC needs to confirm.

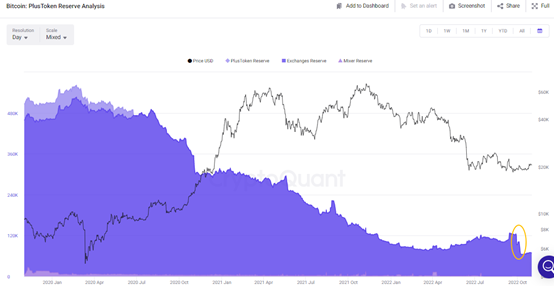
2. BTC pressure drop

BTC maintains a strong foundation, which is due to the corresponding reduction of selling pressure and the continuous growth of bulls' strength. Judging from the signs of reduced selling pressure, the mixed currency and sales of Plustoken accounts have increased significantly in recent years, which has greatly reduced the number of stolen BTCs. From 124649 BTCs to 63434 BTCs, the number of BTCs decreased by more than 50000. Therefore, after the corresponding BTC trade sell-off decreased, the BTC price bottomed out and recovered. It is noteworthy that recently, the number of BTCs used for trading in Plustoken accounts has decreased significantly, and the stock BTCs have dropped to a historical low. The pressure to raise prices has decreased, and the expectation of price increases has been concerned.

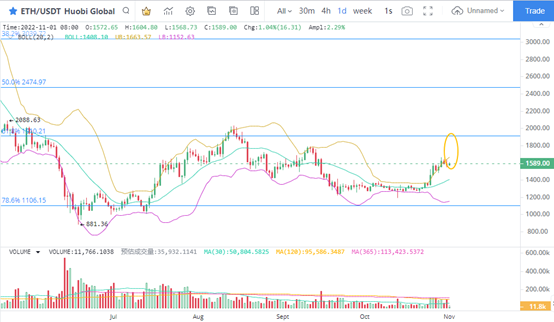
3. ETH ready for lifting

The daily K line chart shows that the ETH price is in the position of secondary recovery, and the price may rise at any time. At present, there is limited room for ETH to retreat in the short term. The price has retreated by 4% in only two trading days, and it has begun to show signs of stopping falling. Judging from the current operating range of ETH, the important pressure level for short-term rise is USD 1910. The 61.8% of Fibonacci's corresponding US $1910 sell-off has been reflected in the start of ETH pullback on August 13. Therefore, wait until the ETH price increases by more than 20% before focusing on important selling changes.

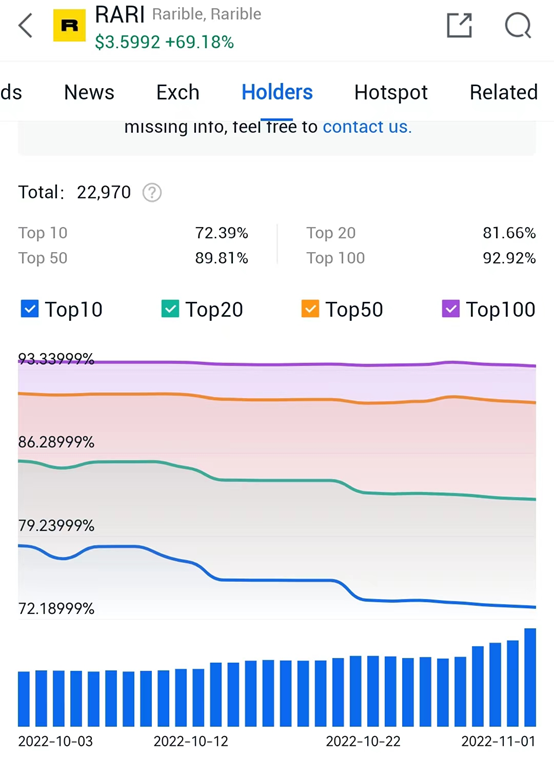
4. Confirmation of RARI's main position reduction trend

With RARI soaring to 70% at a low level and up to 100% within the maximum 2 days, RARI has ranked first in terms of growth. At the same time, it is noted that there is more room for the trading volume of RARI to be amplified, and it is also a second pulse of volume expansion. It does not rule out that the trading volume is insufficient after the short-term surge of RARI. In fact, the K Line has raised the signal of selling off growth in 30 minutes, focusing on the performance of price correction.

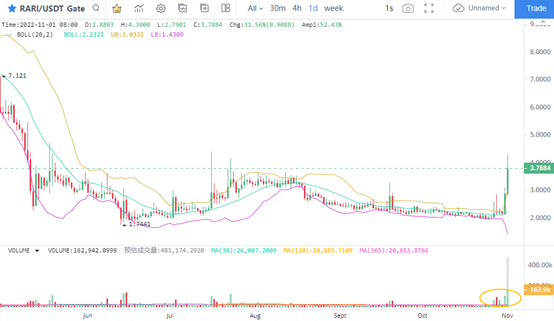
5. RARI's main position reduction

In terms of the number of coins held, RARI's top 10 main players have a clear trend of reducing their positions. From 77.49% on October 3 to 72.19% on November 1, the decline reached 5.3 percentage points. Therefore, the basic judgment on the price rise of RARI may first focus on the change of selling pressure, and then on the opportunity of low absorption.

Letture associate

Bitcoin Trading Strategy Breakdown: Celebrity Predictions and Classic Models All Fail, Only These Four Indicators Remain

Analysis of Bitcoin Trading Strategies: Why Celebrity Forecasts and Classic Models Fail, Leaving Only These Four Reliable Indicators This analysis examines the failure of common Bitcoin prediction methods and identifies four reliable indicators for constructing a trading strategy. The author reviewed all major BTC prediction approaches from 2017-2025, categorizing them into three groups: celebrity price targets (consistently over-optimistic), analytical models like Stock-to-Flow (broken post-2022), and on-chain signals. The key finding is that more data often creates confusion, not clarity. The strategy discards unreliable elements: celebrity predictions (incentivized to be extreme), pure models (invalidated by post-ETF market changes), and the Fear & Greed Index used alone (too many false signals). Four reliable indicators were selected: 1. **MVRV Z-Score:** Accurately identifies cycle bottoms when entering its green zone (e.g., 2018, 2020, 2022). Note: Its ability to call tops is now ineffective post-2024. 2. **SOPR (28-day MA):** Consistently signals bottoms when below 1.0, indicating holders are selling at a loss. 3. **ETF Net Flow:** A crucial post-2024 metric showing institutional momentum (e.g., sustained inflows = buying). 4. **Macro Liquidity (Fed policy & M2):** Sets the overall directional bias (e.g., bullish during easing cycles). The core strategy involves waiting for a multi-signal共振 (resonance). For example, a bottom signal requires MVRV in the green zone + SOPR < 1.0. A top signal requires overheated on-chain data + sustained ETF outflows. Macro policy sets the overall direction. The Fear & Greed Index is only used as a weighted confirmatory signal, never alone. Action is only taken when three or more indicators align. The author automated this into a monitoring system that sends Telegram alerts only when signals trigger. As of the article's date (April 15, 2026), the system showed a strong bottom signal: extreme fear (F&G=12), MVRV in the buy zone, and SOPR < 1.0. The only contrary signal was weak ETF flows. Historically, such triple on-chain共振 has preceded 100%+ returns. The conclusion emphasizes building a personal framework over relying on external predictions, allowing for iterative improvement and customization based on individual risk tolerance.

marsbit1 h fa

Bitcoin Trading Strategy Breakdown: Celebrity Predictions and Classic Models All Fail, Only These Four Indicators Remain

marsbit1 h fa

Trading

Spot
Futures
活动图片