孙宇晨:HT相比BNB 价值被严重低估

ArlesPubblicato 2022-10-21Pubblicato ultima volta 2022-10-24

Introduzione

通过三个方面可以看到HT的价值明显被低估了。

10月20日晚,火币全球顾问孙宇晨在Twitter Space直播时,谈到了HT价格。他认为,HT目前的价格相比BNB被严重低估了。低估原因有以下几点:

1

● 二者流通量相当

● 火币对HT有更大的赋能空间

● 热门币如APT在火币交易量较好

1

那真的是这样吗?

1

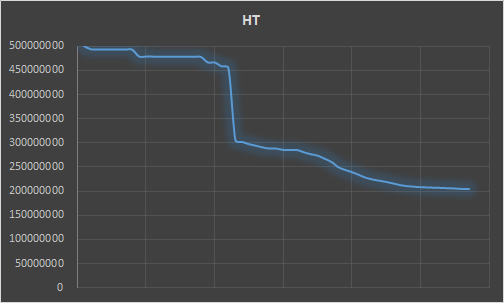
先看下发行量。BNB的总发行量是2亿枚,HT的总发行量是5亿枚,HT在总量上多了3亿枚。但HT通过销毁机制,已经销毁了近3亿枚。从流通的供应量看,HT目前的流通量在1.3亿左右,BNB的流通量是1.6亿,HT流通量比BNB还要少。算上非流通HT,2亿流通对比1.6亿,BNB的价值是270美元,而HT的价格只有7美元,几十倍的差距确实过于悬殊。

1

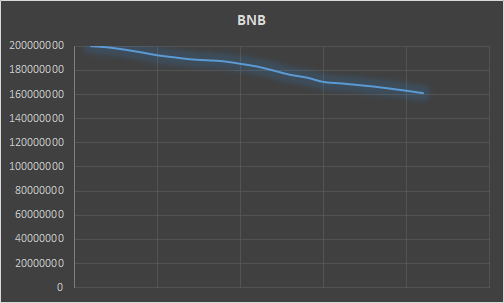
从下面的销毁趋势看,火币在2020年3月大手笔销毁1.5亿枚后,HT的销毁速度明显加快,而BNB的销毁速度则比较平缓。

在赋能上,HT初始发行时,有一部分用于买点卡赠送,还有就是用HT可以购买VIP会员,另外还包括投票上币等。大概从2020年底开始,赋能动作明显减少,加之2021年清退中国用户,HT的赋能动作基本暂停。BNB的赋能则相对连续,这导致BNB价格在2021底出现反弹,进一步拉开了与HT价格的差距。在赋能上HT的力度确实稍差,在发行量和品牌影响力没有太大差距的情况下,如果在赋能上跟进BNB,价格确实有拉近的空间。

1

最后一点可以通过热门币种APT的交易量来看下二者的差距,仅对比最主流交易对APT/USDT,根据Coingecko的数据,币安APT/USDT交易对最近1天的交易量在1.2亿美元左右,火币APT/USDT交易对最近1天的交易量约在4000万美元,差距仅有3倍。这一差距对应HT和BNB的价格同样不符。

1

下面是孙哥在直播中关于HT的原话,有没有道理大家可以自行判断。

“我个人觉得HT绝对是低估的,因为HT跟BNB的发行量一模一样,都是1.6亿左右。那现在BNB都几百美元了,HT才7-8美元,我觉得还是低估的。虽然币安网络效应很强,但火币也还是不错的交易所。

1

比如说这两天的新币、天王级项目APT,火币也是主战场。所以我觉得从其实某种程度上看HT币价,与火币交易所整体的用户量级,以及HT的深度,资沉,都不是特别匹配,所以还是低估的。

1

并不是忽悠大家买,就是我自己哪怕不是火币顾问,我自己来分析,还是有低估。所以现在买HT绝对是价值投资。我以前知道HT低估的原因,就是因为火币不赋能HT。我现在既然当了火币顾问,就一定确保火币赋能HT。最近开了好几天会,我都强调50次了,公司范围内会拉齐赋能HT的精神,把运营方向掰过来。”

Letture associate

Bitcoin Trading Strategy Breakdown: Celebrity Predictions and Classic Models All Fail, Only These Four Indicators Remain

Analysis of Bitcoin Trading Strategies: Why Celebrity Forecasts and Classic Models Fail, Leaving Only These Four Reliable Indicators This analysis examines the failure of common Bitcoin prediction methods and identifies four reliable indicators for constructing a trading strategy. The author reviewed all major BTC prediction approaches from 2017-2025, categorizing them into three groups: celebrity price targets (consistently over-optimistic), analytical models like Stock-to-Flow (broken post-2022), and on-chain signals. The key finding is that more data often creates confusion, not clarity. The strategy discards unreliable elements: celebrity predictions (incentivized to be extreme), pure models (invalidated by post-ETF market changes), and the Fear & Greed Index used alone (too many false signals). Four reliable indicators were selected: 1. **MVRV Z-Score:** Accurately identifies cycle bottoms when entering its green zone (e.g., 2018, 2020, 2022). Note: Its ability to call tops is now ineffective post-2024. 2. **SOPR (28-day MA):** Consistently signals bottoms when below 1.0, indicating holders are selling at a loss. 3. **ETF Net Flow:** A crucial post-2024 metric showing institutional momentum (e.g., sustained inflows = buying). 4. **Macro Liquidity (Fed policy & M2):** Sets the overall directional bias (e.g., bullish during easing cycles). The core strategy involves waiting for a multi-signal共振 (resonance). For example, a bottom signal requires MVRV in the green zone + SOPR < 1.0. A top signal requires overheated on-chain data + sustained ETF outflows. Macro policy sets the overall direction. The Fear & Greed Index is only used as a weighted confirmatory signal, never alone. Action is only taken when three or more indicators align. The author automated this into a monitoring system that sends Telegram alerts only when signals trigger. As of the article's date (April 15, 2026), the system showed a strong bottom signal: extreme fear (F&G=12), MVRV in the buy zone, and SOPR < 1.0. The only contrary signal was weak ETF flows. Historically, such triple on-chain共振 has preceded 100%+ returns. The conclusion emphasizes building a personal framework over relying on external predictions, allowing for iterative improvement and customization based on individual risk tolerance.

marsbit1 h fa

Bitcoin Trading Strategy Breakdown: Celebrity Predictions and Classic Models All Fail, Only These Four Indicators Remain

marsbit1 h fa

Trading

Spot
Futures
活动图片