1. BTC volume rebound
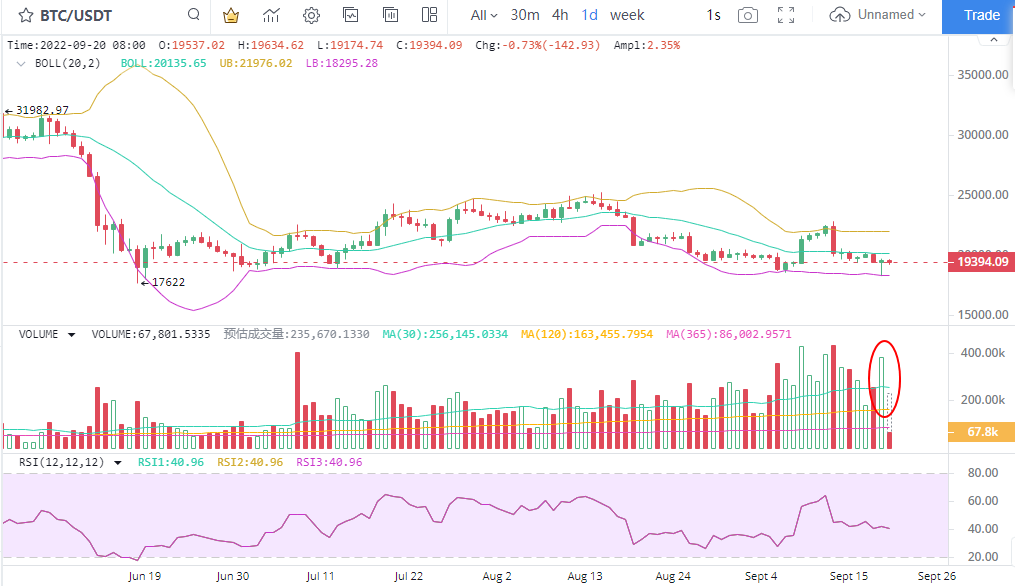
Although BTC is very close to a further decline and a new low, the competition for key points is fierce, and BTC still shows a cross star rebound on the daily K line chart. In terms of trading volume, the trading volume in the daily K line chart rebounded again. The trading volume of BTC in the past two weeks was very strong, and there was an opportunity for repeated price shocks above $18000. On the news side, BTC's rebound strength is still within a small range since the Federal Reserve announced that it would raise interest rates further.
2. Low activity of BTC long-term investors
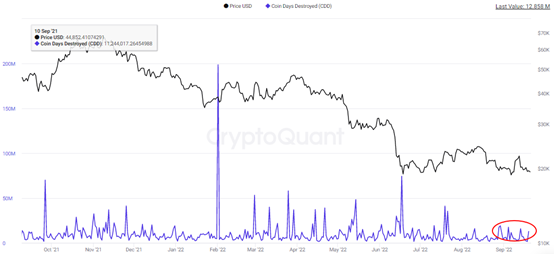
The recent trading trend of long-term investors in BTC is not active, which means that long-term investors have low enthusiasm for BTC trading, and the corresponding selling pressure is limited. Judging from this, BTC short-term support still exists, but it does not rule out the possibility that investors in short-term and medium-term trading panic trading. On the negative side, the dollar index is still at an all-time high, the highest in 20 years. This shows that BTC may be at a disadvantage in terms of competing with the US dollar for liquidity, and its impact on the overall price cannot be ignored. It is worth noting that the pace of interest rate increase by the Federal Reserve is still not likely to end, making the strength of the dollar against BTC will not weaken in a short period of time, reducing the possibility of a significant rise in BTC.
3. BTC whale activity increased
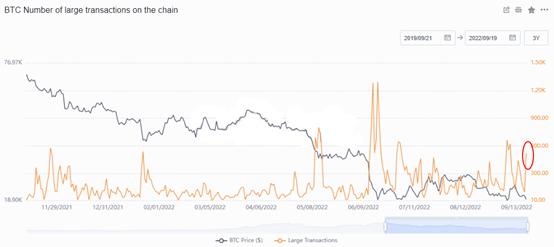
In terms of the trading trend of Jujing, the number of large transactions with more than 500 BTCs rebounded to a high of 526 in a short period of time, amounting to 263000 BTCs. The trading volume of Jujing continued to rebound, and the market was in a state of warming trading heat. In particular, the trend of main players trading at low prices is relatively clear. In terms of fluctuation intensity, BTC's fluctuation intensity is still low in the near future. Investors who scramble for a rebound need to be relatively cautious to avoid losing money during the price pullback.
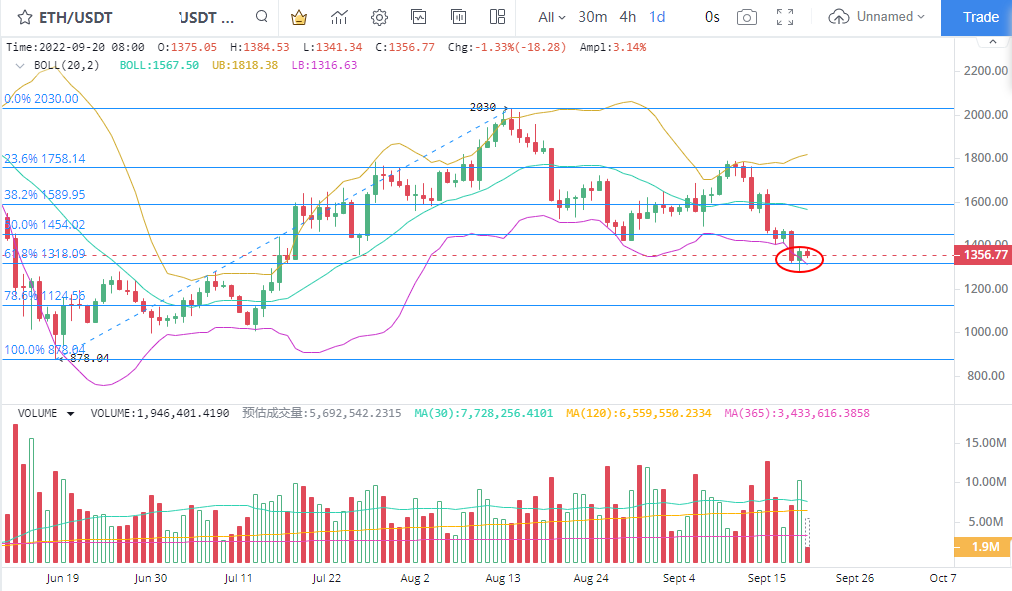
4. ETH touches the support line of the section
In the short term adjustment stage of ETH, the price fell back to the range low of USD 1318 corresponding to 61.8% in Fibonacci. Judging from the current cumulative price pullback, the largest decline reached 37%. At present, the decline is large, and the support can focus on the strength of the price rebound of 1318 dollars. In terms of trend, ETH has a relatively short sideways consolidation time. Whether it can successfully reverse 61.8% in Fibonacci still needs to be observed. In terms of trading volume, the trading volume at the K-line level on the ETH day was stable, and the volume performance on some trading days was relatively low, so the low suction signal was not clear enough, and the risk of holding currency was still high.
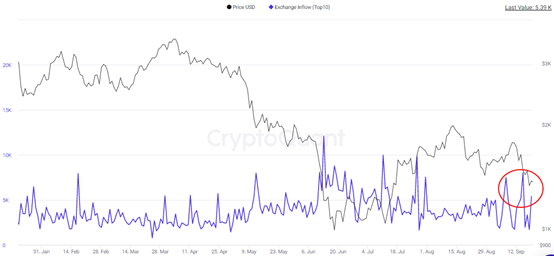
5. ETH's main selling pressure growth
The first 10 transactions flowing into the exchange showed signs of rebound. On September 19, the number reached 5390 ETH, indicating that short-term selling pressure still rebounded. On September 7 and 15, the top ten selling pressures on ETH's exchanges also rebounded similarly, with the number rebounding to 7476 and 8016 ETHs. This shows that the market is still in a state of decline.