Robinhood Layer 2 integration fuels 14% Uniswap price jump

ambcryptoPubblicato 2026-07-03Pubblicato ultima volta 2026-07-03

Introduzione

Uniswap has deployed its V2, V3, V4, and UniswapX protocols on the Robinhood Chain, a new Layer 2 network built by Robinhood Crypto, where Uniswap will serve as the automated market maker (AMM). The integration, aimed at programmatic and AI-driven ecosystems, sparked a 14.2% surge in the UNI token's price and an 81% increase in daily trading volume over 24 hours, buoyed by a broader 2.3% crypto market rally. Technical analysis reveals a contrasting long-term bearish trend. Despite the short-term bounce, the weekly chart shows UNI broke below the key $4 support level, which has now turned into resistance, with a recent swing low at $2.316 in early June. While the RSI has moved above 50, indicating momentum, the On-Balance Volume (OBV) has not recovered to June highs, suggesting a lack of sustained buying pressure. A Fibonacci retracement analysis places the current rally within a broader bearish structure. The liquidation heatmap shows a high concentration of leveraged short positions up to the $3.52 level, increasing the likelihood of a short-term price move towards $3.5. The analysis suggests traders could use a potential bounce to $3.5 or even $3.77 (the 78.6% retracement level) as a selling opportunity. The overall bearish bias remains intact unless UNI breaks above the $4.17 swing high. In summary, while the Robinhood news triggered a rally, it is viewed as a minor rebound within a dominant long-term downtrend.

Uniswap [UNI] announced that it has deployed v2, v3, v4, and UniswapX on the Robinhood Chain. This is a Layer 2 built by Robinhood Crypto, with Uniswap serving as the automated market maker [AMM].

The launch is geared toward programmatic, automated, and AI-driven ecosystems. This news has helped UNI token prices climb by 14.2% in the past 24 hours, and the daily trading volume has spiked by 81%.

The wider crypto market has made a 2.3% bounce in the past 24 hours, helping bolster short-term UNI sentiment. How much higher can this bounce go?

The pessimistic long-term view
Source: UNI/USDT on TradingView

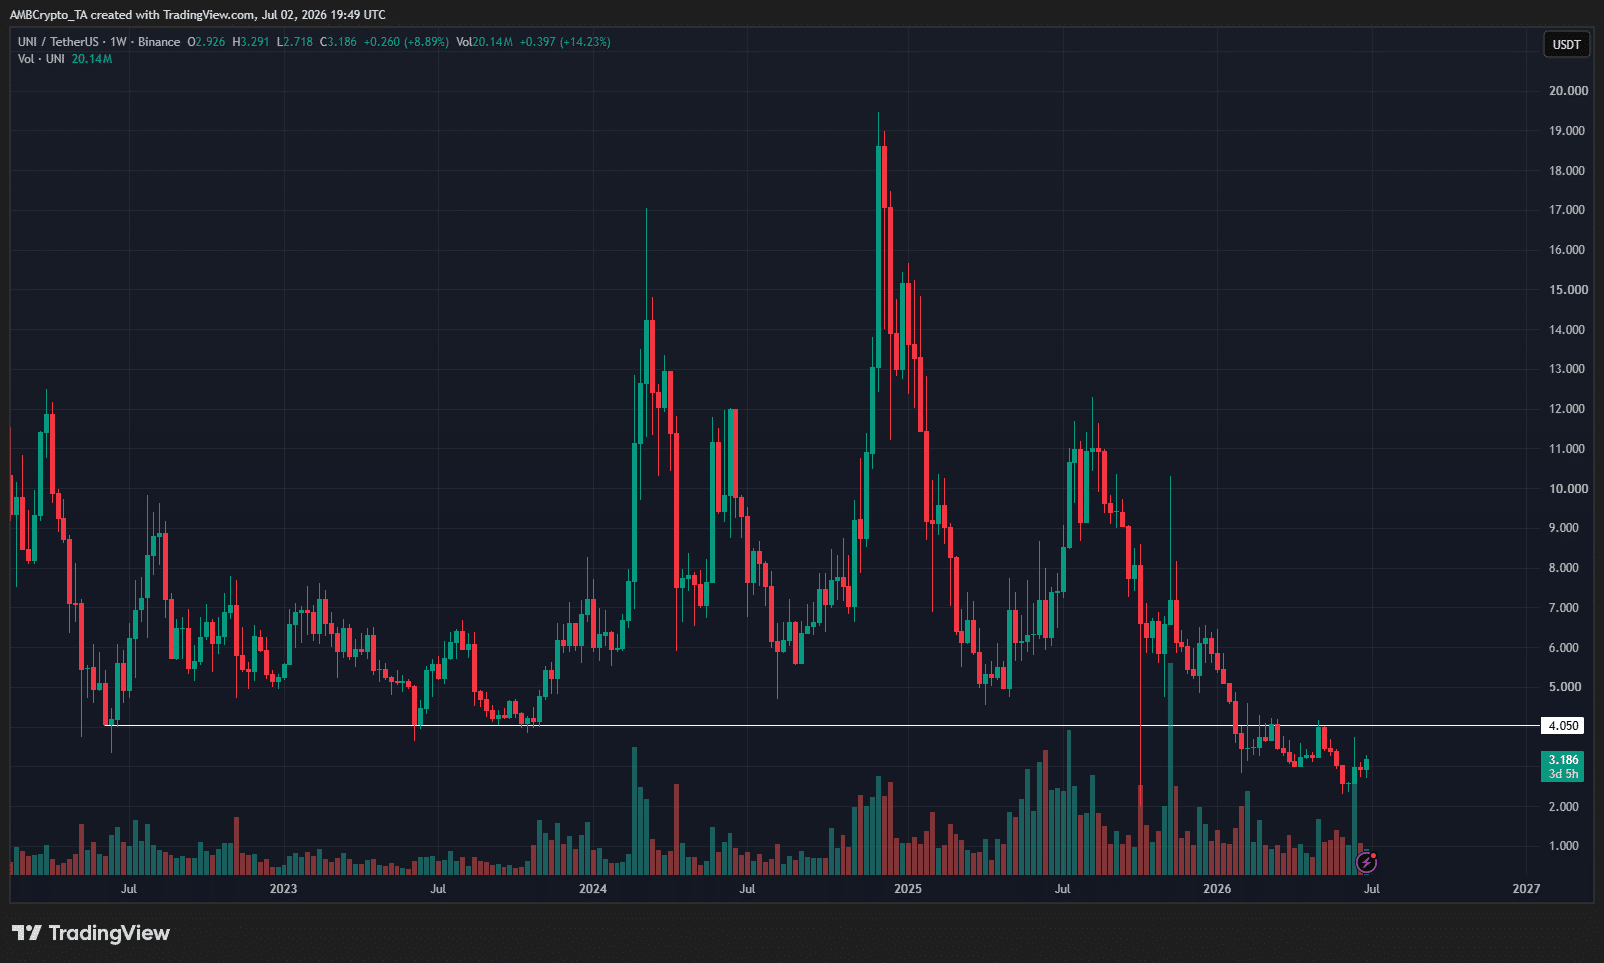
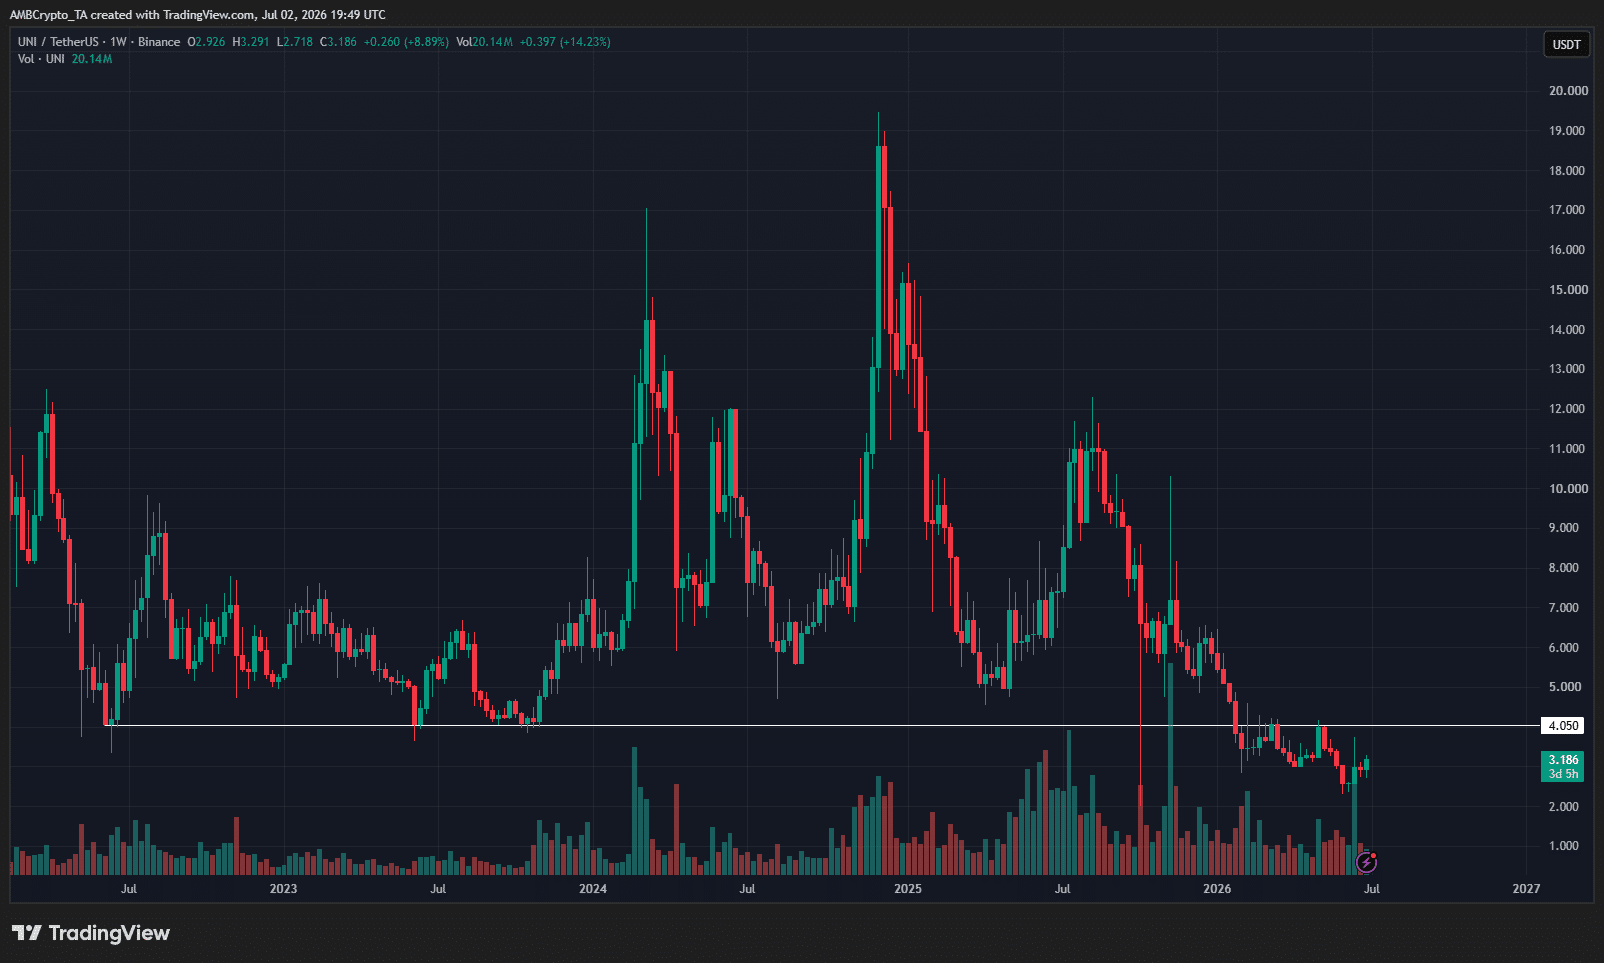
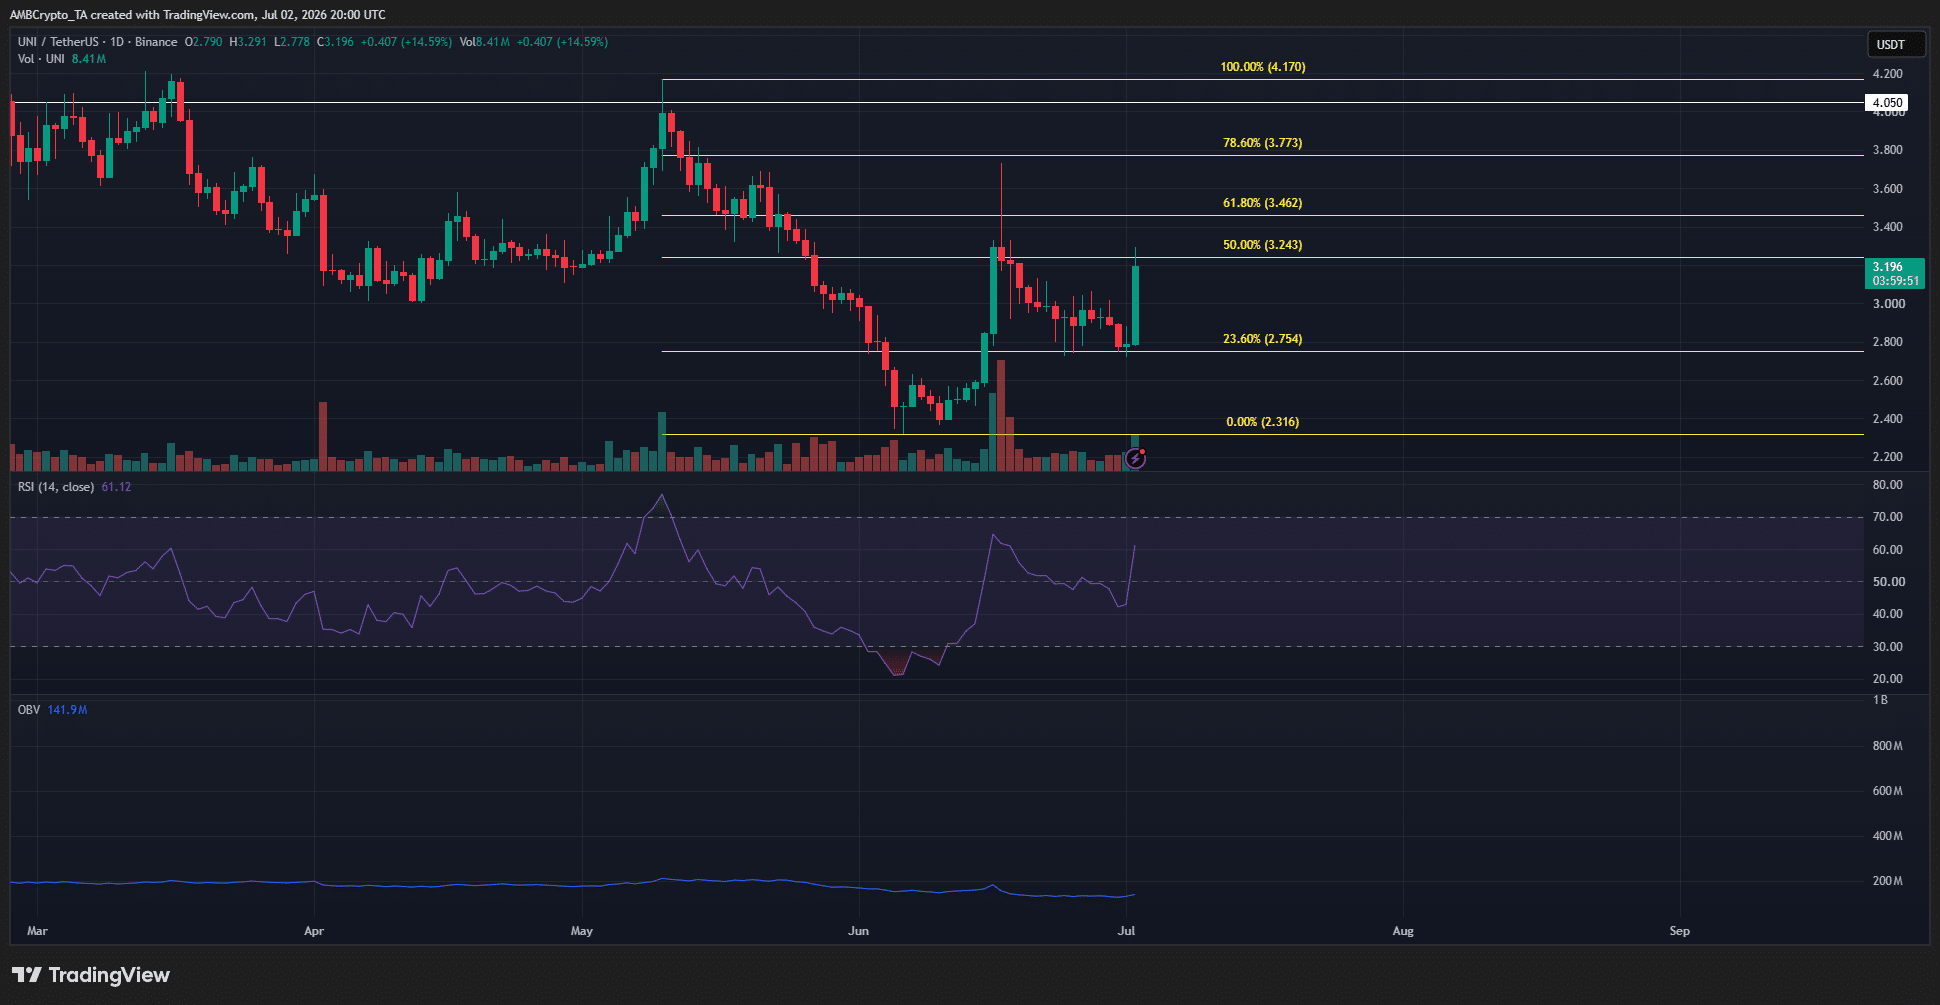
On the 1-week chart, the importance of $4 as a support was made abundantly clear. This level had been defended from June 2022 to January 2026.

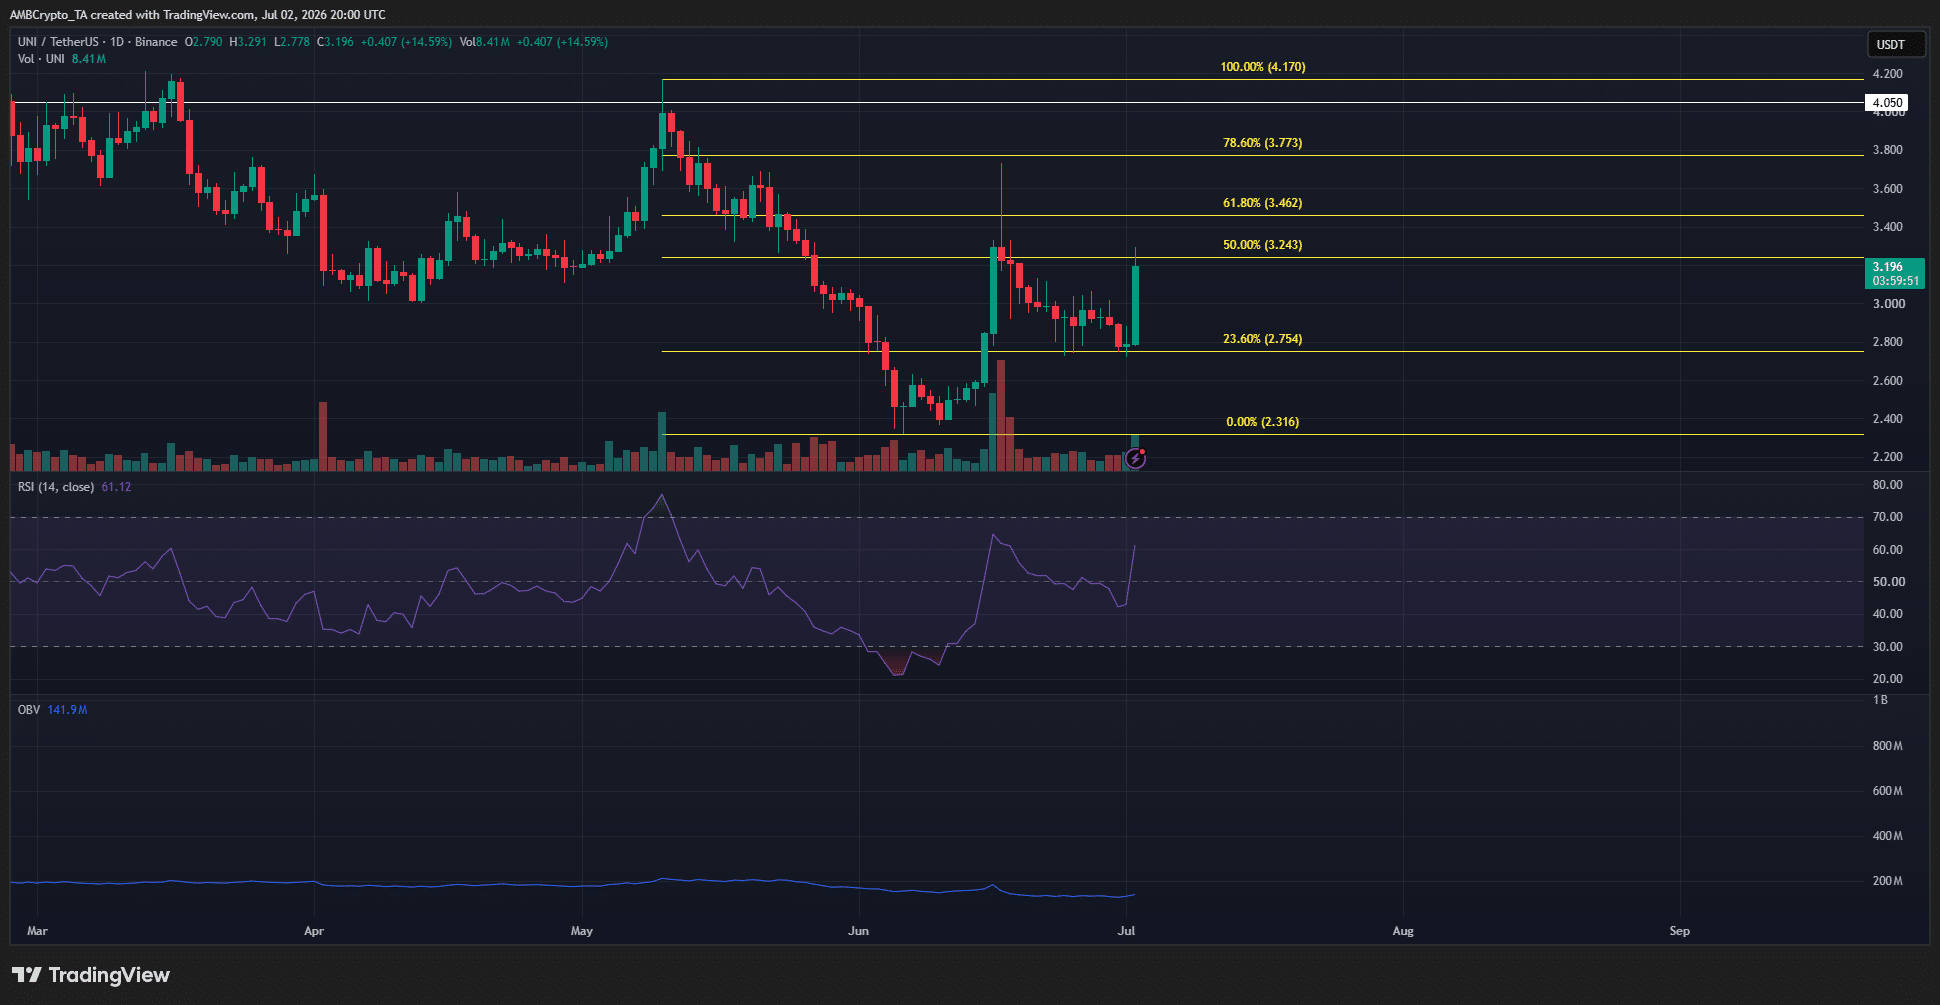
Since then, the DEX’s governance token price slipped below this support and retested it twice as resistance. The latest Uniswap price move down to a swing low of $2.316, made in early June, highlighted the bearish long-term bias.
Source: UNI/USDT on TradingView

A set of Fibonacci retracement levels was plotted using this move downward. The current bounce was operating within the bearish swing structure. Though the RSI managed to cross over above neutral 50, the OBV was unable to approach the highs made in mid-June.

This indicated short-term upward momentum but a lack of sustained buying pressure amidst a longer-term bear trend.

Traders’ call to action- Sell the bounce
Source: CoinGlass

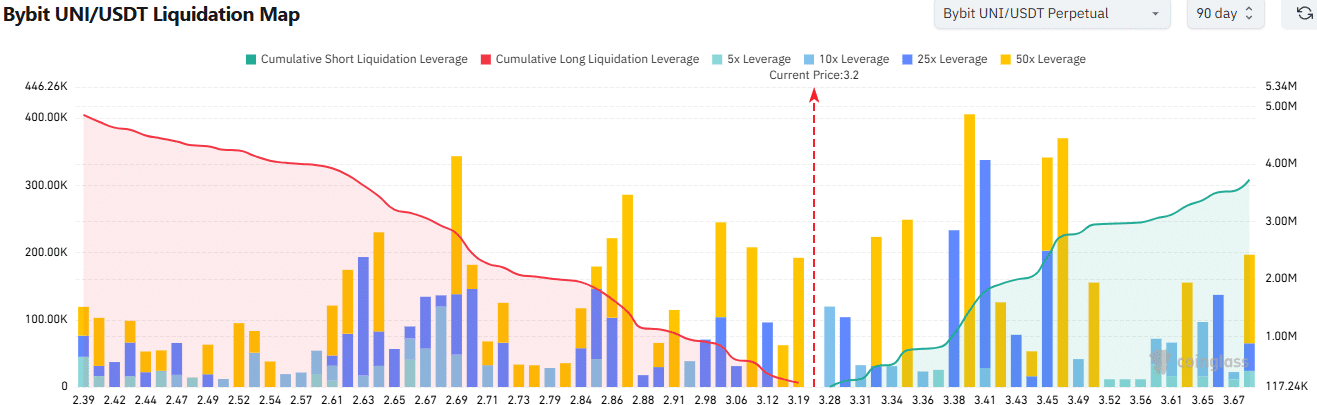
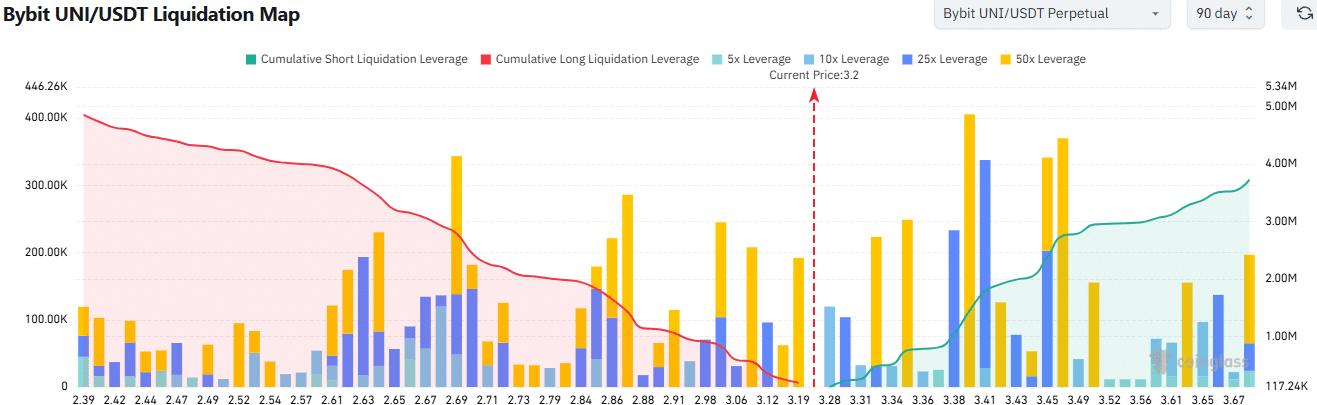
The liquidation map showed a larger cumulative short liquidation leverage piled up overhead, up to $3.52. With a few clusters of high-leverage short positions, the price move toward $3.5 appeared more likely in the short-term based on the chart above.

If Bitcoin [BTC] does not see a swift sell-off in the coming days, there is a chance of a UNI bounce toward $3.5.

Traders can use such a bounce to sell the token, although a move to the 78.6% retracement level at $3.77 can not be ruled out. Overall, swing traders can maintain their bearish bias till the $4.17 swing high is broken.


Final Summary

  • The Robinhood-Uniswap collaboration announcement, alongside a wave of respite across the wider crypto market, has made room for a UNI rally.
  • The long-term Uniswap price trend was severely bearish, and the current bounce was only a minor move within this downtrend.


Crypto di tendenza

Domande pertinenti

QWhat specific announcement was made regarding Uniswap and Robinhood, and what was its immediate impact on the UNI token?

AUniswap announced the deployment of its v2, v3, v4 protocols and UniswapX on the Robinhood Chain, a Layer 2 network built by Robinhood Crypto, where Uniswap serves as the automated market maker (AMM). Following this news, the price of the UNI token climbed by 14.2% and its daily trading volume spiked by 81% in the past 24 hours.

QWhat are the key technical analysis points presented to support the pessimistic long-term view on UNI?

AThe technical analysis points include: 1) The critical $4 support level from June 2022 to January 2026 was broken, and it has since acted as resistance. 2) The price made a recent swing low of $2.316, reinforcing a bearish long-term bias. 3) Fibonacci retracement levels suggest the current bounce is within a larger bearish swing. 4) The On-Balance Volume (OBV) indicator has not reached its mid-June highs, indicating a lack of sustained buying pressure despite short-term upward momentum.

QAccording to the liquidation map, what is a likely short-term price target for UNI, and why?

AA likely short-term price target for UNI is $3.5. The liquidation map shows a significant cumulative volume of high-leverage short liquidations clustered around the $3.52 level, making a move towards $3.5 more probable in the short term.

QWhat trading recommendation is given to traders in the article, and what is the condition for maintaining a bearish bias?

AThe article recommends traders to 'sell the bounce' if UNI moves higher, potentially using a bounce towards $3.5 or possibly $3.77 (the 78.6% Fibonacci retracement level) as selling opportunities. It advises that swing traders can maintain their bearish bias until the $4.17 swing high price level is broken.

QWhat two main factors are summarized as contributing to the UNI price rally?

AThe two main factors summarized as contributing to the UNI price rally are: 1) The announcement of the Robinhood and Uniswap collaboration. 2) A wave of positive momentum (a 2.3% bounce) across the wider cryptocurrency market, providing overall market support.

Letture associate

Want to Get Freebies from Robinhood Chain? Which Ecosystem Projects Are Worth Watching?

**Title: Want to Get the Robinhood Chain Airdrop? Which Ecosystem Projects Are Worth Watching?** **Summary:** Robinhood Chain, a key part of Robinhood's push into Layer 2, aims to build a comprehensive ecosystem covering stock tokens, RWAs, perpetual contracts, and spot trading. With its mainnet launch on July 2, 2026, came a 90-day gas fee waiver for swaps, cross-chain transactions, and Perp trading. While the ecosystem's TVL was still modest at around $76.73 million as of July 6, 2026, several early projects present potential opportunities. Key projects highlighted include: * **Arcus:** A stock token and crypto DEX built by dYdX Labs and Robinhood Crypto, focusing on spot and perpetual contracts. Future ARCUS tokens are expected to prioritize the existing dYdX community. * **Lighter:** A ZK-powered decentralized perpetual and spot exchange deployed on Robinhood Chain. It has committed $11 million worth of LIT tokens to the Robinhood community, with users earning points (and double points via Robinhood Wallet) for trading, convertible to LIT. * **Morpho:** Integral to the newly launched "Robinhood Earn" program in the US, where user-supplied USDG stablecoins are lent out via Morpho vaults, targeting a 7% APY. * **Rialto:** An on-chain spot exchange supporting crypto, stocks, ETFs, and commodities. It will initially list over 90 Robinhood stock tokens and uses a "propAMM" system where market makers provide quotes from their own inventory. * **Arrakis:** A non-custodial, on-chain market maker protocol for token issuers to manage concentrated liquidity on DEXs. * **Meridian:** A platform on Robinhood Chain focusing on RWA perpetual contracts and prediction markets, settled in USDe. It rebranded from Ethereal and had previously planned to allocate 15% of its future governance tokens to ENA stakers. * **Native:** An on-chain price discovery and execution system recently deployed on Robinhood Chain, though the team has stated there are no current plans for a token launch. The article emphasizes that this is not investment advice and urges participants to conduct their own research (DYOR).

Foresight News27 min fa

Want to Get Freebies from Robinhood Chain? Which Ecosystem Projects Are Worth Watching?

Foresight News27 min fa

End of Correction or Continuation of Trend: Technical Structure Review of BTC and HYPE | Guest Analysis

**Weekly Technical Analysis: BTC & HYPE Structure Review** This analysis covers the multi-timeframe technical structure for Bitcoin (BTC) and HYPE. **Bitcoin (BTC) Analysis:** BTC's correction from its May 6 high has formed a clear four-segment pattern on the daily chart. The market is currently in a (3-4) rebound phase. The key determinant for the short-term trend is the endpoint of this rebound ("Endpoint 4"): * **Path 1 (Preferred Scenario):** If the rebound surpasses the $65,700 resistance, subsequent pullbacks are less likely to break the key support at $57,820 (July 1 low). This would suggest a transition into a consolidating range, building energy for a potential bullish reversal. * **Path 2:** Failure to reach $65,700, or even $64,500, increases the probability of a breakdown below $57,820, continuing the downtrend. The 4-hour chart shows a completed five-wave decline from June 15, culminating in a momentum divergence at the low, which supported the recent bounce. **BTC Weekly Outlook & Strategy (Jul 6-12):** * **Core View:** Focus on the high point of the daily rebound from $57,820. * **Key Levels:** * Resistance: $64,500-$65,700; $67,300; $69,500-$71,000. * Support: $60,950-$62,300; $57,820; $55,000. * **Strategy:** * **Mid-term:** Maintain ~20% short position. Consider increasing shorts to <50% if price stalls in the $65,700-$67,300 zone with confirming model signals. * **Short-term:** Use 30% capital for swing trades between support/resistance. * **Plans:** * **Plan A (Short):** Enter shorts (~30%) if price is rejected at $65,700-$67,300. * **Plan B (Long):** Enter longs (~15%) only if price breaks above $65,700 first, then pulls back and finds support near $57,820. **HYPE Analysis:** The rebound from the June 25 low has developed a seven-segment structure on the 4-hour chart. Price is approaching the historical high zone near $76.94. Internal models have triggered top warnings, suggesting caution against chasing the rally and highlighting near-term pullback risks. **HYPE Weekly Outlook & Strategy:** * **Core View:** Observe price action in the $75-$76.94 resistance area. * **Key Levels:** * Resistance: $75-$76.94; $80. * Support: $68; $65.5; $60.5-$61.5. * **Strategy:** Prioritize profit-taking and risk management. If holding longs, consider moving stop-loss to ~$68 to protect gains. Close positions promptly on signs of a downturn. **Trade Recap:** A recent short-term long trade in HYPE, entered at $64 based on model buy signals and exited at ~$70.55 on sell signals, yielded a profit of approximately 10.23%. **General Risk Management:** Always set an initial stop-loss. Move stop-loss to breakeven at +1% profit, and trail it upwards by 1% for every subsequent 1% gain to lock in profits. *Disclaimer: Market conditions change rapidly. All analysis, models, and strategies presented are for educational/log purposes only and do not constitute investment advice. Trade at your own risk.*

Odaily星球日报36 min fa

End of Correction or Continuation of Trend: Technical Structure Review of BTC and HYPE | Guest Analysis

Odaily星球日报36 min fa

Trading

Spot

Articoli Popolari

Come comprare LAYER

Benvenuto in HTX.com! Abbiamo reso l'acquisto di Solayer (LAYER) semplice e conveniente. Segui la nostra guida passo passo per intraprendere il tuo viaggio nel mondo delle criptovalute.Step 1: Crea il tuo Account HTXUsa la tua email o numero di telefono per registrarti il tuo account gratuito su HTX. Vivi un'esperienza facile e sblocca tutte le funzionalità,Crea il mio accountStep 2: Vai in Acquista crypto e seleziona il tuo metodo di pagamentoCarta di credito/debito: utilizza la tua Visa o Mastercard per acquistare immediatamente SolayerLAYER.Bilancio: Usa i fondi dal bilancio del tuo account HTX per fare trading senza problemi.Terze parti: abbiamo aggiunto metodi di pagamento molto utilizzati come Google Pay e Apple Pay per maggiore comodità.P2P: Fai trading direttamente con altri utenti HTX.Over-the-Counter (OTC): Offriamo servizi su misura e tassi di cambio competitivi per i trader.Step 3: Conserva Solayer (LAYER)Dopo aver acquistato Solayer (LAYER), conserva nel tuo account HTX. In alternativa, puoi inviare tramite trasferimento blockchain o scambiare per altre criptovalute.Step 4: Scambia Solayer (LAYER)Scambia facilmente Solayer (LAYER) nel mercato spot di HTX. Accedi al tuo account, seleziona la tua coppia di trading, esegui le tue operazioni e monitora in tempo reale. Offriamo un'esperienza user-friendly sia per chi ha appena iniziato che per i trader più esperti.

305 Totale visualizzazioniPubblicato il 2025.02.11Aggiornato il 2026.06.02

Come comprare LAYER

Discussioni

Benvenuto nella Community HTX. Qui puoi rimanere informato sugli ultimi sviluppi della piattaforma e accedere ad approfondimenti esperti sul mercato. Le opinioni degli utenti sul prezzo di LAYER LAYER sono presentate come di seguito.

活动图片