链上华尔街——普通人如何参与 HTX 的 TradFi 链上化大潮

投研日志Pubblicato 2026-06-18Pubblicato ultima volta 2026-06-18

Introduzione

HTX TradFi的优势在于:所有标的都是永续合约形式,由平台统一提供流动性,不存在底层托管或跨链桥的额外风险,价格透明锚定国际市场。

2024年到2025年,传统金融领域发生了一个重要的变化:越来越多的传统资产开始以代币化的形式出现在链上。

比如,全球最大的资产管理公司贝莱德推出了自己的代币化基金,各大公链上部署的RWA项目总锁仓价值持续增长。高盛、摩根大通等华尔街巨头也纷纷启动了代币化试点项目。

什么意思呢?就是以前你要买美国国债,得去找银行、开账户、换美元,现在你可以直接在链上买到代表美国国债收益权的代币。以前你想投私募股权,门槛动辄百万美元,现在通过代币化,小额也可以参与。

代币化TradFi资产的四种形态

第一类:合规稳定币与国债代币

像USDC、USDT本身就是法币在链上的映射。而更新鲜的是国债代币——比如美国政府短期国债被代币化之后,持有者可以赚到约4-5%的无风险收益,这在DeFi收益波动巨大的今天显得格外有吸引力。

第二类:大宗商品代币化

黄金、白银等贵金属已经有多种链上代币版本,每个代币锚定一盎司的实物黄金,由托管机构持有实物并接受审计。这让你可以像交易山寨币一样交易实物黄金。

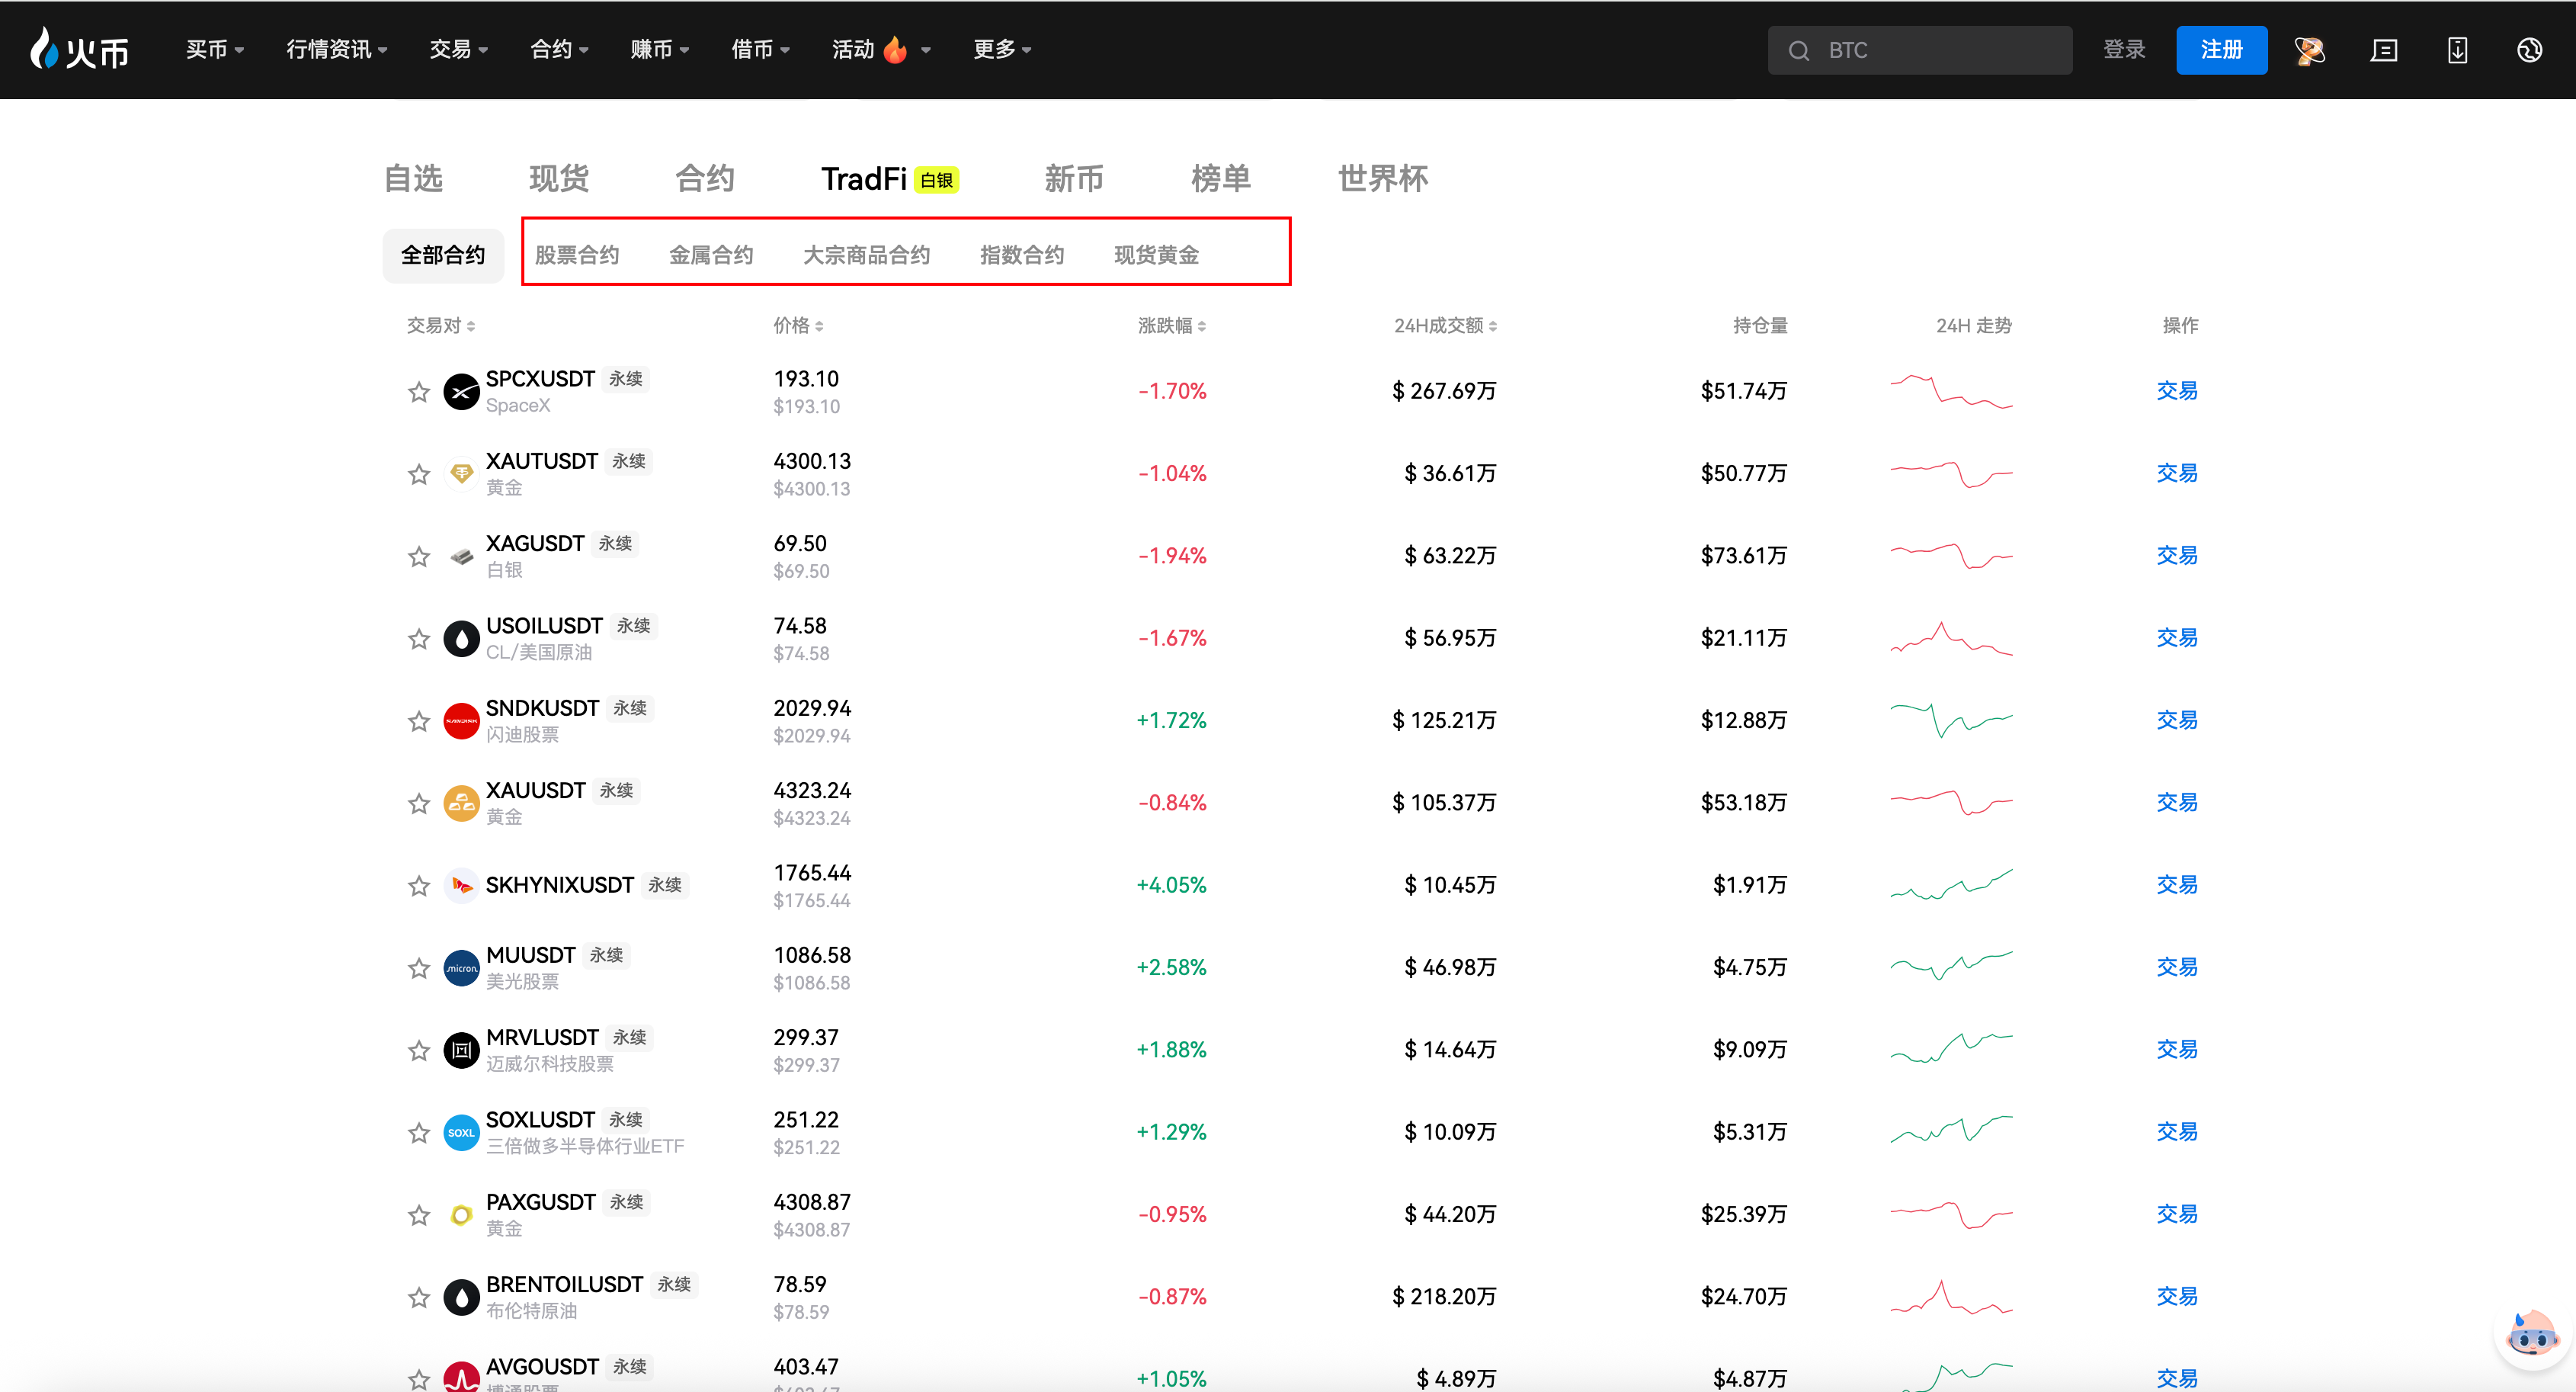
第三类:股票代币化(HTX TradFi正在做的事)

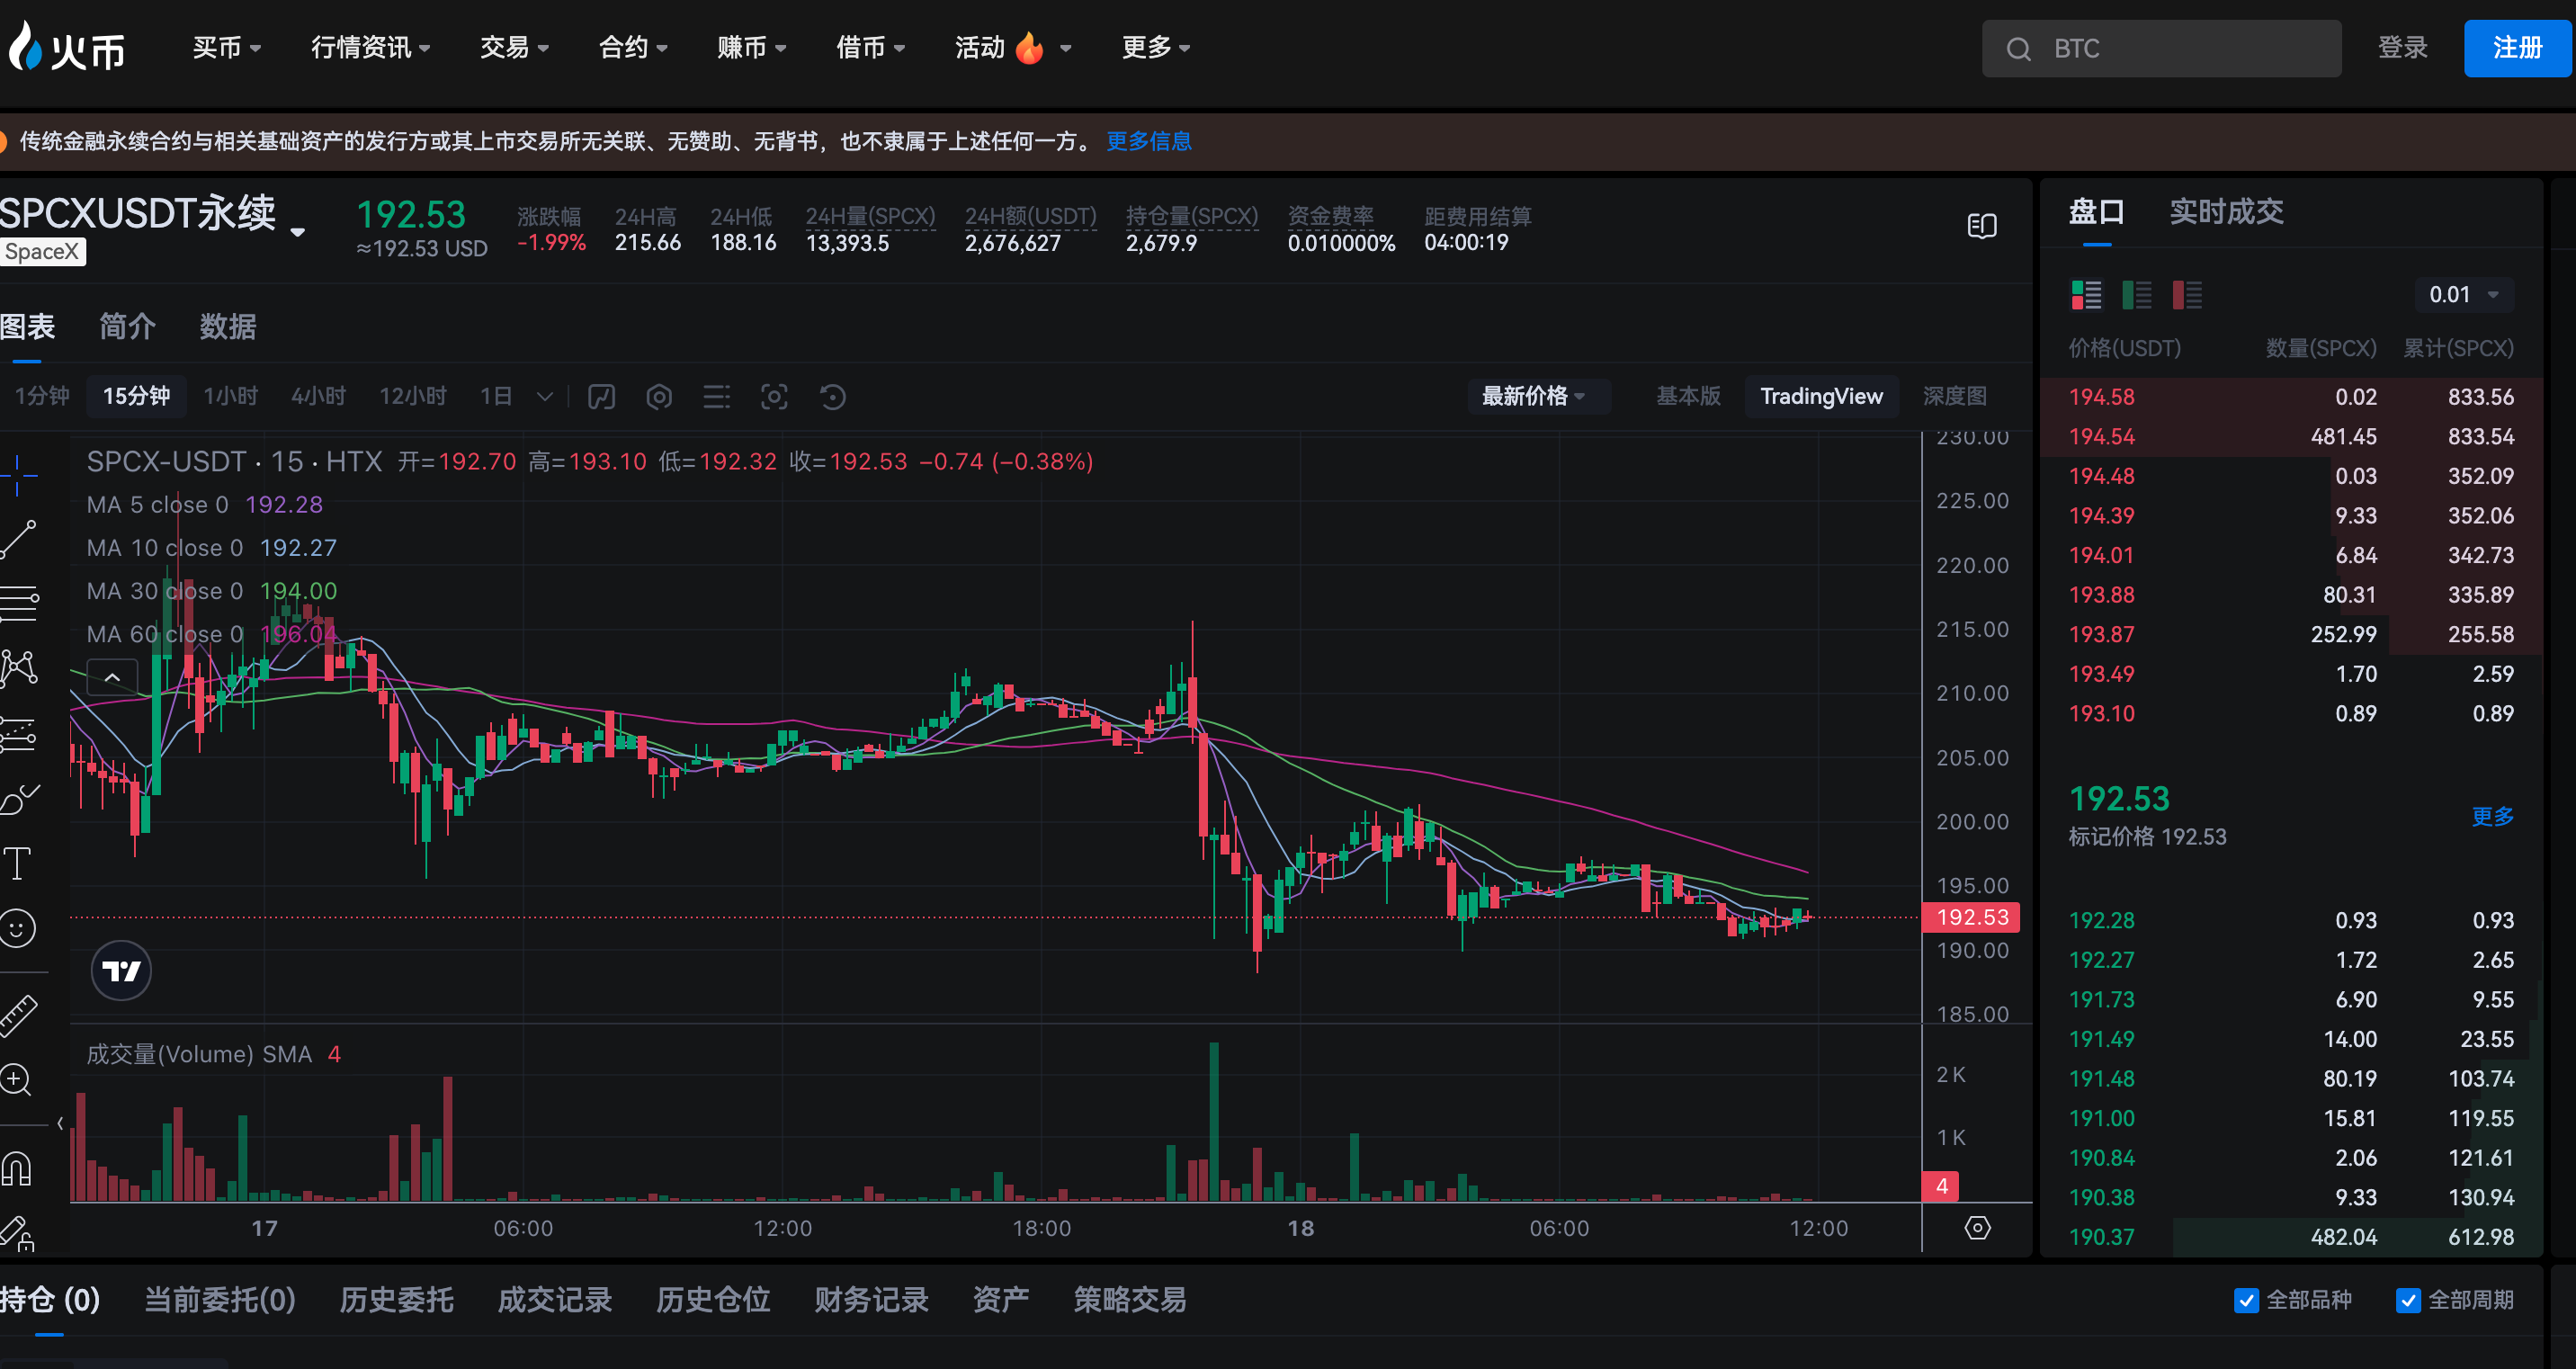
HTX的TradFi专区采取了“永续合约”形式,让用户可以用USDT作为保证金,交易SPX500、NVDA、TSLAX等标的的价格。虽然不是直接持有底层股票,但价格完全锚定对应资产,且拥有24小时交易、支持做多做空、操作体验与加密合约一致等优势。

第四类:私募信贷与另类资产

这部分更进阶一些——包括代币化的私募股权、房地产REITs、基础设施项目等。通过碎片化代币,原本需要百万美元起投的资产变成了普通人也能小额参与的机会。

为什么这很重要?

因为对于普通的Crypto用户来说:

第一,收益来源多元化。 不再只有“持币等涨”和“DeFi挖矿”两条路。你可以配置一部分资金在TradFi资产上,获取与传统经济挂钩的收益。

第二,风险分散工具。 当加密市场进入深熊时,TradFi资产往往表现出完全不同的走势。黄金可能在涨,国债收益可能在升,这些都可以对冲你Crypto仓位的风险。

第三,进入门槛大幅降低。 以前你要在传统券商开户,需要身份认证、银行转账、等待几个工作日。现在在HTX上,只要你有USDT,三秒钟就可以开始交易TradFi资产。

链上TradFi的潜在风险

任何新趋势都有风险,你需要了解这几点:

  • 流动性风险:部分代币化资产交易量较小,买卖价差可能较大
  • 托管风险:锚定实物资产的代币,依赖底层托管机构的信用
  • 监管不确定性:各国对RWA的监管政策仍在变化中
  • 协议风险:如果涉及跨链桥或智能合约,存在技术风险

HTX TradFi的优势在于:所有标的都是永续合约形式,由平台统一提供流动性,不存在底层托管或跨链桥的额外风险,价格透明锚定国际市场。

实操:如何在HTX体验TradFi链上交易?

第一步:打开HTX App,确保账户中有USDT

第二步:进入“合约”页面,点击顶部“TradFi”标签

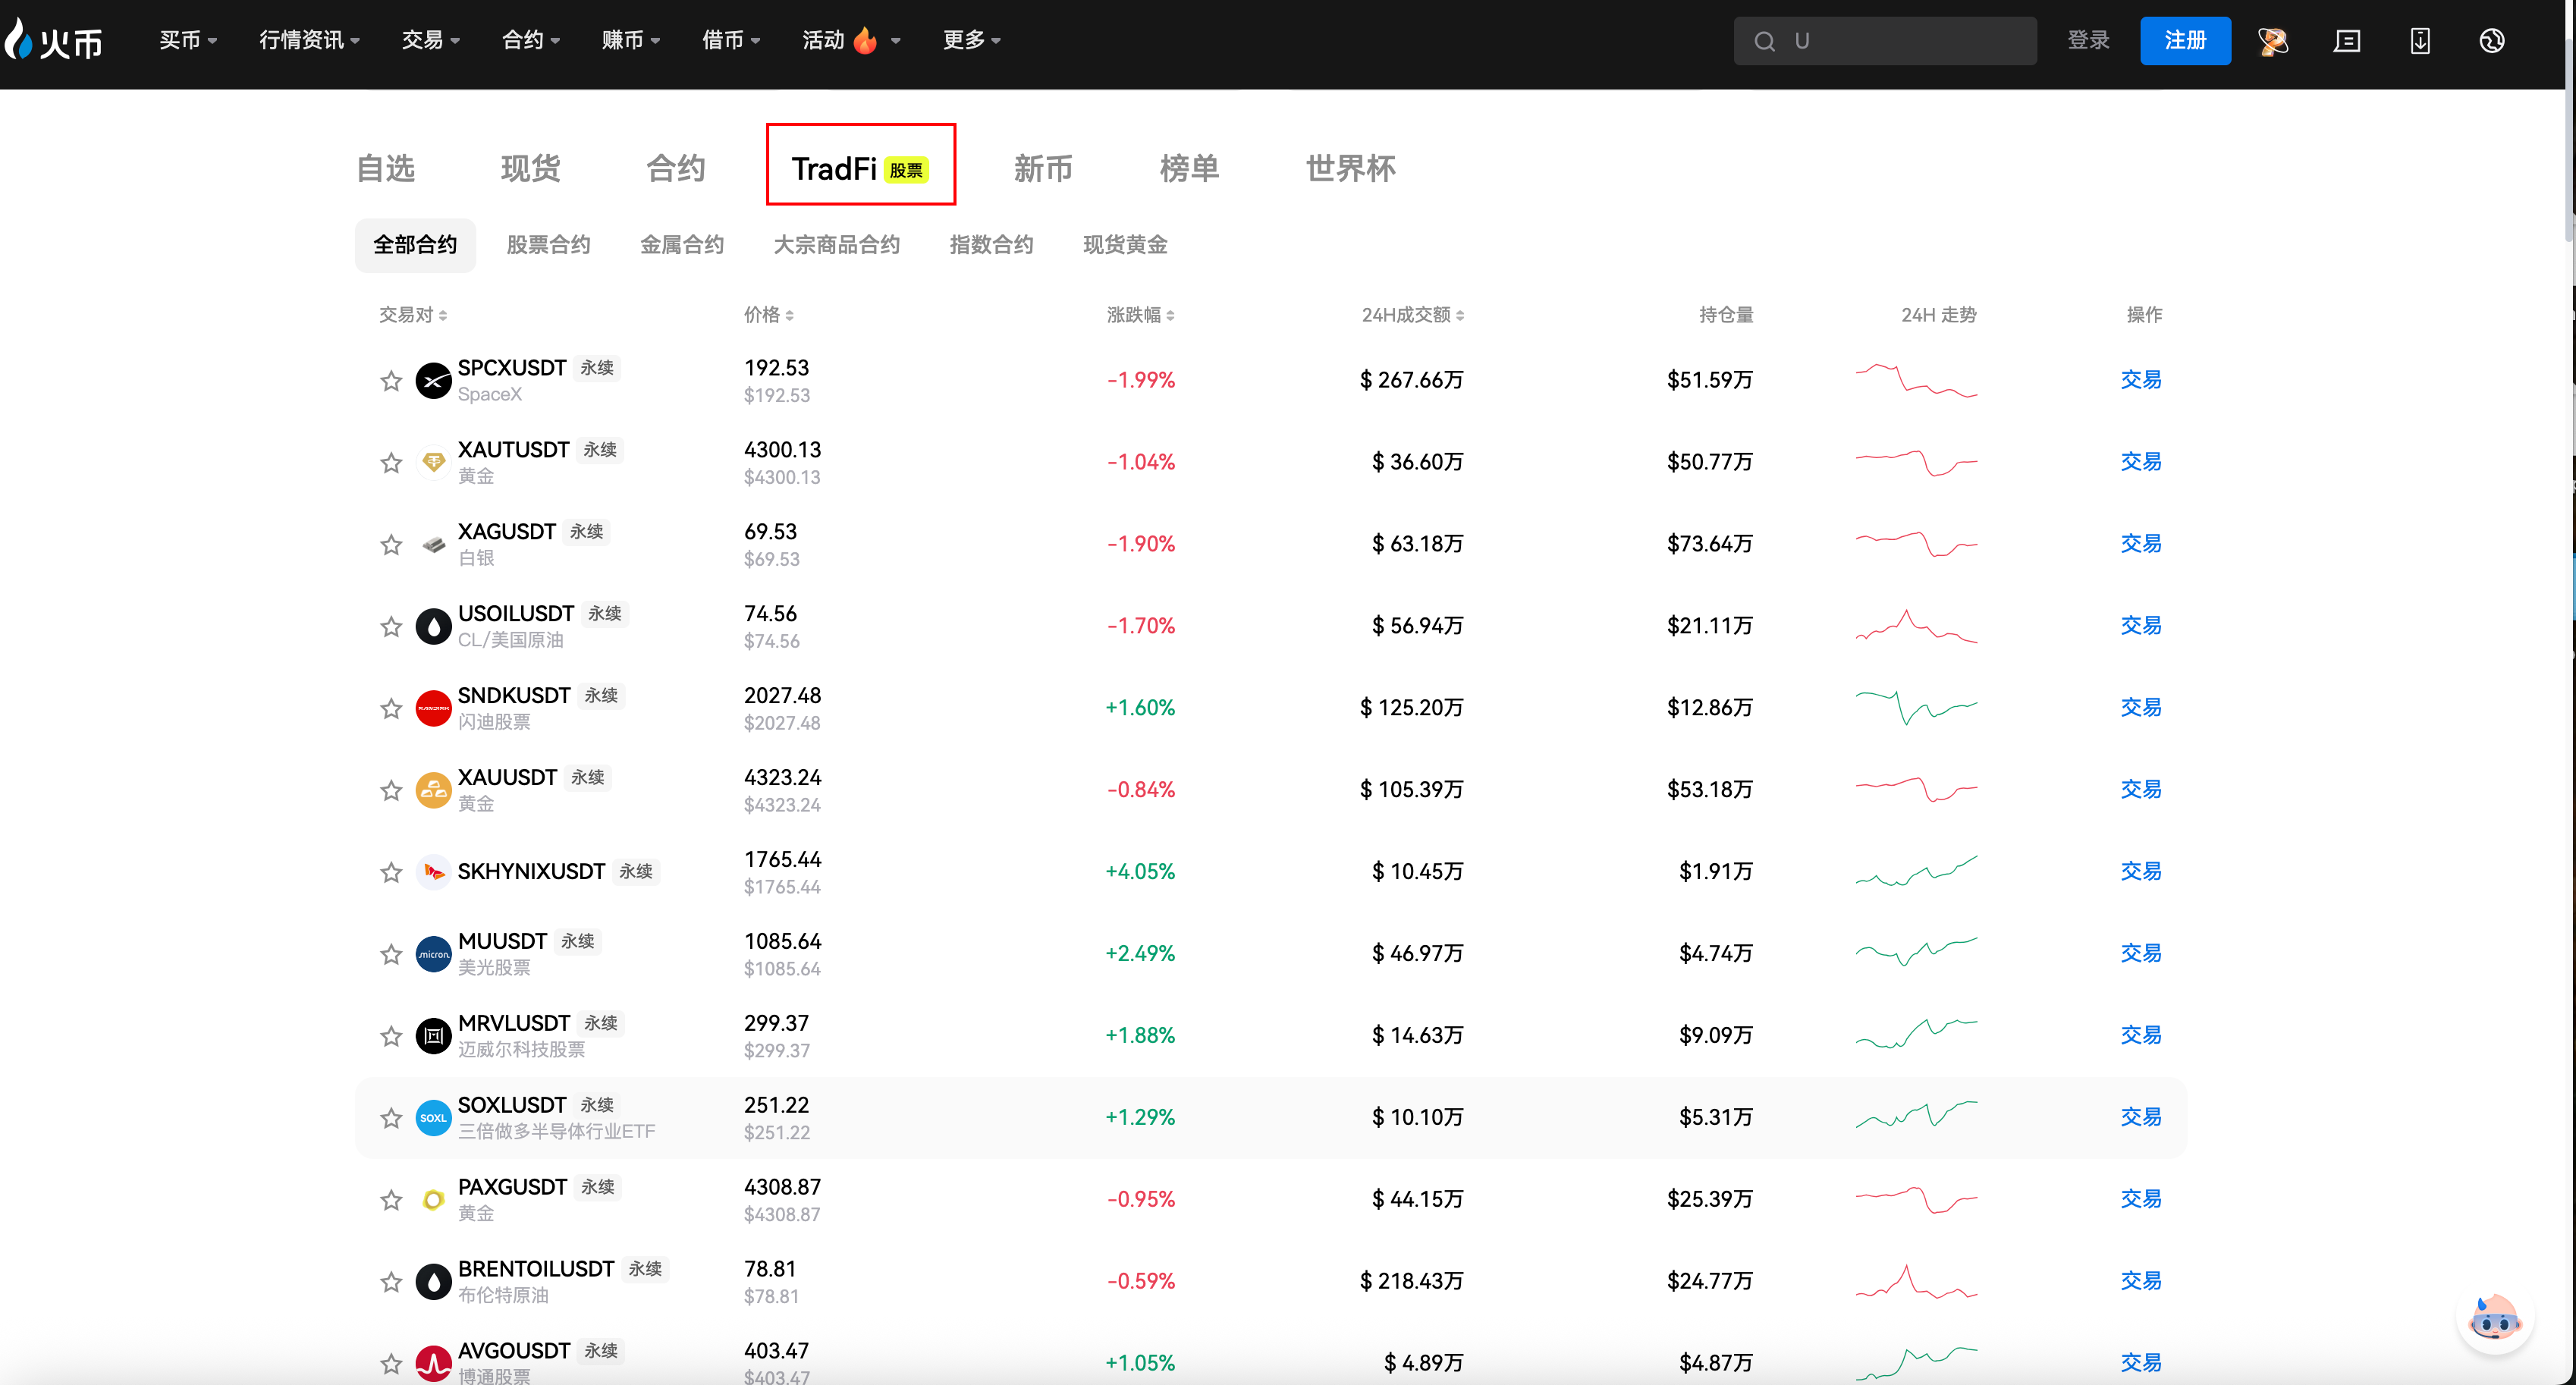
第三步:浏览所有可交易标的(目前75+),点击任意一个进入交易界面,设置杠杆(建议首次使用1-3x),设置止损价,输入仓位数量

然后选择“买入开多”或“卖出开空”,确认开仓。

TradFi的链上化不是“会不会发生”的问题,而是“速度有多快”的问题。当华尔街和Crypto之间的墙被推倒,普通人第一次可以像机构一样——用手机、用USDT、用三秒钟的时间——配置全球最主流的资产。

这就是HTX TradFi正在做的事情。

Letture associate

BitTorrent Launches BTTInferGrid: The Decentralized Infrastructure Layer for Scalable AI Inference

BitTorrent has launched BTTInferGrid, a decentralized GPU computing network designed to meet the surging demand for AI inference workloads. The platform aggregates global idle GPU resources into an open-access, verifiable, and pay-as-you-go infrastructure, aiming to solve the cost, scalability, and supply bottlenecks of traditional centralized cloud providers. BTTInferGrid addresses a key market shift, as industry forecasts indicate over 70% of future AI compute will be for inference—a continuous operational cost. It tackles centralization issues like inflexible resource allocation during volatile demand, prohibitive GPU pricing, and the underutilization of fragmented global compute capacity. The platform establishes a direct corridor between AI developers and idle hardware. On the supply side, it allows providers to monetize underutilized GPUs through tokenized incentives. On the demand side, it offers developers cost-efficient, on-demand inference with on-chain verification. Key differentiators include permissionless access for providers, verifiable service quality through blockchain validation, and a sustainable, demand-driven economic model. Built on BitTorrent's proven DePIN expertise from the BitTorrent File System (BTFS), BTTInferGrid follows a phased roadmap. It begins with network bootstrapping in 2026, focusing on scaling GPU nodes, and aims to evolve into a foundational Web3 AI infrastructure layer by 2028, supporting diverse model architectures and decentralized fine-tuning.

TheNewsCrypto31 min fa

BitTorrent Launches BTTInferGrid: The Decentralized Infrastructure Layer for Scalable AI Inference

TheNewsCrypto31 min fa

Gate Research Institute: Analysis of Chart Patterns and Breakout Trading Strategies

Gate Research Institute: Chart Pattern Analysis and Breakout Trading Strategies Chart patterns are crucial tools in technical analysis for observing market supply and demand shifts, trend continuations, and reversals. This analysis involves a comprehensive evaluation of trend, volume, support/resistance, time cycles, and breakout validity, not just rote pattern recognition. Patterns are broadly categorized into reversal patterns (e.g., Double Tops/Bottoms, Head and Shoulders) and continuation patterns (e.g., Flags, Triangles, Rectangles). An effective breakout, key for trading, requires clear support/resistance, prolonged consolidation, a prevailing trend backdrop, and volume confirmation. However, breakouts are not guaranteed, as false breakouts are common. Risk must be managed through position sizing, stop-loss orders, pullback confirmations, and profit-taking in stages. Key pattern types discussed include: * **Rectangle Patterns:** Indicate market indecision within parallel support and resistance, with breakouts projecting a move equal to the pattern's width. * **Flag & Pennant Patterns:** Short-term continuation patterns following sharp price moves ("flagpoles"). * **Triangle Patterns:** Symmetrical, Ascending (bullish bias), and Descending (bearish bias) triangles, representing consolidation before a directional move. * **Head and Shoulders Patterns:** Major reversal patterns signaling trend exhaustion. The article details breakout trading strategies, defining valid breakouts by price closing beyond a key level with increased volume and minimal immediate re-entry into the prior range. It contrasts range trading with breakout trading and outlines entry methods (immediate entry, pullback entry, scaling in), stop-loss placement (based on pattern failure), and profit-taking techniques (target-based, structure-based, trend-following). It further classifies breakout outcomes: 1. **Valid Breakouts:** Strong, sustained moves in the breakout direction. 2. **Pullback Breakouts:** Price breaks out, retests the breakout level as support/resistance, then resumes the trend—offering a lower-risk entry. 3. **False Breakouts:** Price briefly breaches a level but quickly reverses back into the prior range, a common risk managed by strict stop-losses. Key validation tools for breakouts include volume analysis, the principle of support/resistance role reversal, and momentum indicators like ATR, Moving Averages, Bollinger Bands, and RSI. In conclusion, while chart patterns and breakout analysis provide a structured framework, their effectiveness relies on multiple confirming factors—trend context, volume, and proper risk management. They should be integrated into a broader trading system rather than used as standalone signals.

marsbit1 h fa

Gate Research Institute: Analysis of Chart Patterns and Breakout Trading Strategies

marsbit1 h fa

Trading

Spot
Futures
活动图片