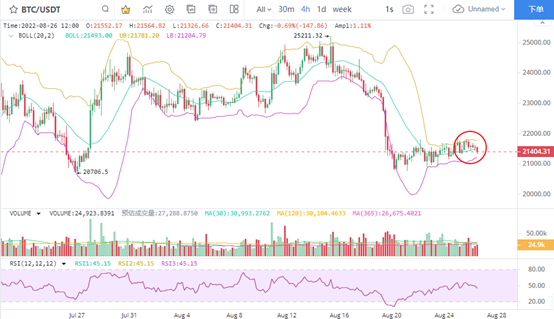
1. BTC seeks a breakthrough during sideways Trading
In the 4-hour K-line diagram, during the horizontal operation stage of BTC, the price fluctuation space is very limited. It is generally limited to the distance between the middle rail of the Bollinger line and the rail of the Bollinger line, with a span of only US $350. At the same time, the longer the sideways time, there are signs that BTC will further fall below the middle rail of the brin line. The corresponding point of the middle rail of brin line is 21492 US dollars. At present, the trading volume continues to shrink, and the possibility of the price choosing the direction in the short term is increased. Pay attention to the falling signal after the weekend change.
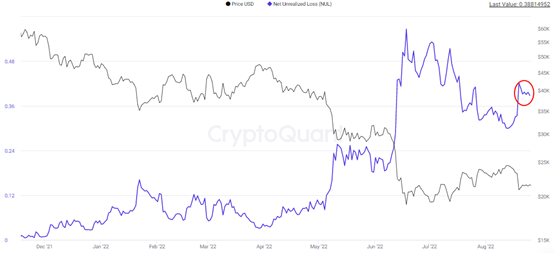
2. BTC does not realize high loss operation
The unrealized loss of BTC remained at a high level, which indicates that the loss of investors will not be reduced during the period of price sideways adjustment. With the completion of the downward falling signal of BTC price during the horizontal trading period, the impact of unrealized losses on the market remains unchanged. On the premise that the unrealized loss has not significantly decreased, it is more likely that BTC will further adjust. Recently, the chain and spot trading volume have remained stable, which has formed a certain support for the BTC price. However, the buying does not seem to be strong, and the real direction can be confirmed after the BTC fluctuation strengthens.
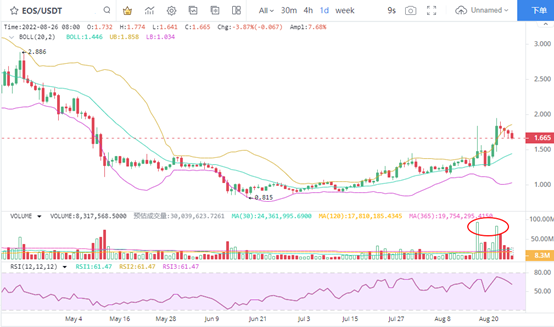
3. EOS short line 2nd pulse
After the EOS short-term pulse volume rose for two times in a row, the price rose to below $2 and then fell. Due to the short release time, the price fluctuation space of EOS is weakened. After falling for three consecutive trading days recently, there are obvious signs of continued decline. In terms of indicators, the RSI index on the 12th rebounded to the highest 74 and then retreated. Although there was no overbought article reaching 80, it still suggested that the short-term high level appeared and the position reduction signal was formed. In terms of growth, after the EOS hit the bottom from the low of US $0.815, it reached US $1.958, up 140%. In terms of trading volume, the peak volume did not significantly exceed the previous high, and attention should be paid to adjusting the risk.
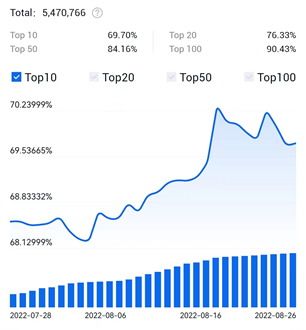
4. EOS main currency holding growth
Among the top 10 main holders of EOS, the number of coins held by EOS also increased as the price fluctuated upward. In terms of specific value, it rebounded from 68.16% on August 4 to 69.62% on August 25, and the recovery space reached 1.46 percentage points. In terms of price increase, the EOS price rose from the closing price of US $1.118 on August 4 to US $1.732 on August 25, with an increase of 54%. The trend of main positions increased in synchronization with the price increase.
5. Message side
On August 17, Yves la rose, CEO of EOS network foundation, announced the launch of a new forked public chain antelope to replace EOS on social media. According to the introduction, antelope is an open framework for building the next generation of Web3 products and services. Its community run code base supports the fastest and safest user-friendly blockchain.
At the time point, on September 21, EOS will hard fork and activate its v3.1 consensus upgrade (hardwork). EOS EVM (trustevm) will soon be available on the EOS network.
Previously, Yves La Rose said that trust EVM launched by EOS might become the preferred L2 solution for Ethereum. Trust EVM is the official EOS EVM platform with deterministic gas computing, EVM compatibility at instruction set level and full RPC compatibility. It will soon be launched on the EOS main network
In fact, the hard fork is EOS foundation and block In the process of one seizing power, the hard bifurcation news can indeed attract investors to enter the market for trading, but the duration of the heat should be vigilant. At the same time, the ecological development after the hard bifurcation is the most noteworthy place. As for the time of speculation, there is still half a month to go before the hard bifurcation. In the near future, we can pay attention to the low-income opportunities.