Harga Bitcoin di $59.000 Adalah Garis Batas, Inilah yang Harus Anda Ketahui

bitcoinistPubblicato 2026-03-30Pubblicato ultima volta 2026-03-30

Introduzione

Harga Bitcoin saat ini berada di sekitar $59.000, yang dianggap sebagai batas kritis (line in the sand) berdasarkan analisis teknikal. Menurut analis Crypto Patel, harga Bitcoin masih bertahan di atas Moving Average 200-Minggu, yang secara historis menjadi level penting untuk mempertahankan momentum bullish. Dalam siklus pasar sebelumnya (2015, 2019, dan 2023), kemampuan Bitcoin bertahan di atas level ini selalu diikuti oleh rally signifikan, termasuk rekor tertinggi baru. Saat ini, Moving Average 200-Minggu berada di $59.000. Selama harga tidak jatuh di bawah level ini, setiap penurunan dipandang sebagai peluang beli (buying opportunity), dan struktur makro dianggap masih bullish dengan potensi mencapai all-time high baru pada 2028. Sebaliknya, jika harga tembus di bawah $59.000, Bitcoin bisa memasuki wilayah bearish dan berpotensi mengalami penurunan lebih lanjut sebelum menemukan dasar yang baru.

Selama beberapa minggu terakhir, harga Bitcoin telah bergerak bolak-balik antara $60.000 dan $74.000, menunjukkan bahwa arah breakout harga dari kisaran ini dapat menentukan arah pasar selanjutnya. Setelah turun lebih dari 45%, semua perhatian kini beralih ke kapan cryptocurrency perintis ini akan mencapai titik terendah baru. Sejauh ini, para bull (pembeli) bertahan dengan cukup baik, tetapi masih ada 'garis batas' yang tidak boleh dilampaui oleh harga.

Struktur Makro Bitcoin Masih Bullish

Saat ini, harga Bitcoin masih bertahan dengan baik di atas Moving Average 200-Minggu, yang sangat bullish (menguntungkan) untuk harga, menurut analis kripto Crypto Patel. Alasan ini merujuk pada siklus pasar sebelumnya, di mana Moving Average 200-Minggu telah menjadi level utama untuk dipertahankan atau dilampaui.

Menggali siklus masa lalu, Crypto Patel menjelaskan bahwa harga Bitcoin mampu bertahan di atas Moving Average 200-Minggu pada tahun 2015. Hasilnya adalah rally besar yang mendorong harga Bitcoin menuju $20.000 dalam bull market yang menyusul.

Kemudian lagi, pada tahun 2019, Moving Average 200-Minggu yang sama bertahan dengan kuat, dan bull market yang dihasilkan mengarah ke puncak $69.000 pada tahun 2021. Bahkan untuk ketiga kalinya pada tahun 2023, meskipun harga sempat anjlok di bawah $20.000, Bitcoin berhasil bertahan di atas Moving Average 200-Minggu, dan para bull dihargai karena harga mencapai $126.000 pada tahun 2025.

Sumber: X

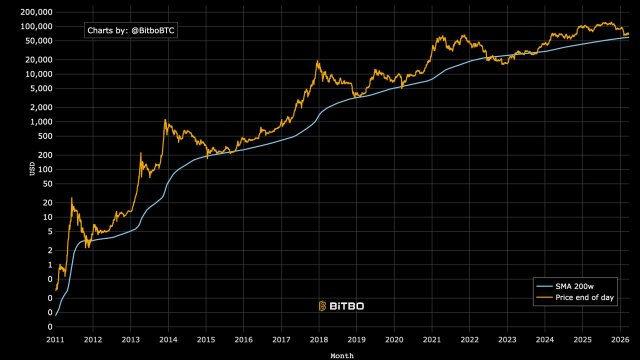
Mengingat tren ini, menjadi jelas bahwa harga Bitcoin yang berada di atas MA 200-Minggu adalah bullish, dan sebaliknya, kejatuhan di bawahnya akan menjadi bearish (merugikan). Inilah mengapa penting bagi para bull untuk mempertahankan level ini.

Harga BTC Tidak Boleh Jatuh di Bawah $59.000

Berdasarkan postingan analis, Moving Average 200-Minggu saat ini untuk Bitcoin terletak pada $59.000. Ini segera menjadikannya level yang harus dipertahankan oleh para bull. Seperti yang dijelaskan Crypto Patel, selama harga Bitcoin tetap di atas level ini, maka 'setiap penurunan adalah hadiah.' Ini berarti itu bisa menjadi peluang untuk membeli.

Jika tren sejarah dihormati, mempertahankan 200W MA akan berarti bahwa harga Bitcoin akan mencapai all-time high baru sekitar tahun 2028. "Struktur Makro Masih Bullish. Jangan Biarkan Ketakutan Jangka Pendek Menggoyahkan Anda," peringat analis.

Sebaliknya, break di bawah Moving Average 200-Minggu ini bisa menjadi bencana bagi Bitcoin, karena itu berarti cryptocurrency kini telah secara resmi memasuki wilayah bear market. Itu juga bisa membawa pertanda penurunan lebih lanjut, mengirim cryptocurrency lebih rendah sebelum membentuk dasar.

Bull BTC mulai mendorong naik lagi | Sumber: BTCUSD di Tradingview.com

Domande pertinenti

QMengapa harga Bitcoin $59.000 dianggap sebagai 'garis batas' yang krusial?

AKarena $59.000 merupakan level 200-Week Moving Average (MA) saat ini, yang secara historis menjadi level support utama. Bertahan di atas level ini dianggap sinyal bullish, sementara jatuh di bawahnya dapat menandai dimulainya pasar bearish.

QApa yang terjadi pada harga Bitcoin ketika berhasil bertahan di atas 200-Week MA di masa lalu?

APada tahun 2015, pertahanan di atas level ini diikuti rally menuju $20.000. Di tahun 2019, hal serupa membawa harga ke puncak $69.000 pada 2021. Pada 2023, pertahanan ini juga memicu kenaikan yang diproyeksikan mencapai $126.000 pada 2025.

QApa konsekuensi jika harga jatuh di bawah 200-Week MA sebesar $59.000?

AJatuh di bawah level $59.000 akan dianggap sebagai sinyal bearish yang dapat mengkonfirmasi Bitcoin telah memasuki wilayah pasar bearish secara resmi dan berpotensi memicu penurunan harga lebih lanjut sebelum menemukan dasar yang baru.

QApa saran dari analis Crypto Patel untuk investor terkait level ini?

ACrypto Patel menyarankan bahwa selama harga Bitcoin tetap di atas $59.000 (200W MA), setiap penurunan harga (dip) adalah 'hadiah' atau kesempatan untuk membeli, dan investor tidak boleh goyah oleh ketakutan jangka pendek karena struktur makro masih bullish.

QIndikator teknis apa yang digunakan analis untuk menentukan pandangan bullish jangka panjangnya?

AAnalis menggunakan indikator 200-Week Moving Average (Rata-rata Bergerak 200-Minggu) sebagai indikator utama. Keberhasilan harga dalam mempertahankan level ini di setiap siklus pasar sebelumnya menjadi dasar untuk pandangan bullish jangka panjang.

Letture associate

Fed's Internal Doves Flock to Hawkish Stance, Warsh's Debut "Between a Rock and a Hard Place"

U.S. Federal Reserve officials who previously advocated for rate cuts, including Governor Christopher Waller, have recently shifted their stance, with many now not ruling out the possibility of future rate hikes. This sets a challenging stage for new Fed Chair Kevin Warsh's first policy meeting. Appointed by President Trump based on his dovish views, Warsh now faces a committee where the debate has pivoted from "when to cut" to "whether to hike," driven by persistent inflation above 3%, a strong labor market, and supply-side pressures from AI infrastructure demands and geopolitical tensions. Key figures illustrate the shift. Governor Waller, once concerned about employment, now says data has pushed him toward considering rate increases. Even moderate voices like Governor Lisa Cook, while expecting inflation to ease, have indicated readiness to hike if it fails to do so. Long-time hawks such as regional Fed presidents Beth Hammack, Lorie Logan, and Neel Kashkari have grown more vocal, arguing that the real policy rate is effectively falling and that action may soon be needed. The upcoming Fed meeting is expected to keep rates steady but will likely remove the "easing bias" from its statement, signaling a neutral stance between cuts and hikes. The quarterly "dot plot" is anticipated to show most officials projecting no cuts this year, with some potentially indicating hikes. Chair Warsh, a critic of the Fed's reliance on forward guidance like the dot plot, must navigate communicating this pivot using tools he has questioned, all while steering policy in a direction counter to the preferences of the president who appointed him. The consensus suggests the Fed's next move could well be a rate increase.

marsbit7 min fa

Fed's Internal Doves Flock to Hawkish Stance, Warsh's Debut "Between a Rock and a Hard Place"

marsbit7 min fa

The Trillion-Yuan Market Cap 'Yi Zhong Tian': Who is the True Value King?

The article analyzes the three leading Chinese optical module companies, collectively nicknamed "Yi Zhong Tian": Xinyisheng, Zhongji Innolight, and TFC Optical Communication. It evaluates their "cost-performance" not by current stock price, but through three lenses: PEG ratio (growth vs. valuation), earnings quality, and premium/discount for certainty. Xinyisheng shows the most attractive PEG ratio and high profitability, but its valuation reflects discounts for risks like high customer concentration and reliance on overseas markets. Zhongji Innolight, the most expensive, commands a premium for its market leadership, dominant share in key products like 800G/1.6T modules, and higher earnings certainty, though it faces geopolitical risks. TFC Optical, as an upstream component supplier ("water seller"), has the highest gross margin and bets on the long-term CPO/NPO architecture trend, but trades at a high valuation with more stable, less explosive growth. The core argument is that while these companies dominate module assembly, the true profit pool and technological moat lie upstream in laser and switch chips, currently controlled by U.S. firms like Lumentum and Coherent. The long-term "cost-performance" for these Chinese leaders hinges on whether the domestic industry, exemplified by companies like Yuanjie Technology, can successfully move up the value chain into high-power laser chips. Otherwise, their high growth may remain confined to the lower-margin assembly segment.

marsbit17 min fa

The Trillion-Yuan Market Cap 'Yi Zhong Tian': Who is the True Value King?

marsbit17 min fa

Has the Crypto Market Bottomed? Here's What Institutions Think

The crypto market is in a period of significant debate, with leading institutions offering differing views on whether a bottom has been reached. Three prominent firms have published detailed analyses: * **Galaxy Digital** argues Bitcoin has **not yet bottomed**. Their analysis of 13 historical indicators across six dimensions (valuation, profit-taking, miner pressure, etc.) shows only four are fully met. They project a potential bottom range between $30k and $54k. * **NYDIG** states a bottom is **possible but not likely**. While metrics are close to historic bear market extremes, they note the absence of a classic panic-selling event. They also suggest increased institutional adoption may have structurally altered the market cycle, potentially leading to a shallower downturn. * **Standard Chartered Bank** asserts the **bottom has already occurred** at around $59k. They cite two key factors: potential US-Iran diplomatic progress and the anticipated SpaceX IPO, which they believe absorbed capital and caused ETF selling pressure that is now subsiding. They forecast a year-end price target of $100k. Despite the surface-level disagreement, the reports share critical common ground more valuable for long-term investors: 1. All three believe the market bottom will form **within this year**. 2. All agree the current price is **closer to the bottom than to previous highs**. 3. All maintain a **bullish long-term outlook** for Bitcoin and a new cycle. The core takeaway is that while the exact bottom price ($40k, $50k, or $60k) is debated, the consensus is that a bottom is imminent. For long-term holders, the primary focus should not be pinpointing the absolute low, but on the future potential for prices to reach $100k, $200k, or higher. The fundamental thesis for Bitcoin—sovereign debt accumulation, inflation, declining trust in centralized institutions, global digitization, and improved accessibility—remains intact and is arguably strengthening. The overall landscape is viewed as more favorable than in previous crypto winters.

marsbit27 min fa

Has the Crypto Market Bottomed? Here's What Institutions Think

marsbit27 min fa

The 'Chip' Challenge and Breakthroughs in China's Optical Industry Chain

China's Photonics Industry: Bottlenecks and Breakthroughs In the global AI race, computing chips dominate the narrative, but the underlying bottleneck increasingly defining the scale of AI clusters is light—or more specifically, optical connectivity. Optical modules, which translate electrical signals to light and vice versa, are crucial for connecting thousands of GPUs in AI data centers, preventing data congestion and ensuring efficient model training. High-speed modules (800G, 1.6T) are now standard, with performance hinging on advanced DSP (Digital Signal Processor) chips. This is where a critical dependency lies. Two US giants—Marvell and Broadcom—collectively dominate over 90% of the high-end DSP chip market. Chinese optical module leaders like Zhongji Innolight and Eoptolink rely on these chips to manufacture modules for overseas AI customers, primarily in North America. While this creates a supply chain vulnerability, complete decoupling is difficult. Marvell derives over half its revenue from Greater China, and the US firms depend on Chinese partners for chip packaging and optical components. The risk from laser chips (e.g., from Lumentum), another key component, is considered more manageable due to multiple global suppliers and faster progress in domestic alternatives from companies like YOFC and Accelink. To mitigate risks, China's industry is pursuing a multi-pronged strategy: diversifying supply chains and locking in long-term orders; fostering a domestic market ecosystem to adopt homegrown DSPs from firms like Huawei HiSilicon and CETC; accelerating R&D in high-speed DSPs and advanced packaging; and investing in next-gen technologies like silicon photonics and Co-Packaged Optics (CPO) to reduce reliance on discrete DSPs. The ultimate solution lies not in short-term博弈 but in persistent advancement of domestic high-end chip R&D and manufacturing. While challenges remain in performance, certification, and ecosystem building, China's vast domestic market and manufacturing base provide a crucial buffer, buying time for the industry to achieve greater technological independence.

marsbit41 min fa

The 'Chip' Challenge and Breakthroughs in China's Optical Industry Chain

marsbit41 min fa

Behind SpaceX's $2 Trillion Market Cap: Why Does Musk Always Have the Next Move Planned?

On June 12th, SpaceX debuted on the Nasdaq, reaching a valuation that briefly touched $2 trillion. This marked the culmination of a 24-year journey from its founding in 2002, driven by Elon Musk's frustration at the high cost of buying rockets. The company's path was defined by early failures, with its first three Falcon 1 launches ending in explosions before a successful 2008 flight opened the era of commercial spaceflight. Key to its model was a fixed-price NASA contract, incentivizing cost reduction. SpaceX mastered rocket reusability, first achieving a Falcon 9 landing in 2015, which drastically cut launch costs. This enabled its profitable Starlink satellite internet constellation, envisioned years before reusability was proven, to create an internal market for frequent launches. Similarly, the next-generation Starship rocket was in development long before its first flight, with its business case evolving from Mars colonization to supporting the emerging concept of in-orbit data centers for AI—a story now central to its valuation. The company's recent IPO, a reversal of its long-standing "no IPO" stance, is funding this ambitious "space-based compute" vision. While major tech players like Google, Blue Origin, and others are investing heavily, significant technical and cost hurdles remain. Ultimately, SpaceX's history is one of creating its own demand: first with Starlink and now with space-based AI compute, betting that its next rocket will enable its next giant market.

marsbit43 min fa

Behind SpaceX's $2 Trillion Market Cap: Why Does Musk Always Have the Next Move Planned?

marsbit43 min fa

Trading

Spot
Futures

Articoli Popolari

Come comprare SAND

Benvenuto in HTX.com! Abbiamo reso l'acquisto di The Sandbox (SAND) semplice e conveniente. Segui la nostra guida passo passo per intraprendere il tuo viaggio nel mondo delle criptovalute.Step 1: Crea il tuo Account HTXUsa la tua email o numero di telefono per registrarti il tuo account gratuito su HTX. Vivi un'esperienza facile e sblocca tutte le funzionalità,Crea il mio accountStep 2: Vai in Acquista crypto e seleziona il tuo metodo di pagamentoCarta di credito/debito: utilizza la tua Visa o Mastercard per acquistare immediatamente The SandboxSAND.Bilancio: Usa i fondi dal bilancio del tuo account HTX per fare trading senza problemi.Terze parti: abbiamo aggiunto metodi di pagamento molto utilizzati come Google Pay e Apple Pay per maggiore comodità.P2P: Fai trading direttamente con altri utenti HTX.Over-the-Counter (OTC): Offriamo servizi su misura e tassi di cambio competitivi per i trader.Step 3: Conserva The Sandbox (SAND)Dopo aver acquistato The Sandbox (SAND), conserva nel tuo account HTX. In alternativa, puoi inviare tramite trasferimento blockchain o scambiare per altre criptovalute.Step 4: Scambia The Sandbox (SAND)Scambia facilmente The Sandbox (SAND) nel mercato spot di HTX. Accedi al tuo account, seleziona la tua coppia di trading, esegui le tue operazioni e monitora in tempo reale. Offriamo un'esperienza user-friendly sia per chi ha appena iniziato che per i trader più esperti.

312 Totale visualizzazioniPubblicato il 2024.12.10Aggiornato il 2026.06.02

Come comprare SAND

Discussioni

Benvenuto nella Community HTX. Qui puoi rimanere informato sugli ultimi sviluppi della piattaforma e accedere ad approfondimenti esperti sul mercato. Le opinioni degli utenti sul prezzo di SAND SAND sono presentate come di seguito.

活动图片