Decred Melesat 14% – Namun Satu Risiko Tetap Mengancam Tren Naik DCR

ambcryptoPubblicato 2026-02-27Pubblicato ultima volta 2026-02-27

Introduzione

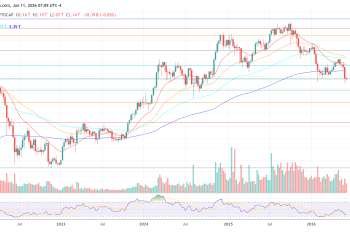
Decred (DCR) mengalami kenaikan 14% dalam 24 jam terakhir, didukung oleh indikator teknis yang menunjukkan momentum bullish. Aroon Up berada di 100,5% dan Parabolic SAR mengonfirmasi tekanan beli yang masih kuat. Namun, data aliran spot mengungkapkan penjualan bersih senilai $745.000, penjualan mingguan terbesar ketiga sejak 2022. Jika tekanan jual berlanjut, terutama di akhir pekan saat likuiditas menipis, DCR berisiko mengalami koreksi yang lebih dalam. Meskipun diperdagangkan dalam channel naik dan telah mencetak keuntungan 106% year-to-date, kelanjutan rally bergantung pada apakah momentum bullish dapat mengatasi tekanan jual dan kondisi likuiditas ke depan.

Decred [DCR] melonjak 14% dalam 24 jam terakhir, pada waktu pemberitaan, seiring membaiknya sentimen pasar.

Kinerja harga hanya mewakili satu bagian dari teka-teki, mengonfirmasi momentum yang terbangun. Sementara itu, aktivitas di pasar spot menunjukkan bahwa beberapa investor mungkin memposisikan diri untuk potensi penurunan.

Momentum menguat seiring indikator berubah menjadi bullish

Prospek bullish untuk DCR didukung oleh indikator yang melacak momentum harga dan sentimen investor.

Indikator Aroon, misalnya, mengukur kekuatan tren menggunakan dua garis: Aroon Up (oranye) dan Aroon Down (biru). Ketika Aroon Up bergerak di atas Aroon Down, itu menandakan momentum bullish. Semakin lebar jarak antara kedua garis, semakin kuat tren kenaikannya.

Pada saat penulisan, Aroon Up DCR berada di 100,5%, sementara Aroon Down berada di 42,5%. Divergensi lebar ini mencerminkan momentum naik yang kuat dan menunjukkan bahwa pembeli masih mengendalikan.

Demikian pula, Parabolic SAR memberikan wawasan tentang tekanan pasar yang berlaku. Indikator ini memplot titik-titik baik di atas atau di bawah harga.

Ketika titik-titik muncul di bawah harga, ini menunjukkan tekanan beli yang berkelanjutan; ketika titik-titik terbentuk di atas harga, ini menandakan tekanan jual. Ketekunan dan urutan titik-titik ini membantu mengukur intensitas tren yang berlaku.

Saat ini, titik-titik tetap di bawah harga DCR, memperkuat pandangan bahwa para bull masih aktif. Secara keseluruhan, kedua indikator menunjukkan bahwa investor tidak punya alasan untuk panik pada tahap ini.

Investor spot cenderung bearish

Indikator teknis sering tertinggal dari aksi harga, dan itu mungkin terjadi di sini, karena data bursa menunjukkan bahwa trader spot telah mulai menjual.

Observasi ini didasarkan pada netflow bursa spot, yang melacak arus masuk dan keluar token ke dan dari bursa. Arus masuk yang lebih tinggi biasanya menunjukkan bahwa investor mentransfer token ke bursa untuk dijual, sementara arus keluar yang lebih tinggi menunjukkan pergerakan ke dompet pribadi, yang sering dikaitkan dengan holding daripada penjualan segera.

Secara mingguan, data netflow spot menunjukkan penjualan bersih sekitar $745.000 senilai DCR. Perlu dicatat, ini menandai pelepasan aset mingguan terbesar ketiga yang tercatat untuk aset tersebut sejak 2022.

Jika tekanan jual berlanjut hingga akhir pekan, periode ketika aktivitas perdagangan sering menurun, DCR dapat menghadapi risiko penurunan tambahan karena likuiditas menipis dan arus keluar modal meningkat.

Jika momentum bearish mulai selaras dengan arus keluar spot saat ini, DCR mungkin menghadapi ancaman koreksi yang lebih tajam daripada yang telah dilihat pasar sejauh ini.

Aliran likuiditas dan struktur grafik

Untuk menilai arah kemungkinan DCR, struktur grafik menawarkan wawasan tambahan.

DCR saat ini diperdagangkan dalam sebuah channel ascending, secara stabil tren lebih tinggi sepanjang formasi. Secara tradisional, channel ascending dapat bertindak sebagai prekursor bearish, sering berujung pada breakdown tajam. Namun, setup saat ini mungkin berbeda.

Rally baru-baru ini telah mendorong DCR ke wilayah positif secara year-to-date, dengan keuntungan 106%. Token tersebut juga kembali ke level break-even untuk trader yang masuk sekitar 18 November, secara efektif menghapus kerugian sebelumnya dari periode tersebut.

Momentum dengan magnitudo seperti ini terkadang dapat menentang ekspektasi grafik konvensional. Sebuah breakout tegas di atas resistance atas channel akan mengonfirmasi kekuatan yang berlanjut, sementara konsolidasi berkepanjangan dalam kisaran akan menandakan jeda sebelum langkah besar berikutnya. Kedua hasil akan membantu memperjelas momentum jangka pendek.

Pentingnya potensi penentangan ini terletak pada preseden. Selama market crash 10 Oktober, yang memicu kapitalisasi luas di sektor kripto, DCR rally selama 25 hari berturut-turut setelahnya, mendapatkan 463% dan menetapkan all-time high baru di $70.

Apakah sejarah terulang akan tergantung pada bagaimana momentum, arus spot, dan kondisi likuiditas menyelaraskan dalam sesi yang akan datang.


Ringkasan Akhir

  • Indikator momentum dan sentimen menunjukkan bahwa DCR saat ini berada dalam fase bullish pada grafik.
  • Trader spot sedang mencairkan; namun, dinamika pasar yang lebih luas dari DCR masih dapat mendukung rally.


Crypto di tendenza

Domande pertinenti

QApa yang menyebabkan harga Decred (DCR) mengalami kenaikan 14% dalam 24 jam terakhir?

AHarga Decred (DCR) mengalami kenaikan 14% karena membaiknya sentimen pasar secara keseluruhan.

QApa yang ditunjukkan oleh indikator Aroon tentang momentum DCR?

AIndikator Aroon menunjukkan momentum bullish yang kuat, dengan Aroon Up berada di 100.5% dan Aroon Down di 42.5%, menandakan pembeli masih mengendalikan tren.

QMengapa aliran bersih (netflow) spot exchange dianggap bearish untuk DCR?

AData netflow spot exchange menunjukkan penjualan bersih sekitar $745.000, yang merupakan penjualan mingguan terbesar ketiga sejak 2022, mengindikasikan bahwa investor mulai menjual aset mereka.

QApa risiko yang dihadapi DCR jika tekanan jual berlanjut hingga akhir pekan?

AJika tekanan jual berlanjut, DCR berisiko mengalami penurunan harga yang lebih dalam karena likuiditas menipis dan arus keluar modal meningkat, terutama di akhir pekan ketika aktivitas perdagangan biasanya menurun.

QBagaimana struktur chart ascending channel mempengaruhi pergerakan harga DCR ke depan?

ADCR sedang diperdagangkan dalam ascending channel. Breakout di atas resistance atas channel akan mengonfirmasi kelanjutan kekuatan bullish, sementara konsolidasi yang berkepanjangan dapat menandakan jeda sebelum pergerakan besar berikutnya.

Letture associate

Annual Salary of Millions Competing for Electricians, Meta Rushes to Open Its Own Technical School

The AI boom is facing an unexpected bottleneck: a severe shortage of skilled construction workers and electricians. As tech giants like Meta, OpenAI, and Alphabet race to build massive data centers—such as OpenAI's $16 billion "Stargate" project—they are hitting a critical labor wall. The U.S. needs an estimated 130,000 more electricians, 240,000 construction workers, and 150,000 supervisors by 2030 for AI infrastructure alone, but tens of thousands of electrician jobs go unfilled each year. While AI companies offer high premiums, with electricians earning up to $280,000 annually, worker scarcity still causes massive losses—delays on a single project can cost $14.2 million per month. The complexity of building AI data centers, which require immense power (equivalent to powering hundreds of thousands of homes), sophisticated electrical systems, and advanced liquid cooling solutions, demands highly skilled technicians who are in short supply. To combat this, companies are investing heavily in training. Meta has committed $115 million to a free training school offering tuition, housing, and stipends, targeting 5,000 new workers. OpenAI is partnering with unions to secure skilled labor. These efforts are paying off, with a significant rise in Gen Z interest in trade schools over college. However, the power demands are staggering. AI data centers are driving a rapid surge in electricity consumption, projected to account for up to 12% of U.S. power use by 2028 and raising costs for consumers. Furthermore, the construction boom is project-based, leading to a potential future glut of trained workers once building peaks, which could depress wages industry-wide. The race for AI supremacy now depends as much on skilled hands as on advanced chips.

marsbit52 min fa

Annual Salary of Millions Competing for Electricians, Meta Rushes to Open Its Own Technical School

marsbit52 min fa

OpenAI No Longer Sells Its Most Expensive Model for Profit

OpenAI is shifting its business strategy away from promoting its most expensive, flagship models for every task. Recent price cuts—80% for GPT-5.6 Luna and 20% for Terra—signal a deeper change: the company now actively advises users that many tasks don't require the most powerful model. Instead, OpenAI recommends a tiered approach: use the high-end GPT-5.6 Sol for complex planning and analysis, then delegate execution to cheaper models like Luna. This mirrors moves by Anthropic, which recently launched Claude Opus 5 at half the price of its top model, Fable 5. Both companies are de-emphasizing flagship models as primary revenue drivers, using them instead for brand prestige and technological showcases. The industry is entering a "mass-market" phase, similar to automotive, where high-volume, cost-effective models handle daily operations and drive scale. OpenAI's price reductions are partly enabled by AI models themselves optimizing underlying code and infrastructure, creating a self-reinforcing cycle of efficiency gains and cost reduction. Competition is shifting from "who is smartest" to "who offers the best value." The goal is no longer selling individual models but fostering widespread API adoption and ecosystem lock-in. By making AI calls cheap and ubiquitous, companies like OpenAI aim to become the indispensable, utility-like infrastructure powering automated workflows—the "water and electricity" of software, quietly embedded everywhere.

marsbit52 min fa

OpenAI No Longer Sells Its Most Expensive Model for Profit

marsbit52 min fa

Will the Fed Definitely Raise Interest Rates in September? How Will Crypto and U.S. Stocks Withstand the Pressure?

The market's expectation for a September Fed rate hike surged dramatically in early August, jumping from under 50% to over 80% within a week. This shift followed a contentious July FOMC meeting, where a 9-3 vote to hold rates revealed growing dissent from hawkish members advocating for an immediate hike to combat persistent inflation. The primary catalyst for this repricing is rising oil prices, driven by renewed geopolitical tensions around the Strait of Hormuz, which threaten global supply. Energy costs directly influence inflation metrics, making the upcoming July CPI report (due August 12th) a critical data point. If it shows inflation reaccelerating, the probability of a September hike will solidify. For Bitcoin and crypto assets, this is typically bearish news. Bitcoin continues to behave as a high-beta, liquidity-sensitive risk asset. A rate hike raises the opportunity cost of holding non-yielding assets and could drive capital toward money markets, pressuring crypto prices in the short term. However, historical patterns suggest that if a hike is perceived as the end of a tightening cycle rather than the start, any negative price impact may be brief. U.S. stocks, particularly crypto-linked equities like Coinbase and growth-oriented tech stocks, are also vulnerable. Higher rates increase discount rates in valuation models, putting pressure on high-multiple companies. This coincides with a pivotal tech earnings season where investor focus has shifted from massive AI capital expenditure to tangible revenue and cash flow generation. Companies with negative cash flow and weak growth narratives could face heightened volatility if borrowing costs rise in September. In summary, a September Fed hike has evolved into a mainstream market scenario. Key factors to watch are oil prices, the July CPI report, and Fed communications, which will determine the final decision and its impact on volatile crypto and equity markets.

marsbit1 h fa

Will the Fed Definitely Raise Interest Rates in September? How Will Crypto and U.S. Stocks Withstand the Pressure?

marsbit1 h fa

Trading

Spot

Articoli Popolari

Come comprare DCR

Benvenuto in HTX.com! Abbiamo reso l'acquisto di Decred (DCR) semplice e conveniente. Segui la nostra guida passo passo per intraprendere il tuo viaggio nel mondo delle criptovalute.Step 1: Crea il tuo Account HTXUsa la tua email o numero di telefono per registrarti il tuo account gratuito su HTX. Vivi un'esperienza facile e sblocca tutte le funzionalità,Crea il mio accountStep 2: Vai in Acquista crypto e seleziona il tuo metodo di pagamentoCarta di credito/debito: utilizza la tua Visa o Mastercard per acquistare immediatamente DecredDCR.Bilancio: Usa i fondi dal bilancio del tuo account HTX per fare trading senza problemi.Terze parti: abbiamo aggiunto metodi di pagamento molto utilizzati come Google Pay e Apple Pay per maggiore comodità.P2P: Fai trading direttamente con altri utenti HTX.Over-the-Counter (OTC): Offriamo servizi su misura e tassi di cambio competitivi per i trader.Step 3: Conserva Decred (DCR)Dopo aver acquistato Decred (DCR), conserva nel tuo account HTX. In alternativa, puoi inviare tramite trasferimento blockchain o scambiare per altre criptovalute.Step 4: Scambia Decred (DCR)Scambia facilmente Decred (DCR) nel mercato spot di HTX. Accedi al tuo account, seleziona la tua coppia di trading, esegui le tue operazioni e monitora in tempo reale. Offriamo un'esperienza user-friendly sia per chi ha appena iniziato che per i trader più esperti.

171 Totale visualizzazioniPubblicato il 2024.12.11Aggiornato il 2026.06.02

Come comprare DCR

Discussioni

Benvenuto nella Community HTX. Qui puoi rimanere informato sugli ultimi sviluppi della piattaforma e accedere ad approfondimenti esperti sul mercato. Le opinioni degli utenti sul prezzo di DCR DCR sono presentate come di seguito.

活动图片