Accumulation addresses = a bull run?

cryptoslatePubblicato 2022-08-05Pubblicato ultima volta 2022-08-05

Introduzione

A valuable metric that can be used to predict bull runs with a significant degree of accuracy is accumulation addresses. Defined as Bitcoin wallets held by investors that haven’t withdrawn or spent any of the BTC stored in them, accumulation addresses are often used to calculate the bullish sentiment in the market.

While active Bitcoin (BTC) addresses are seen as a good indicator of the overall health of the crypto market, they’re less helpful in predicting market cycles.

A valuable metric that can be used to predict bull runs with a significant degree of accuracy is accumulation addresses. Defined as Bitcoin wallets held by investors that haven’t withdrawn or spent any of the BTC stored in them, accumulation addresses are often used to calculate the bullish sentiment in the market.

Determining the number of accumulation addresses requires applying strict limitations to the data. Any amount of Bitcoin withdrawn or spent from this particular type of address immediately removes it from the cohort. When calculating the total number of accumulation addresses, Glassnode considered both cold and hot wallets.

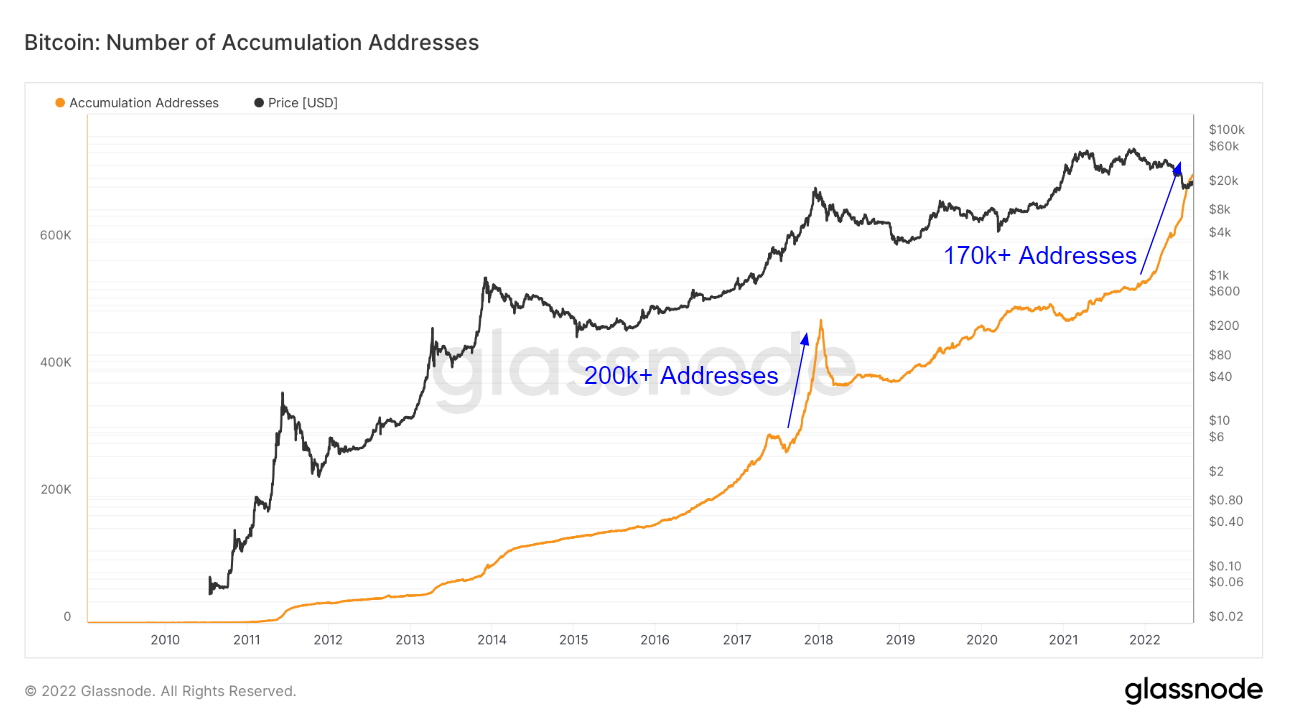
Zooming out to 2010 reveals an interesting trend — every time the number of these addresses increased, a bull run ensued.

The bull run of 2018 was preceded by the addition of 200,000 new accumulation addresses. Its peaks in 2014, 2013, and 2011 also correlated with a significant spike in the number of accumulation addresses. 

According to Glassnode’s data, accumulation addresses have grown by 18% since Jan. 1, 2022, reaching an all-time high of 700,000 addresses. 

The addition of 170,000 new accumulation addresses is typically a bullish indicator, as it shows an increasing amount of Bitcoin’s supply being taken out of the network. A drastically reduced supply of Bitcoins on exchanges then triggers an increase in buying pressure, pushing the price up. 

Letture associate

Bitcoin Trading Strategy Breakdown: Celebrity Predictions and Classic Models All Fail, Only These Four Indicators Remain

Analysis of Bitcoin Trading Strategies: Why Celebrity Forecasts and Classic Models Fail, Leaving Only These Four Reliable Indicators This analysis examines the failure of common Bitcoin prediction methods and identifies four reliable indicators for constructing a trading strategy. The author reviewed all major BTC prediction approaches from 2017-2025, categorizing them into three groups: celebrity price targets (consistently over-optimistic), analytical models like Stock-to-Flow (broken post-2022), and on-chain signals. The key finding is that more data often creates confusion, not clarity. The strategy discards unreliable elements: celebrity predictions (incentivized to be extreme), pure models (invalidated by post-ETF market changes), and the Fear & Greed Index used alone (too many false signals). Four reliable indicators were selected: 1. **MVRV Z-Score:** Accurately identifies cycle bottoms when entering its green zone (e.g., 2018, 2020, 2022). Note: Its ability to call tops is now ineffective post-2024. 2. **SOPR (28-day MA):** Consistently signals bottoms when below 1.0, indicating holders are selling at a loss. 3. **ETF Net Flow:** A crucial post-2024 metric showing institutional momentum (e.g., sustained inflows = buying). 4. **Macro Liquidity (Fed policy & M2):** Sets the overall directional bias (e.g., bullish during easing cycles). The core strategy involves waiting for a multi-signal共振 (resonance). For example, a bottom signal requires MVRV in the green zone + SOPR < 1.0. A top signal requires overheated on-chain data + sustained ETF outflows. Macro policy sets the overall direction. The Fear & Greed Index is only used as a weighted confirmatory signal, never alone. Action is only taken when three or more indicators align. The author automated this into a monitoring system that sends Telegram alerts only when signals trigger. As of the article's date (April 15, 2026), the system showed a strong bottom signal: extreme fear (F&G=12), MVRV in the buy zone, and SOPR < 1.0. The only contrary signal was weak ETF flows. Historically, such triple on-chain共振 has preceded 100%+ returns. The conclusion emphasizes building a personal framework over relying on external predictions, allowing for iterative improvement and customization based on individual risk tolerance.

marsbit43 min fa

Bitcoin Trading Strategy Breakdown: Celebrity Predictions and Classic Models All Fail, Only These Four Indicators Remain

marsbit43 min fa

Trading

Spot
Futures
活动图片