作者 | Asher(@Asher_ 0210)
每年春晚直播期间,链上“土狗行情”往往会明显升温,但除了追逐热点 Meme 代币,今年多了一种更有意思的互动方式——围绕春晚相关话题参与预测市场。
目前,围绕 2026 年央视春晚上线的预测事件数量仍然不多,但已经覆盖关键词提及、机器人品牌出场、嘉宾是否登台等多个方向。本文将对春晚相关预测市场题目进行持续盘点与更新,在春晚正式播出前动态补充最新上线事件,方便读者实时跟踪。
2026 年央视春晚会提及哪些词语?
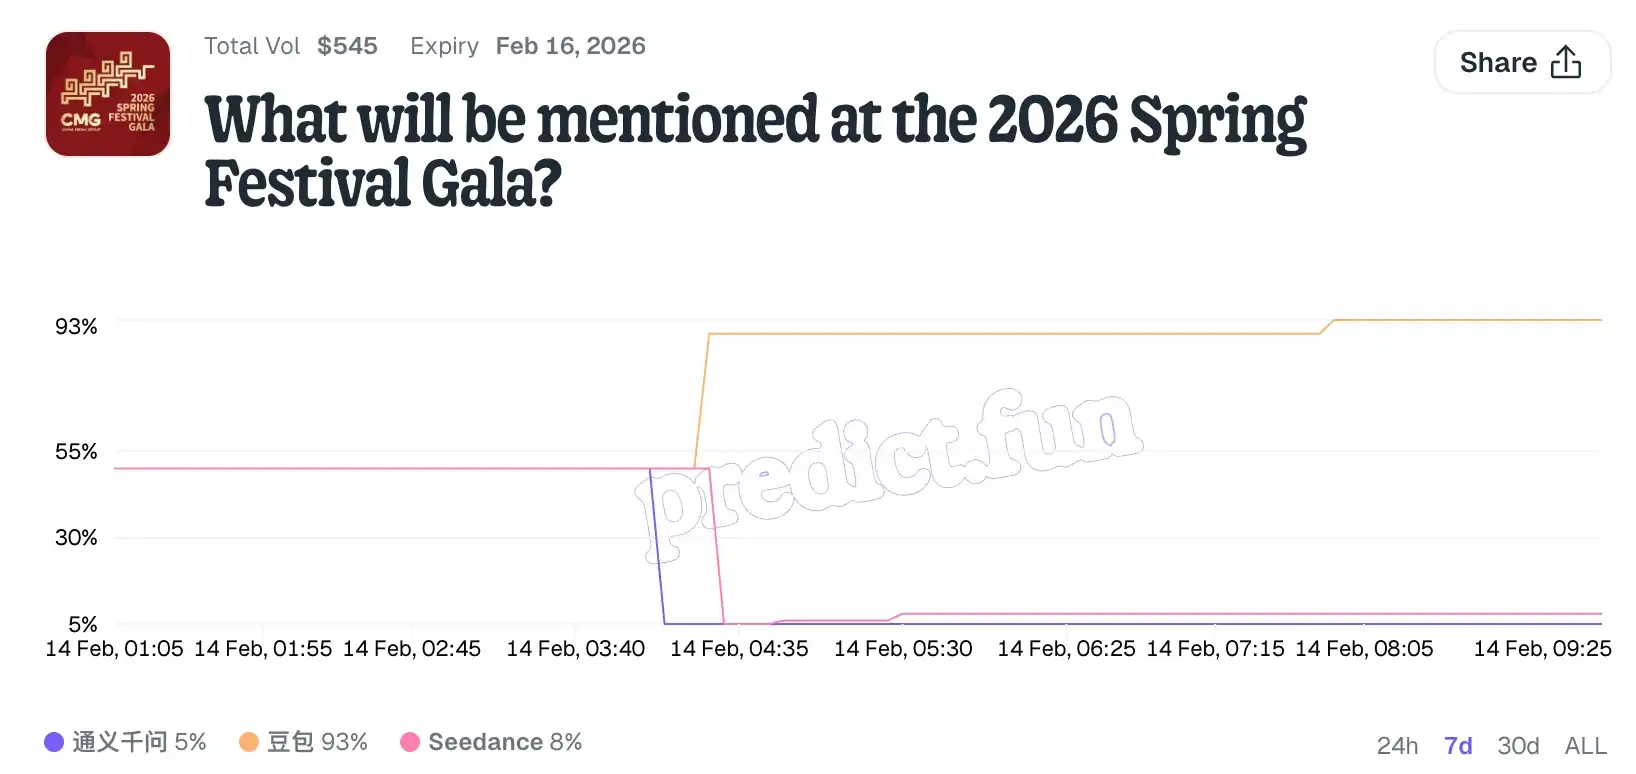
- 事件合约链接:https://predict.fun/market/what-will-be-mentioned-2026-spring-festival-gala
- 对应英文:What will be mentioned at the 2026 Spring Festival Gala?
- 给出的词组分别为:通义千问、豆包、seedance、deepseek、kimi、文心一言、哈基米、马到成功、龙马精神、一马当先、万马奔腾、马不停蹄、快马加鞭、天马行空、一马平川。
- 判定条件:在 CCTV-1 春晚直播期间,问答环节、广告、产品推广、观众发言、短剧、歌曲介绍或任何口述部分提及指定词语都将计入。
哪些机器人会在 2026 年央视春晚上表演节目?
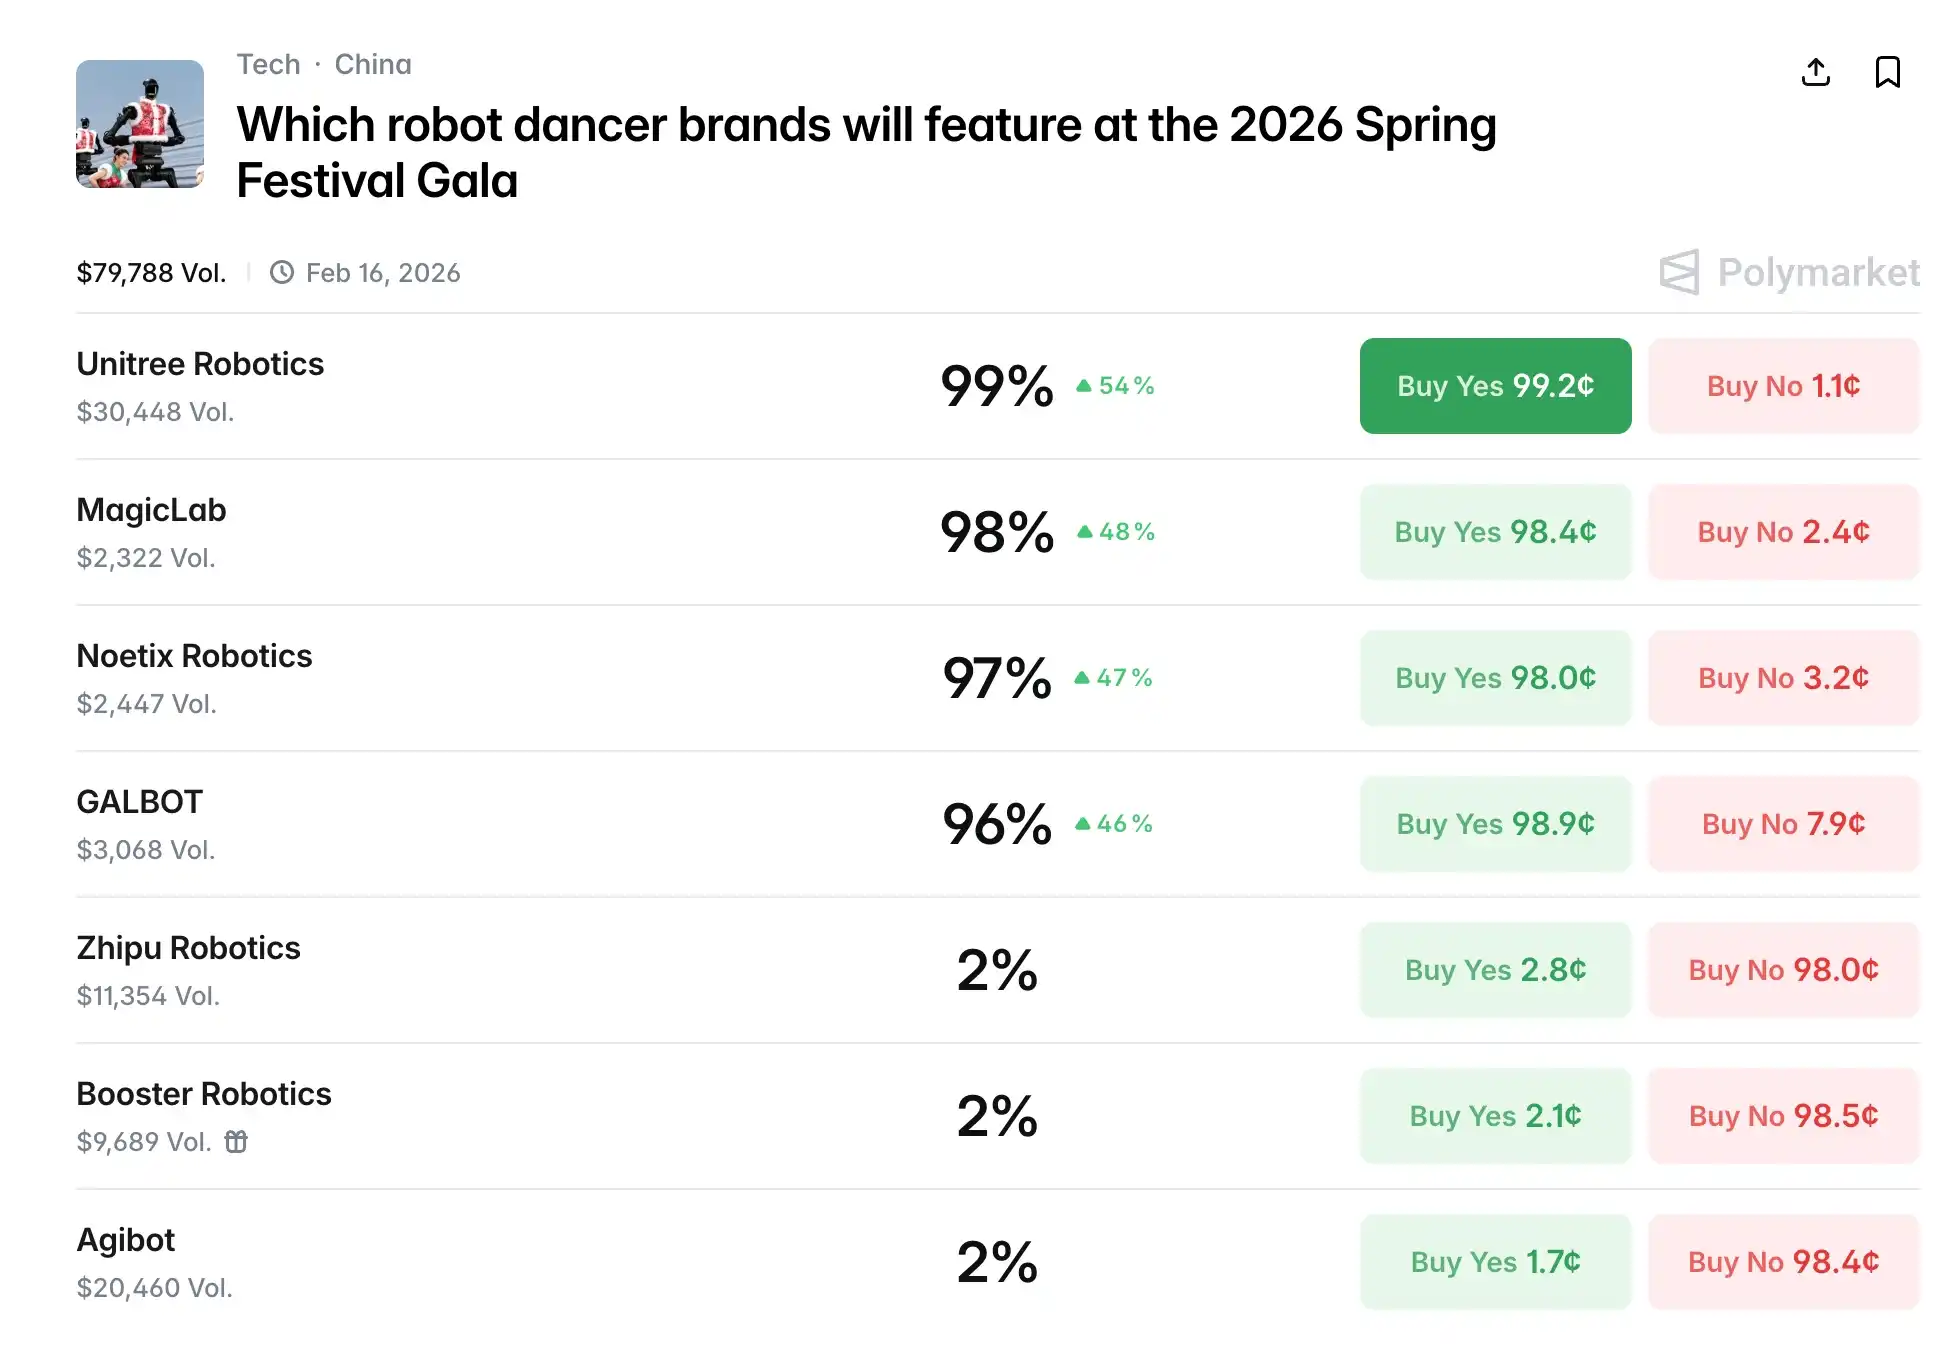
- 事件合约链接:https://polymarket.com/event/which-robot-dancer-brands-will-feature-at-the-2026-spring-festival-gala
- 对应英文:Which robot dancer brands will feature at the 2026 Spring Festival Gala?
- 给出的词组分别为:Unitree Robotics(宇树机器人)、MagicLab(魔法原子机器人)、Noetix Robotics(松延动力机器人)、GALBOT(银河通用机器人)、Booster Robotics(博斯特机器人)、Zhipu Robotics(智普机器人)、Agibot(智元机器人)
李谷一会在 2026 年央视春晚上表演节目吗?
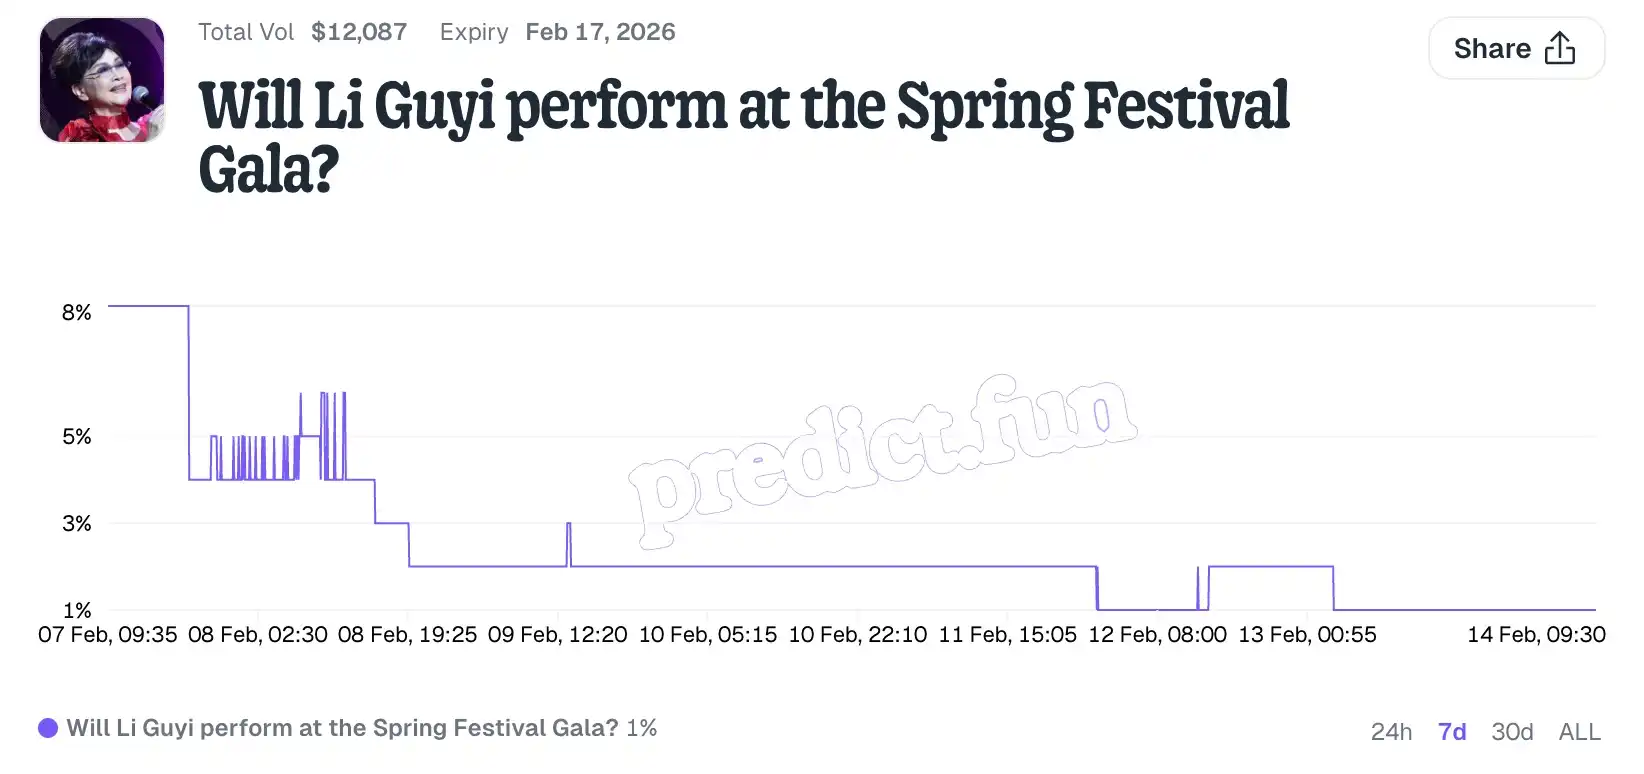
- 事件合约链接:https://predict.fun/market/will-li-guyi-perform-at-the-spring-festival-gala
- 对应英文:Will Li Guyi perform at the Spring Festival Gala?
个人看法:纯理财局,新浪新闻报道,李谷一在电话连线中表示,因身体原因,将缺席2026年央视春晚。她向观众表达歉意和感谢,并提前向大家拜年:“我的身体状态不大好,实在无法登上春晚,真的很对不起观众朋友们。”
相关内容
天天玩预测市场的我,看到了这些创新和变化
预测市场被低估的优势:逆行情,反波动,随时有得玩